Santa Clara County September Real Estate Market Report 2020

Santa Clara County Real Estate
September 2020 Report
In the context of the horrible fires we’ve seen in recent weeks – with many of our Bay Area communities and neighbors so terribly affected – a real estate report seems trivial. But since we have clients still trying to make buying and selling decisions, we will try to continue to deliver straightforward data on market conditions.
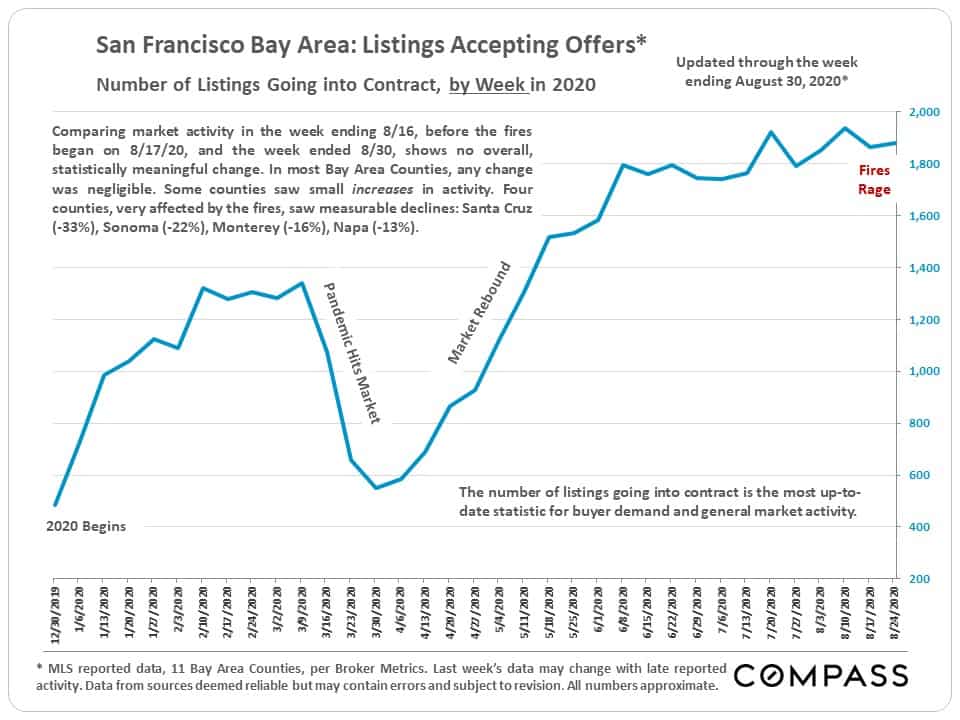
Surprisingly, the fires did not significantly impact the number of deals being made in most Bay Area counties during the last 2 weeks of August – the exceptions being Santa Cruz, Sonoma, Monterey and Napa Counties, which saw declines of 13% to 33%. Santa Clara County actually saw activity increase in the second half of the month. (This chart looks at week by week activity in the Bay Area.)
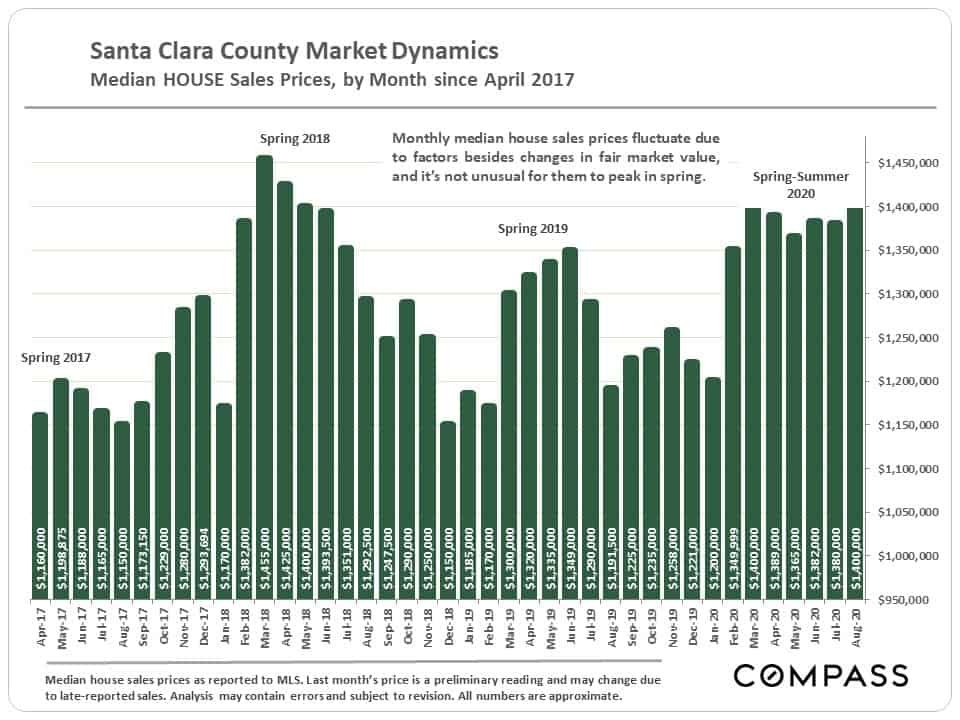
Median house sales price trends:
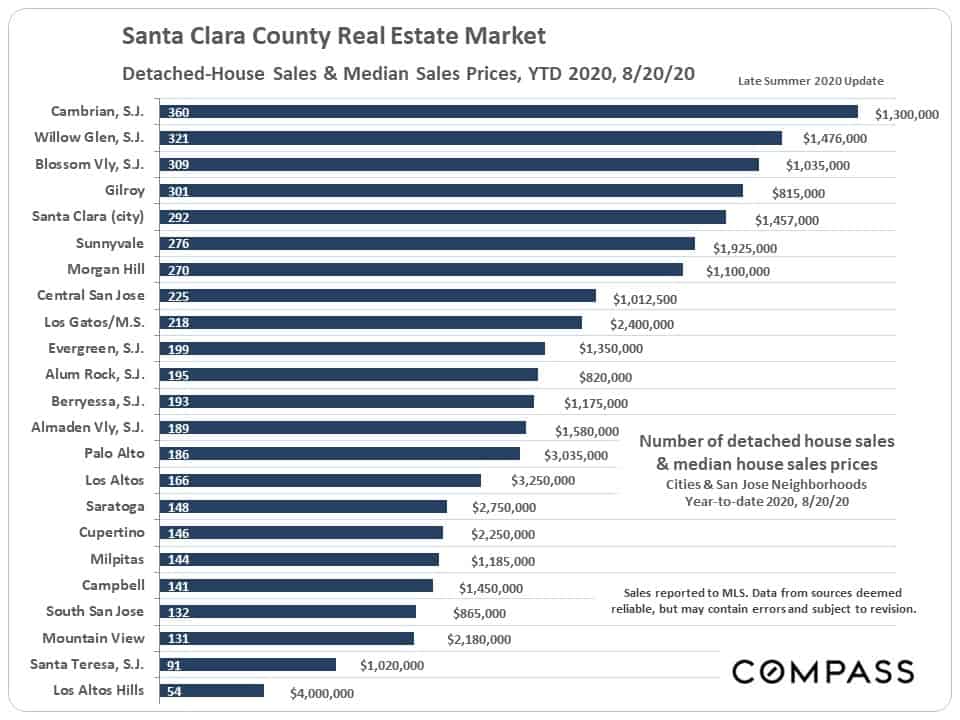
Year-to-date house sales and median house sales prices by city or San Jose neighborhood:
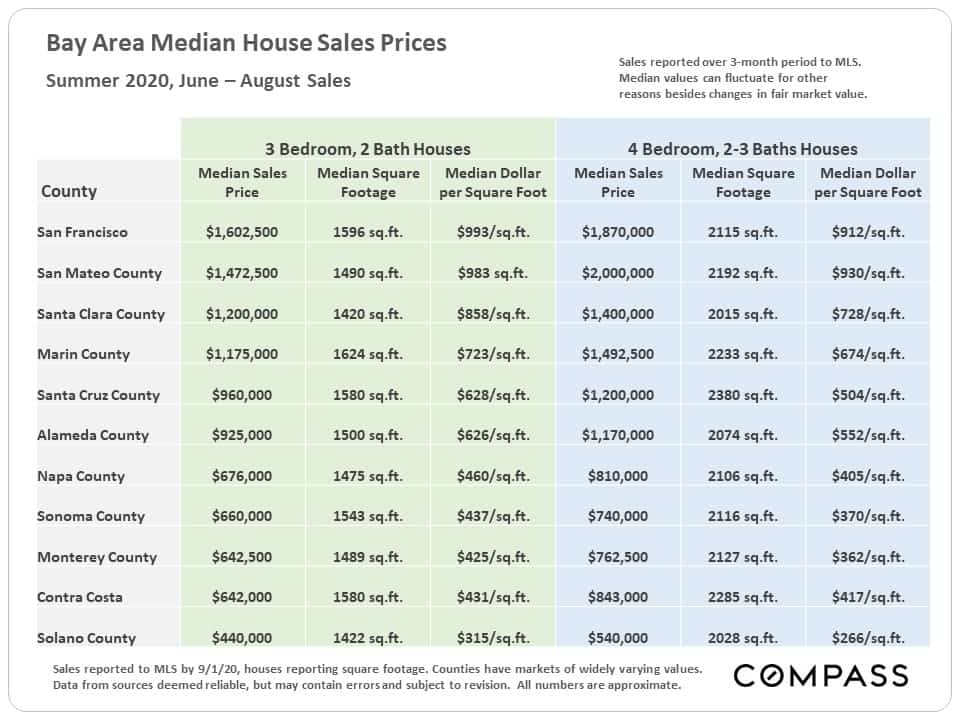
Bay Area median house sales prices by county:
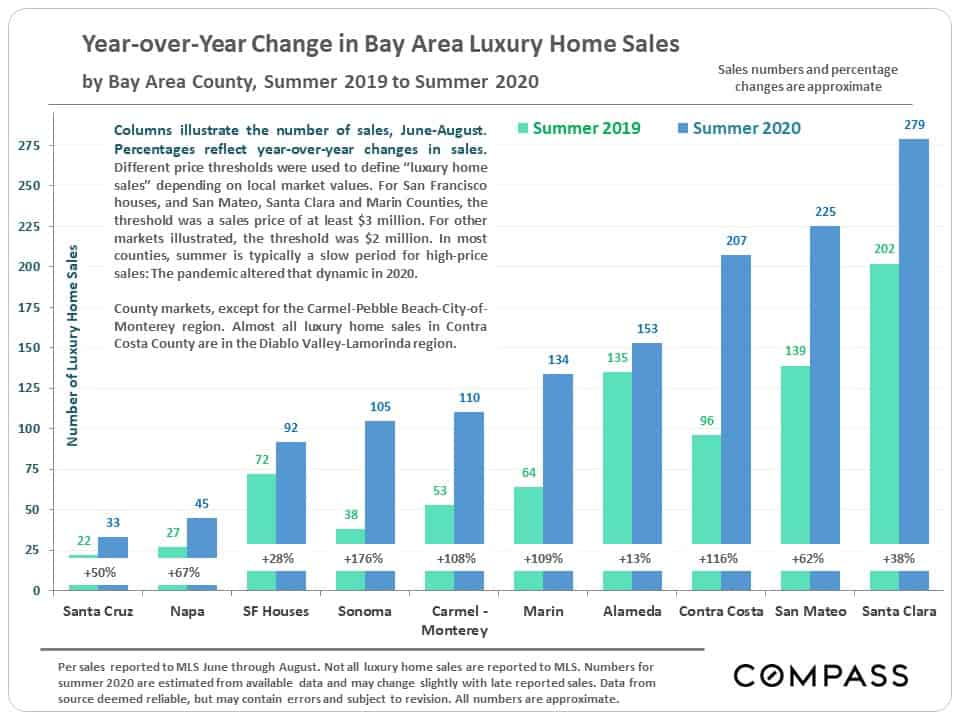
Bay Area luxury home markets: Year-over-year summer sales volumes and percentage changes. Santa Clara County – the largest luxury home market in the Bay Area – saw a solid increase in sales over summer 2019. Some counties saw stupendous jumps.
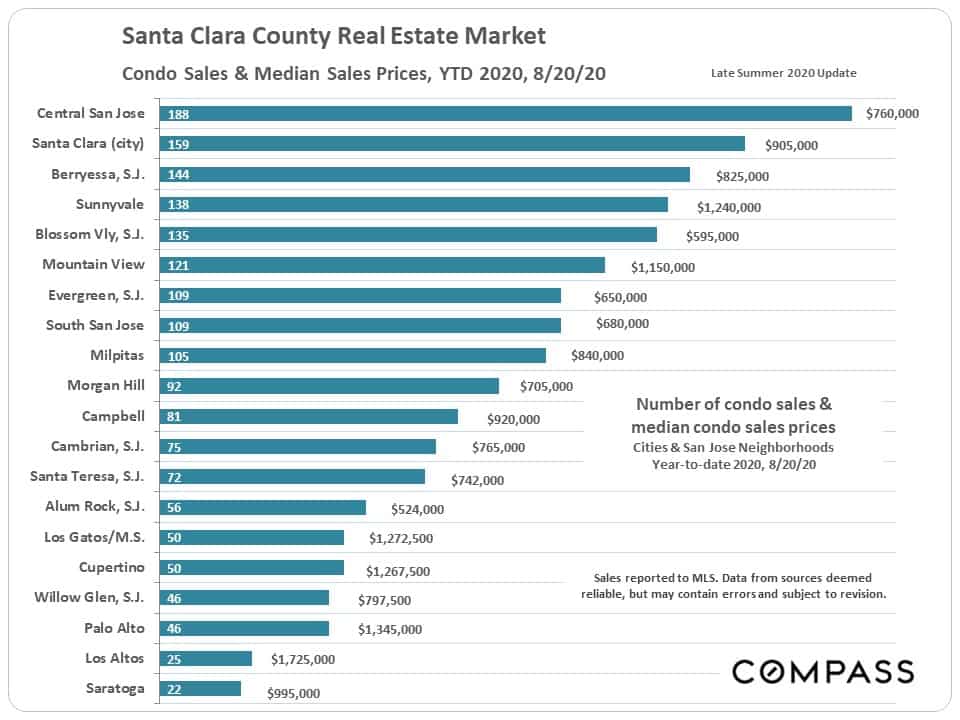
Santa Clara County year-to-date condo sales and median condo sales prices by city or San Jose neighborhood:
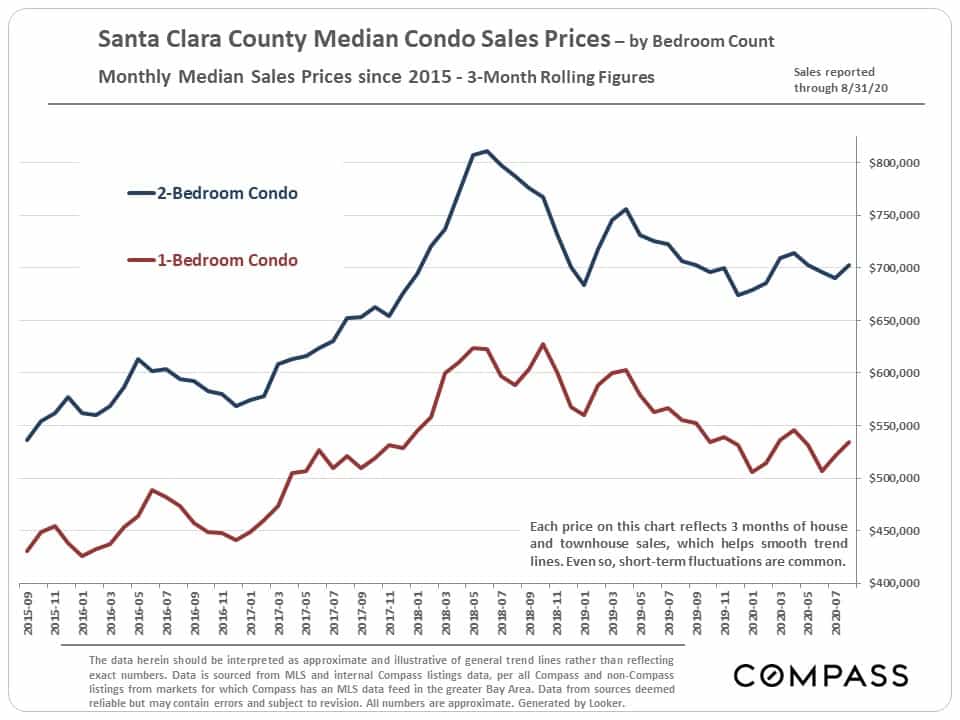
Median condo sales price trends by bedroom count: Demand in the condo market has been weaker than in the house market, a relatively common situation around the Bay Area.
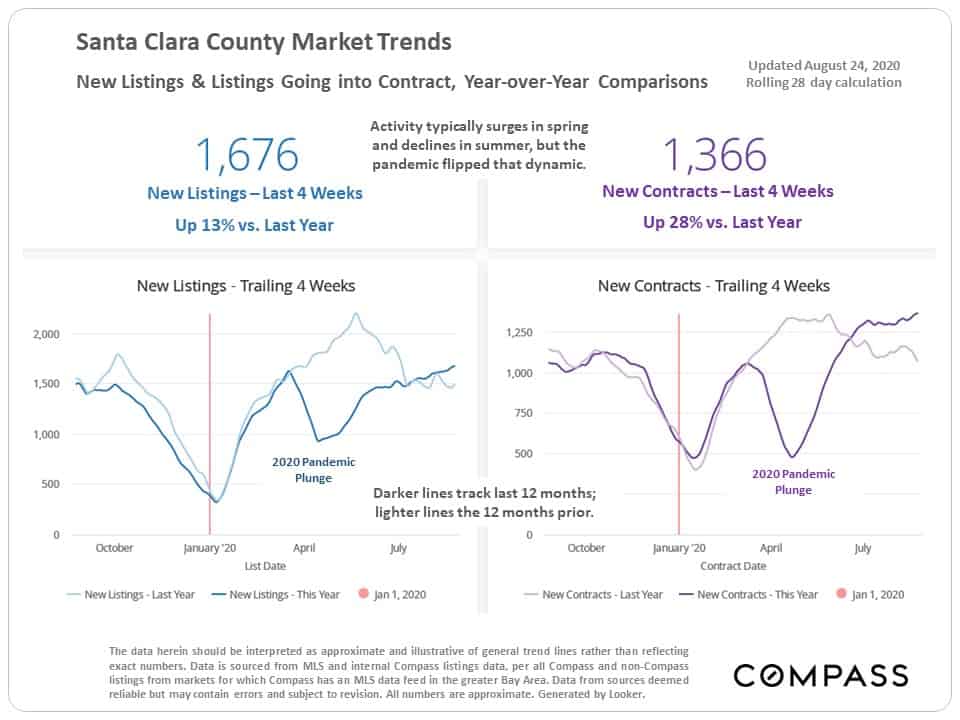
Year-over-year trends in new listings coming on market, and listings going into contract.
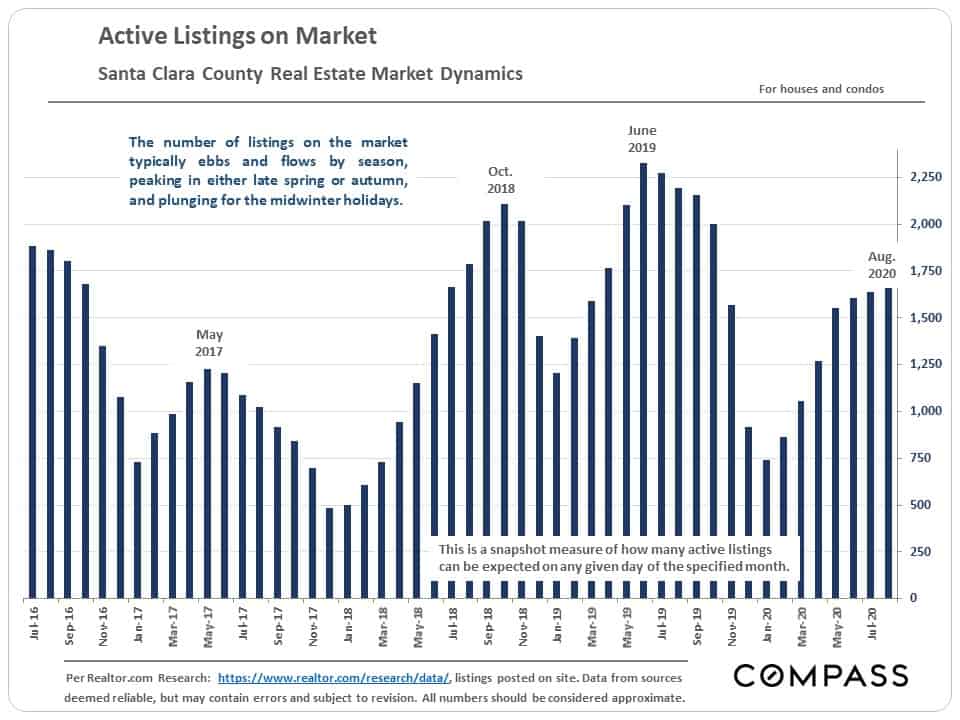
A snapshot measure of how many listings were typically active on any given day of the specified month: The inventory of active listings for sale has remained low in the face of increasing demand.
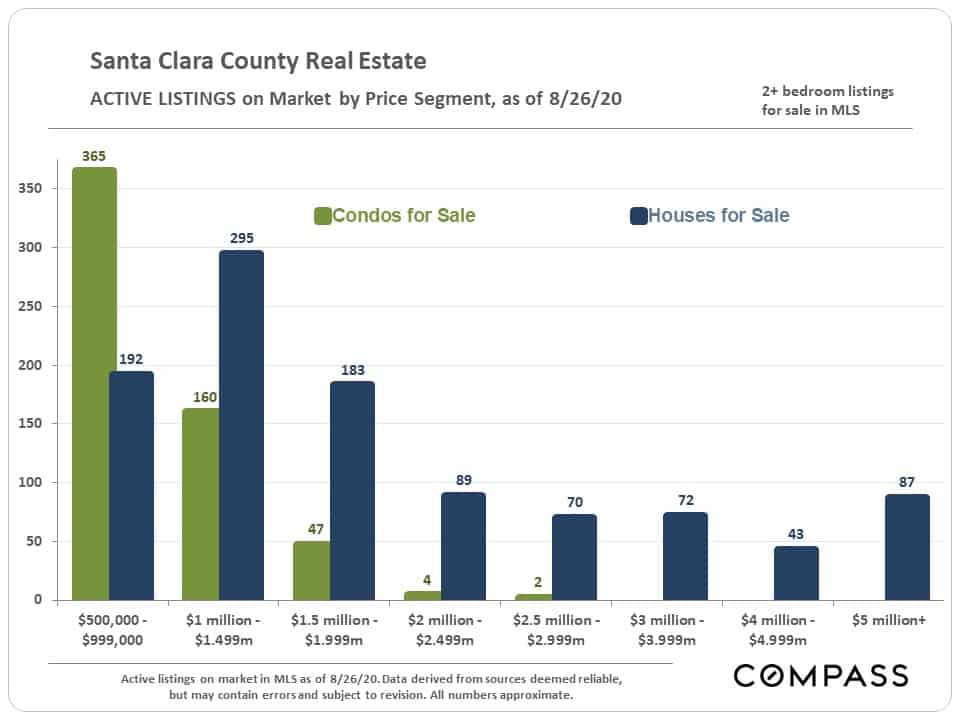
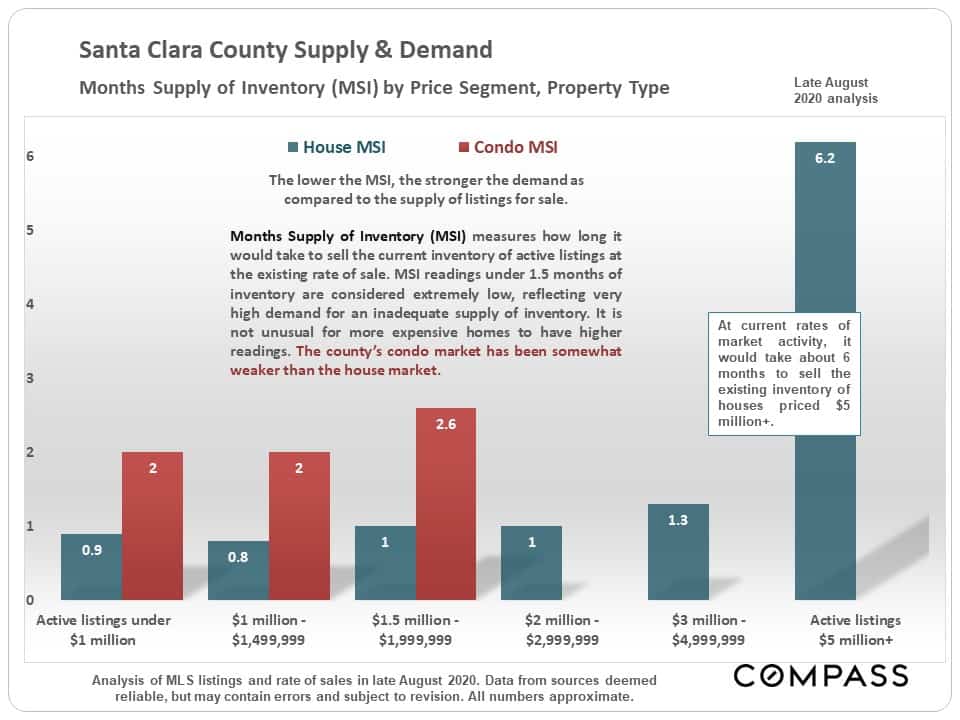
A snapshot of the number of active 2-bedroom+ listings on the market in late August by price segment. These figures change daily as new listings arrive and existing listings go into contract.
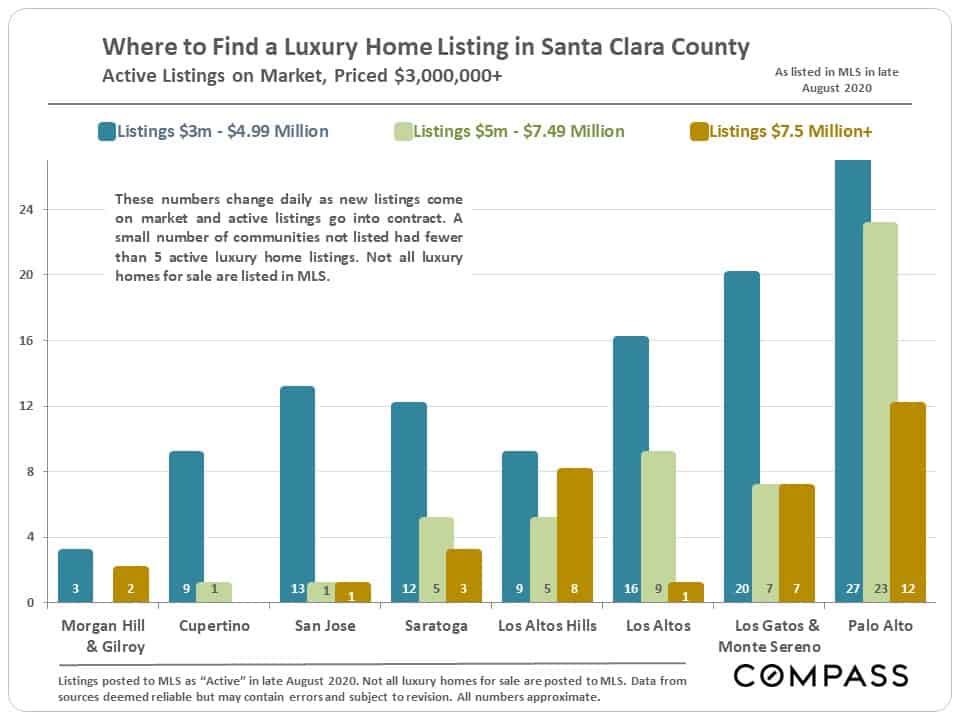
Active luxury home listings on the market in late August for major county markets. These numbers change daily.
The lower the Months Supply of Inventory (MSI), the stronger the demand as compared to the supply of listings. Most of the market remains deep in “seller’s market” territory by this measure – some price segments are particularly heated. As mentioned before, the condo market is somewhat softer than the house market.
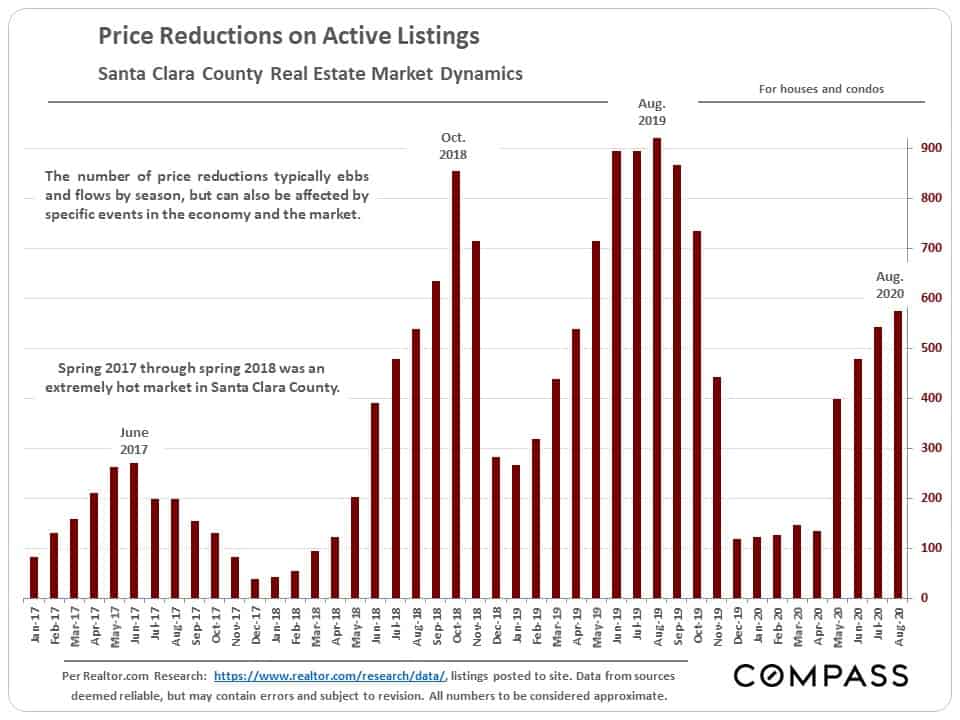
The number of price reductions remains relatively low, another indicator of a strong market.
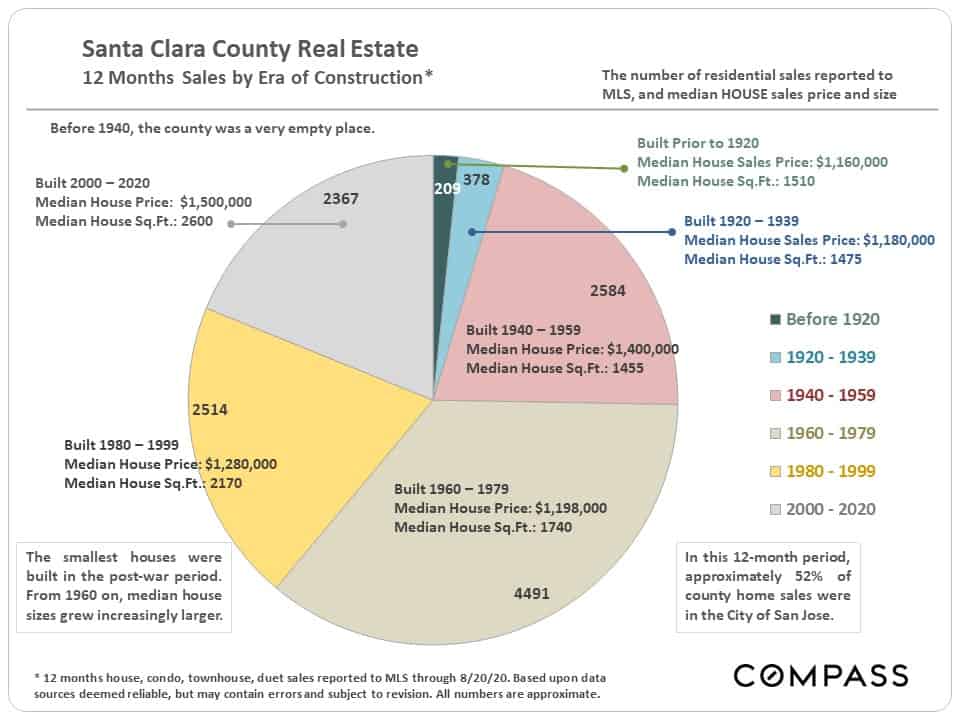
A breakdown of house sales by era of construction: