Santa Clara County October Real Estate Market Report 2020

Santa Clara County Real Estate
7 Months after the Pandemic Struck
October 2020 Report
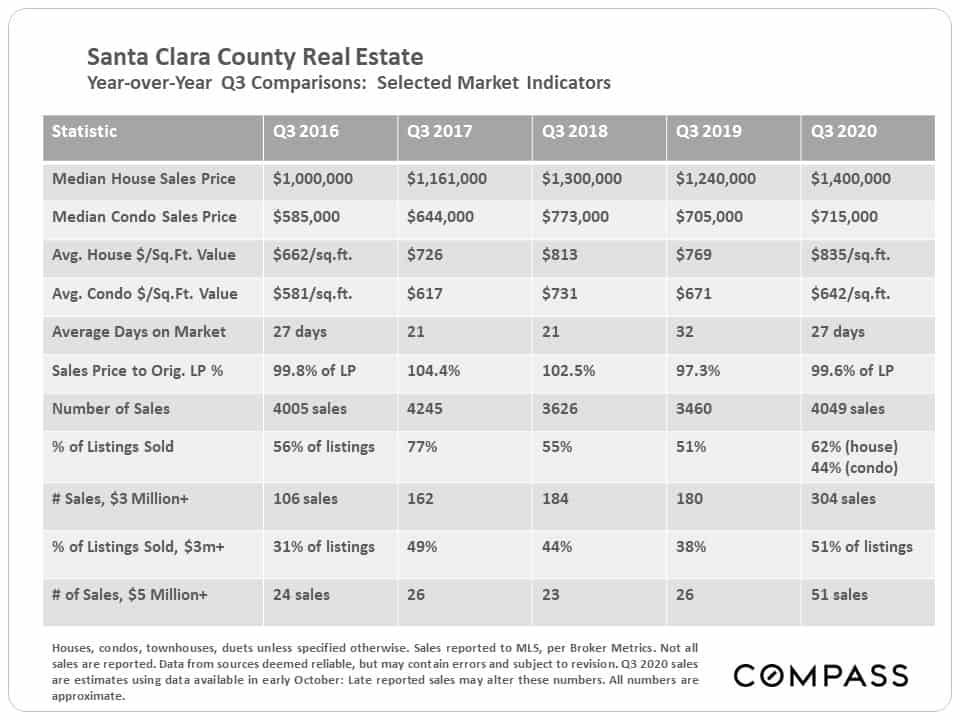
The table below compares Q3 statistics across 5 years. This year, the pandemic pushed the typical heat of the spring Q2 market to Q3. As mentioned in previous reports, the condo market has been softer than the house market, a common dynamic in most of the Bay Area.
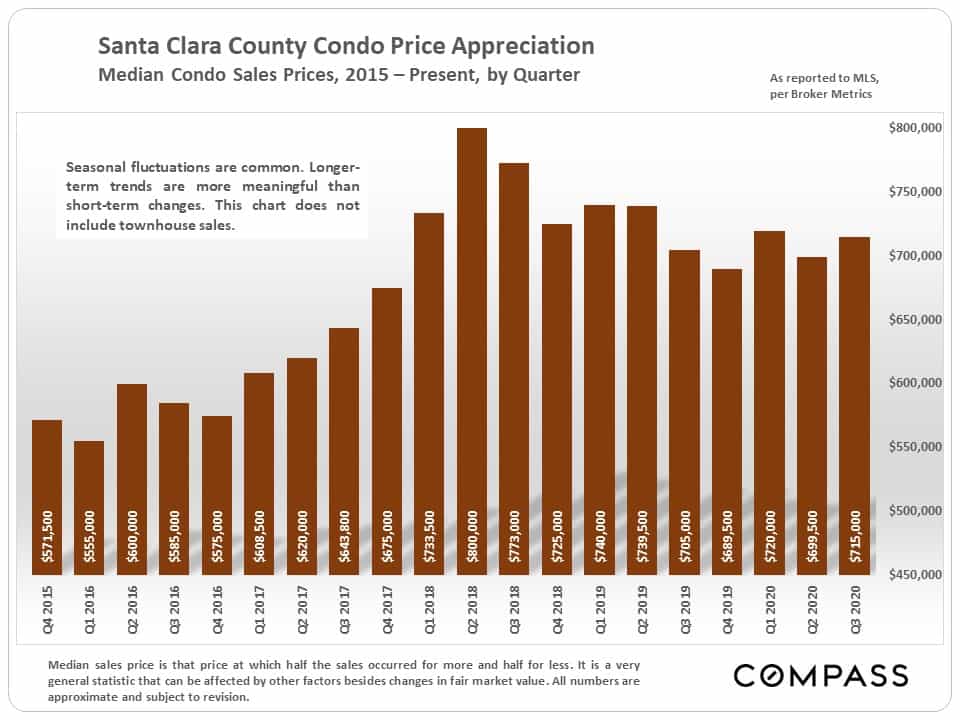
Median House & Condo Sales Price Trends by Quarter
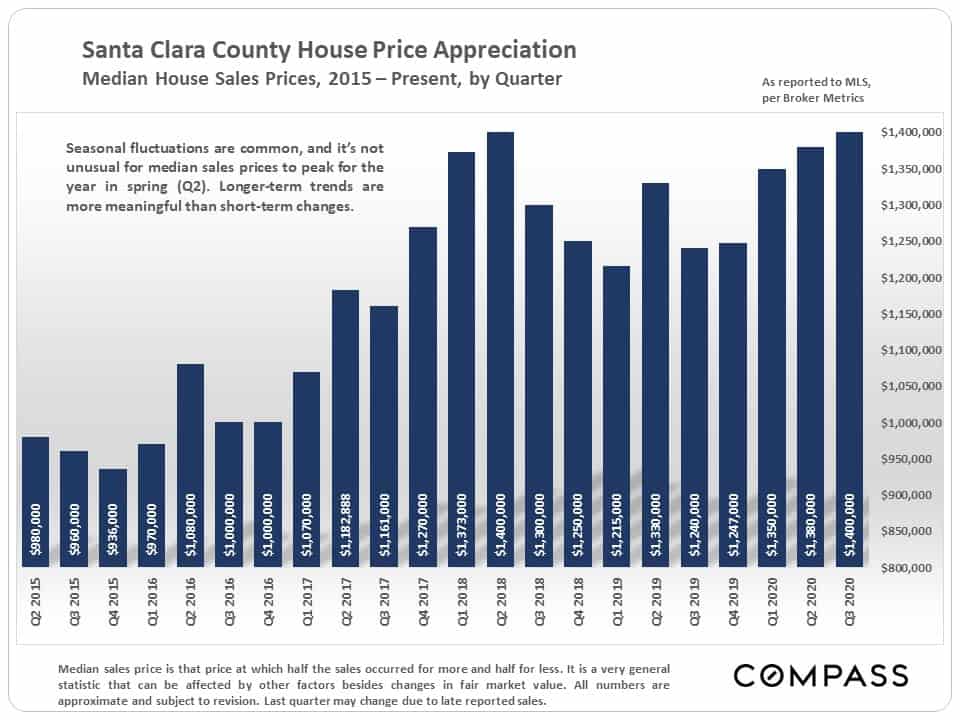
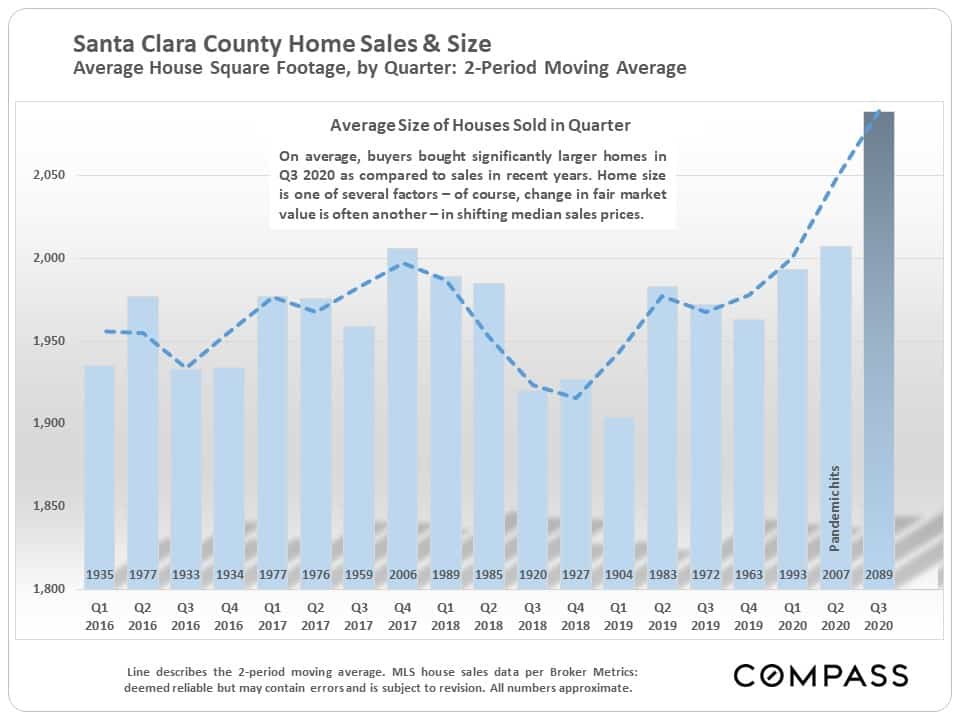
Median sales prices can rise because of increases in fair market value – i.e. buyers are paying more money for the same home (supply and demand) – and/or because buyers are purchasing larger, more expensive houses. Both dynamics are probably currently at play, but it is certain that affluent and very affluent buyers have made up a dramatically increasing percentage of the total market throughout the Bay Area. In Santa Clara County, the average size of houses sold in Q3 saw a large year-over-year jump.
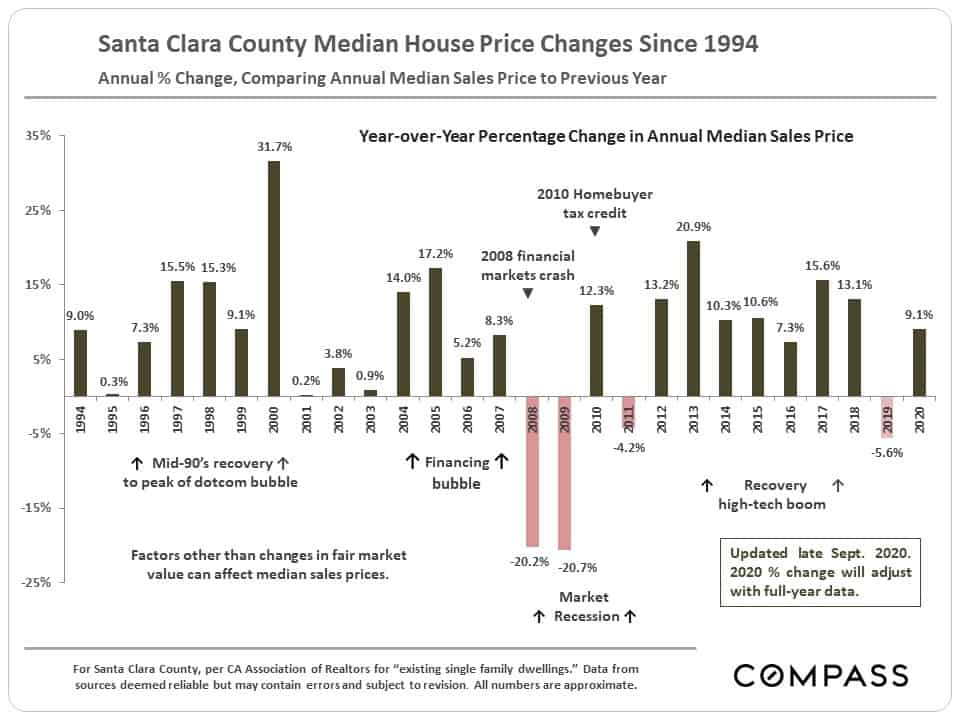
Annual percentage changes in median house sales price: The 2020 YTD percentage will almost certainly change, one way or another, by the time full-year sales data is in.
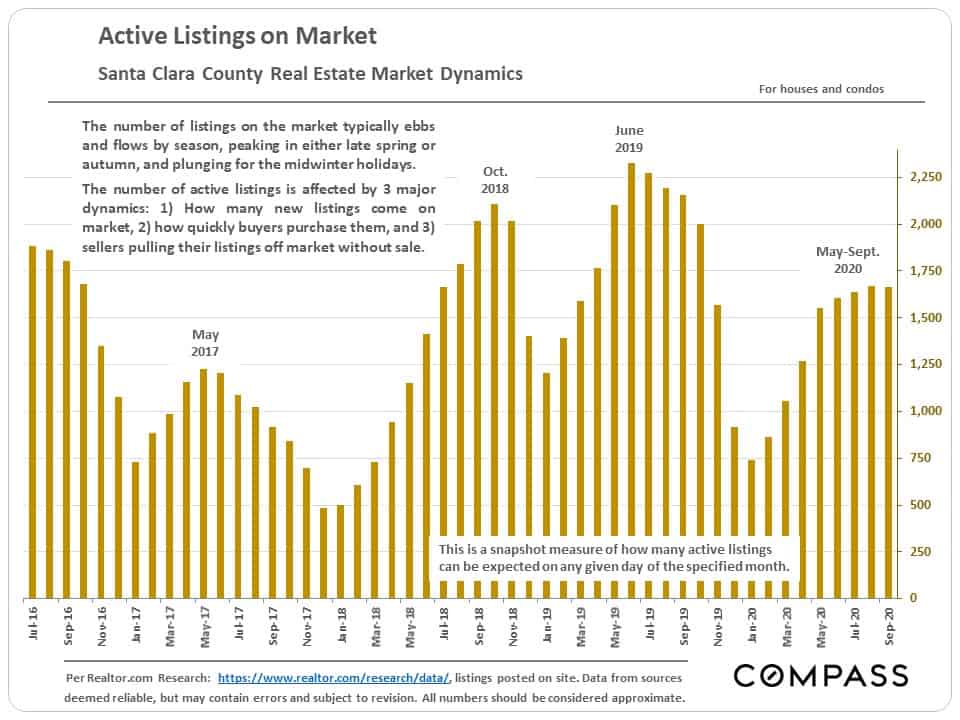
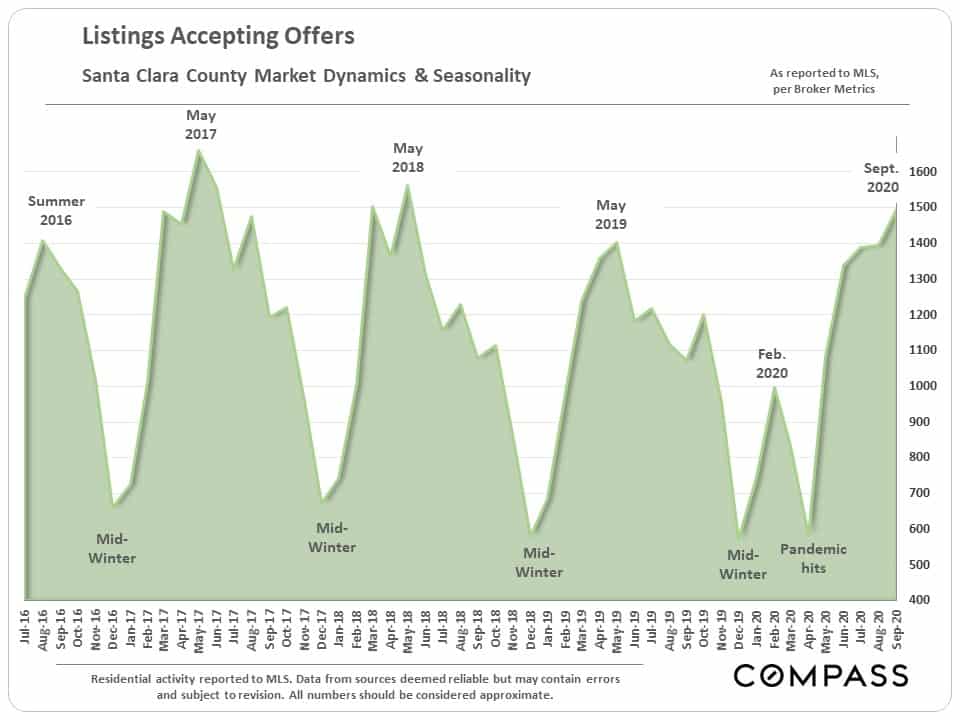
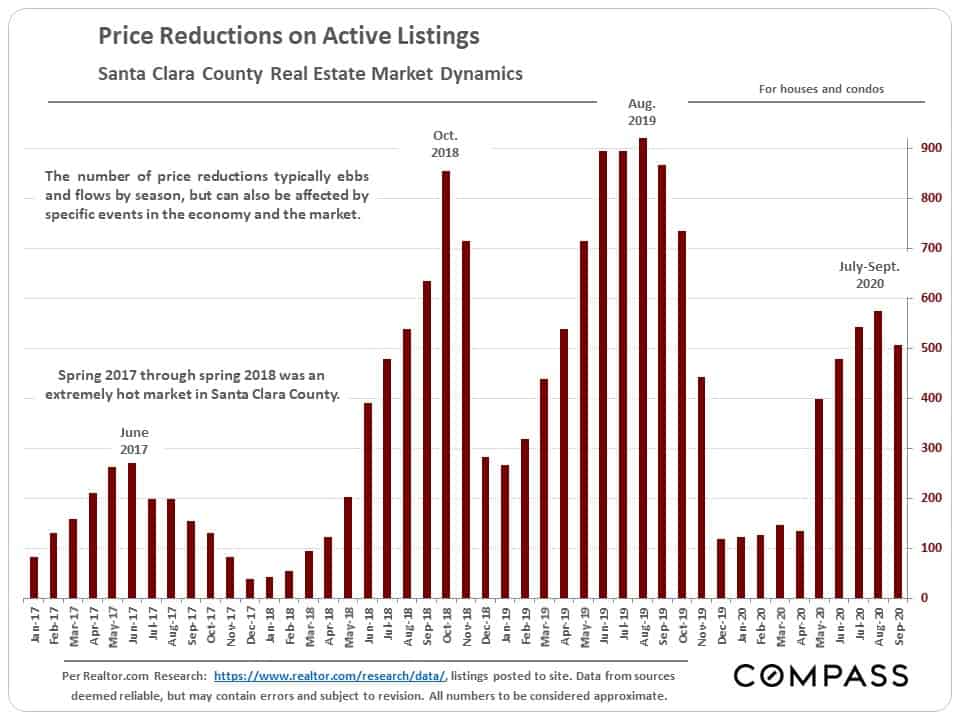
Supply & Demand
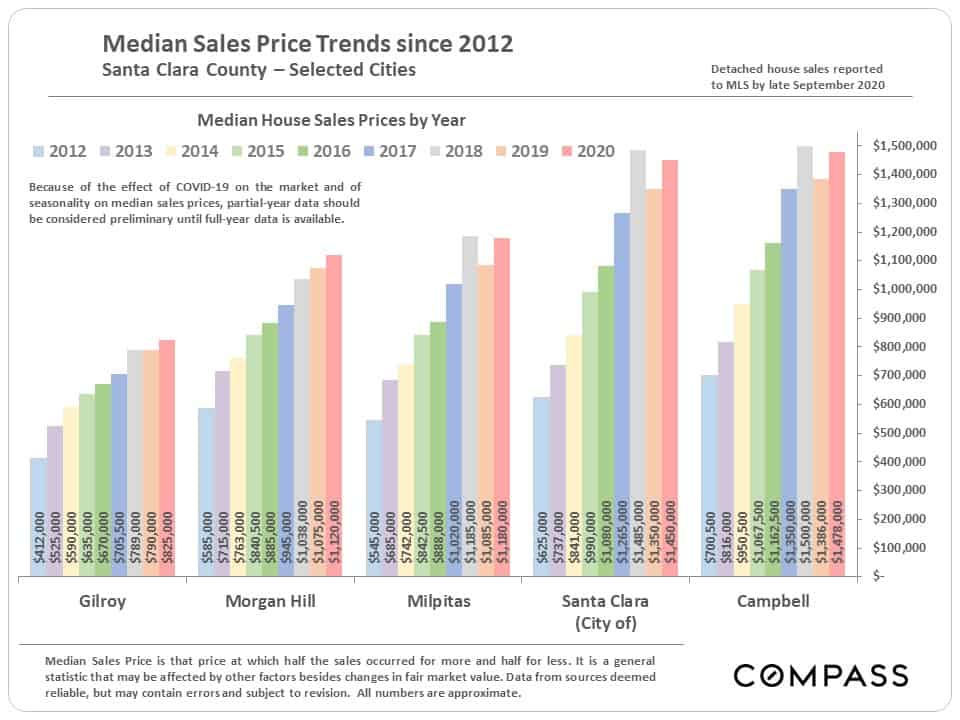
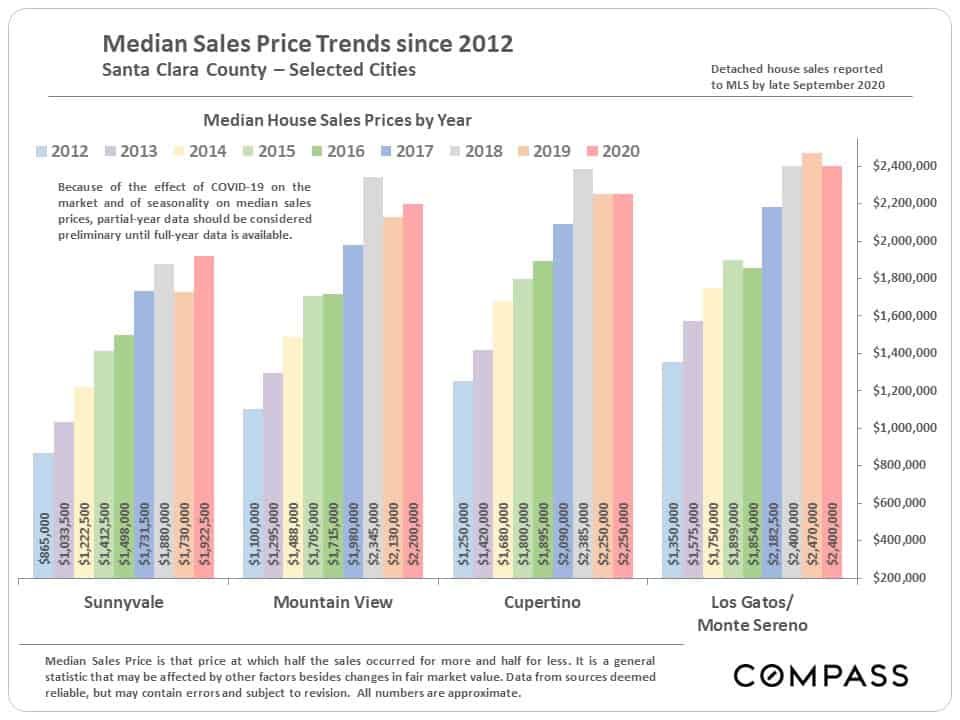
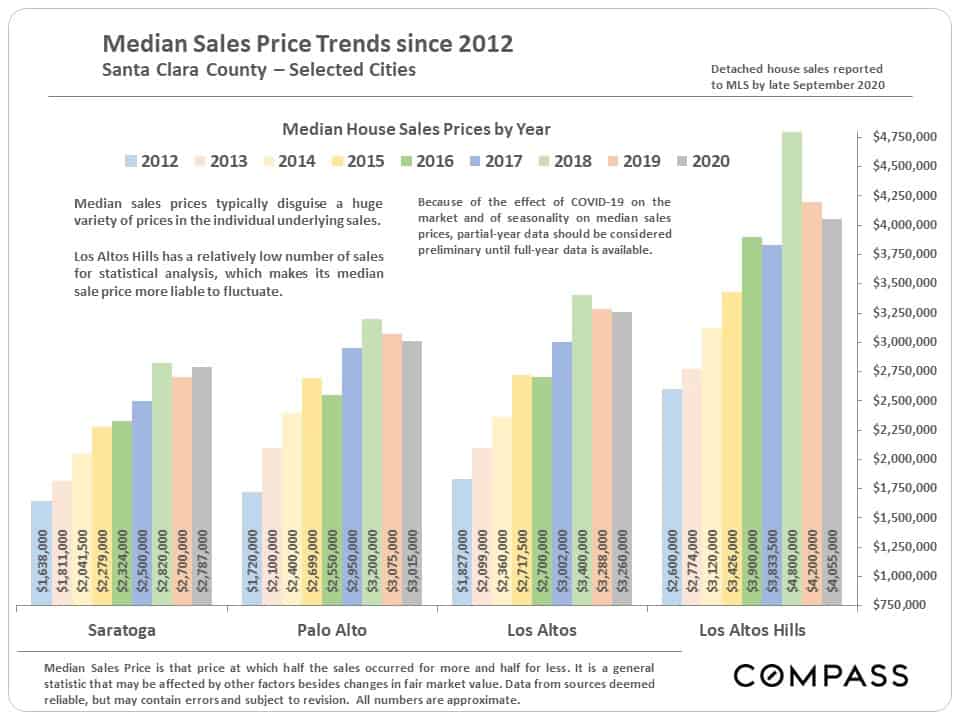
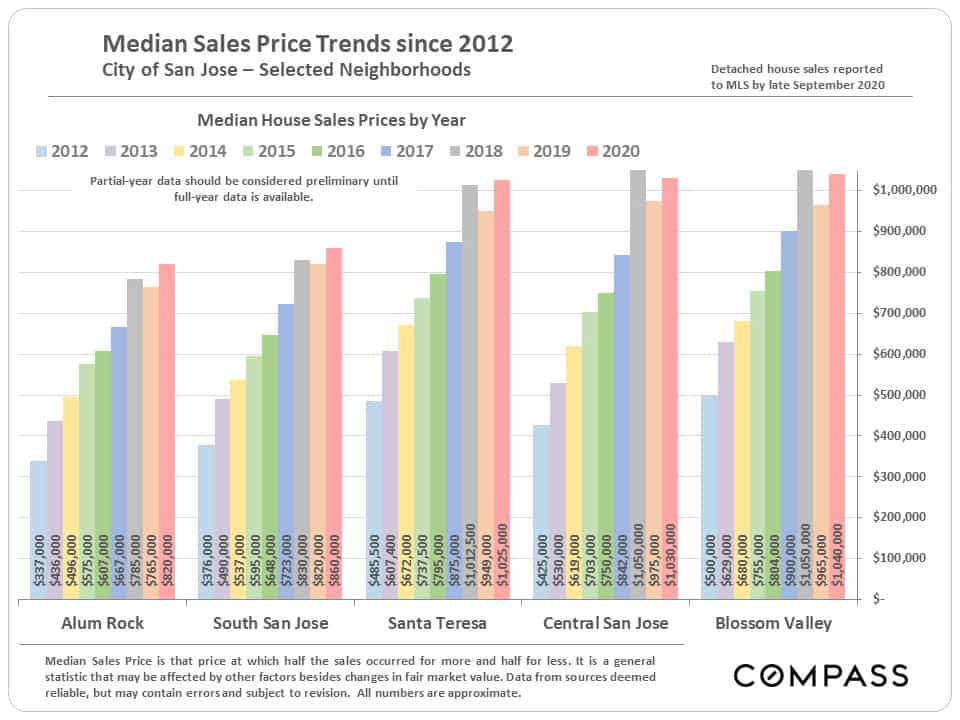
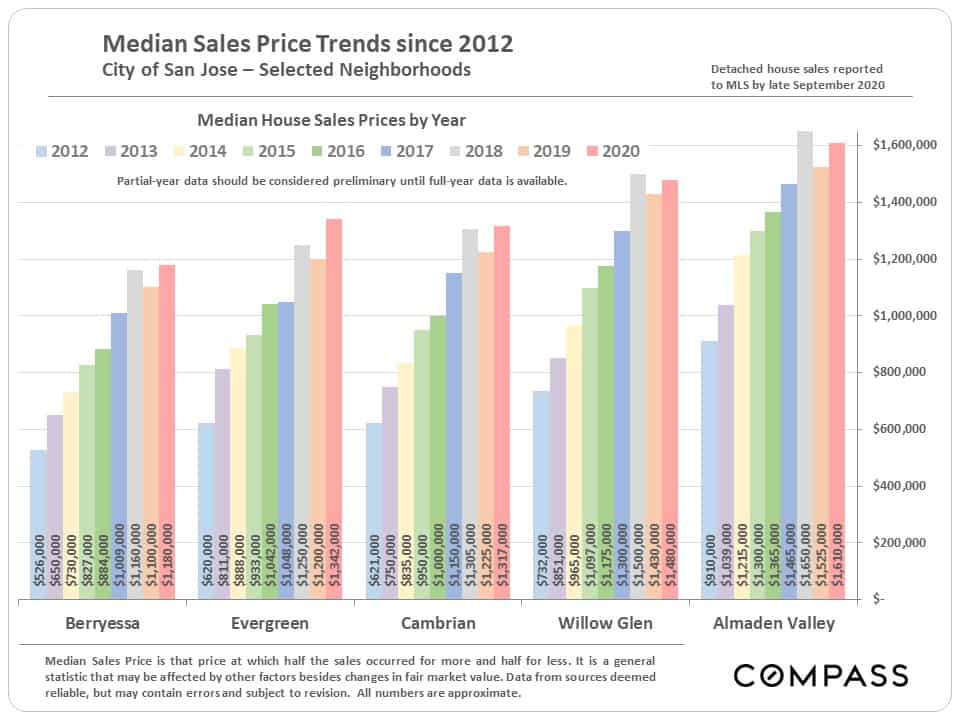
Median House Sales Price Trends by City
& by San Jose Neighborhood
In September, we also updated our semi-annual Survey of Bay Area Markets.