Santa Clara County November Real Estate Market Report 2020
Santa Clara County Real Estate
November 2020 Report Focusing Mostly
on City Market Dynamics
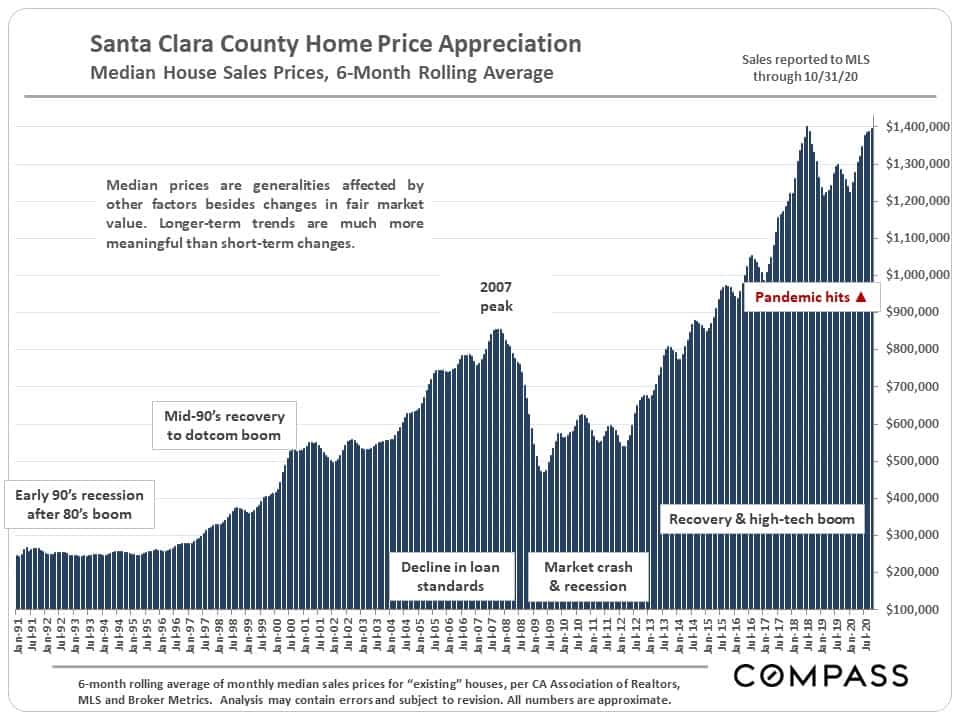
The long-term median sales price chart below is similar to those for counties around the Bay Area – a significant spike in median house prices since the pandemic struck in early spring. (Bay Area condo markets have not seen comparable increases in prices.)
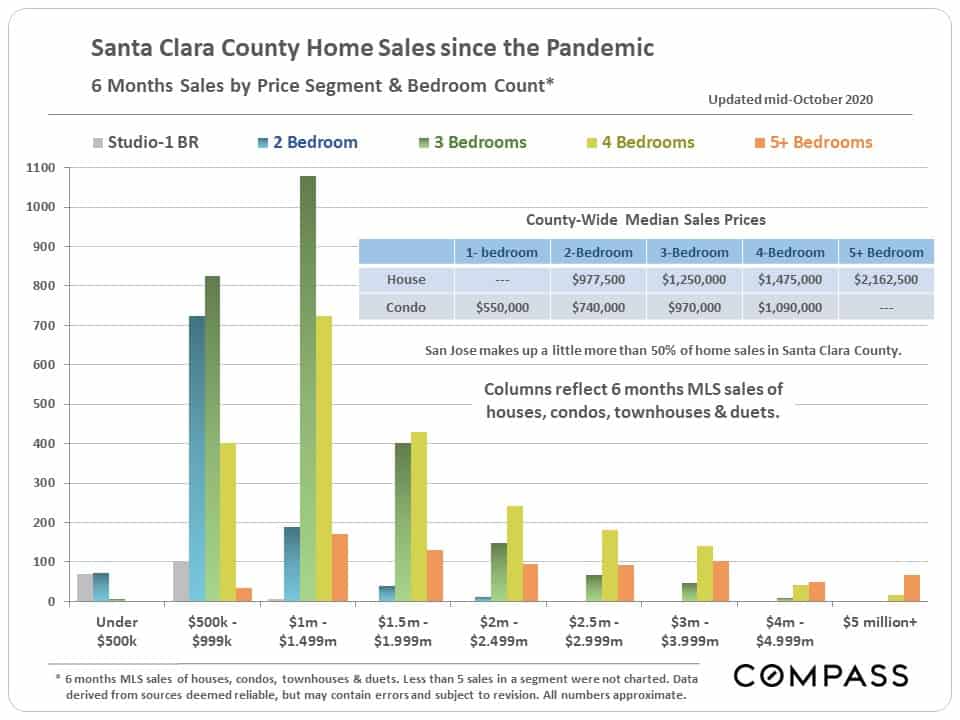
As mentioned before, recent jumps in median house prices have been driven not only by appreciation in fair market values, but by large increases in expensive home sales. Affluent buyers have made up a significantly larger percentage of Bay Area home purchases since the pandemic hit.
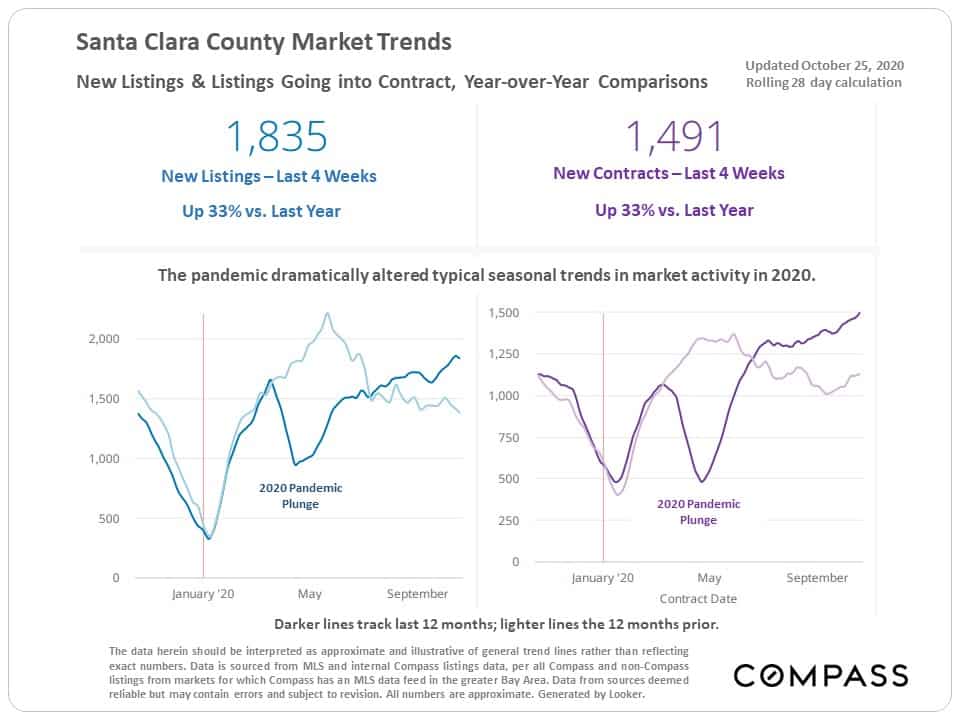
The market typically starts a big slowdown in mid-November, running through the mid-winter holidays, until it begins to wake up in mid-January: New listings and sales plummet, and listings pulled off the market soar. Higher-price segments normally see the most dramatic plunges in mid-winter activity.
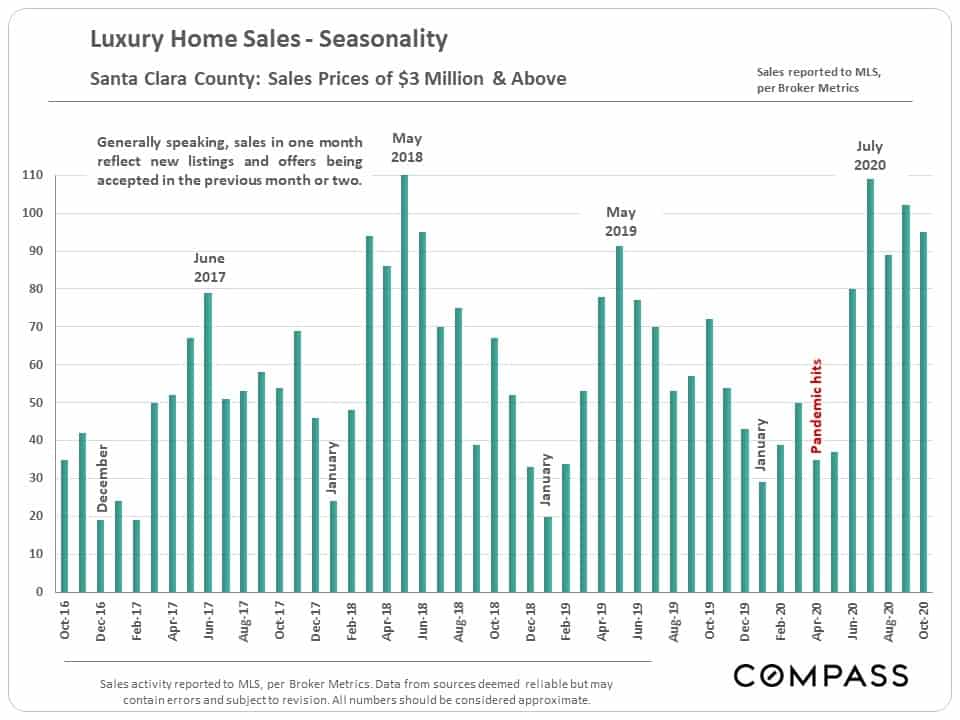
This year, the pandemic upended seasonality: Spring, usually the strongest selling season, saw a crash in activity; summer, which typically slows down – especially for luxury home sales – saw extremely high demand, particularly at the high end; and the heated summer market ran right into autumn, with most county markets generally unfazed by the terrible fires.
We suspect late Q4 will see a slowdown, but remain more active than in past years.
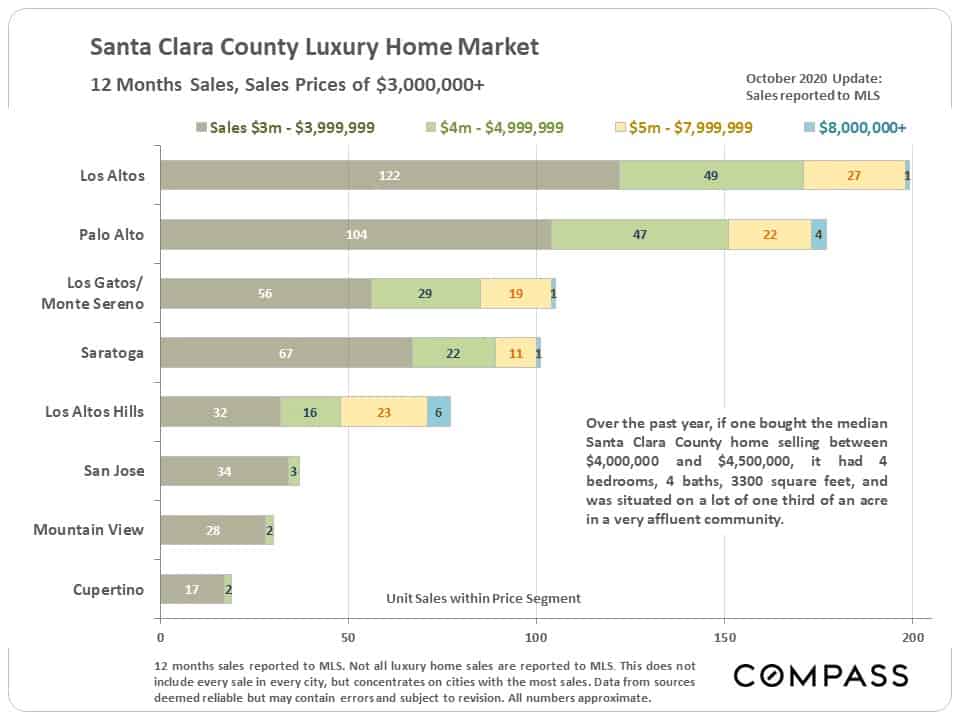
Luxury Home Sales by Month
Home Sales Breakdown
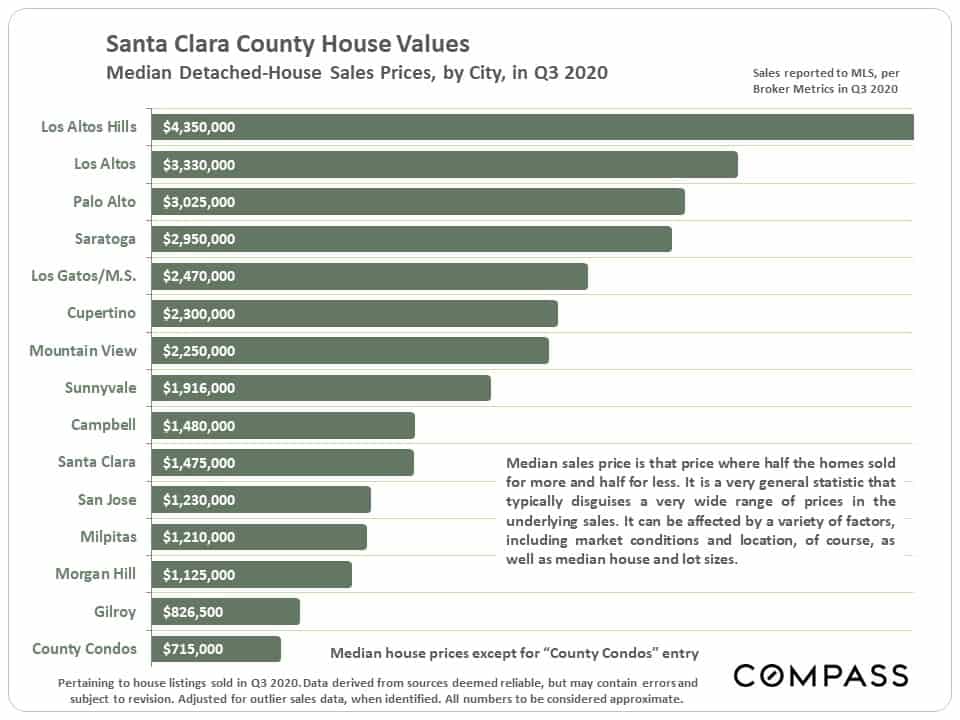
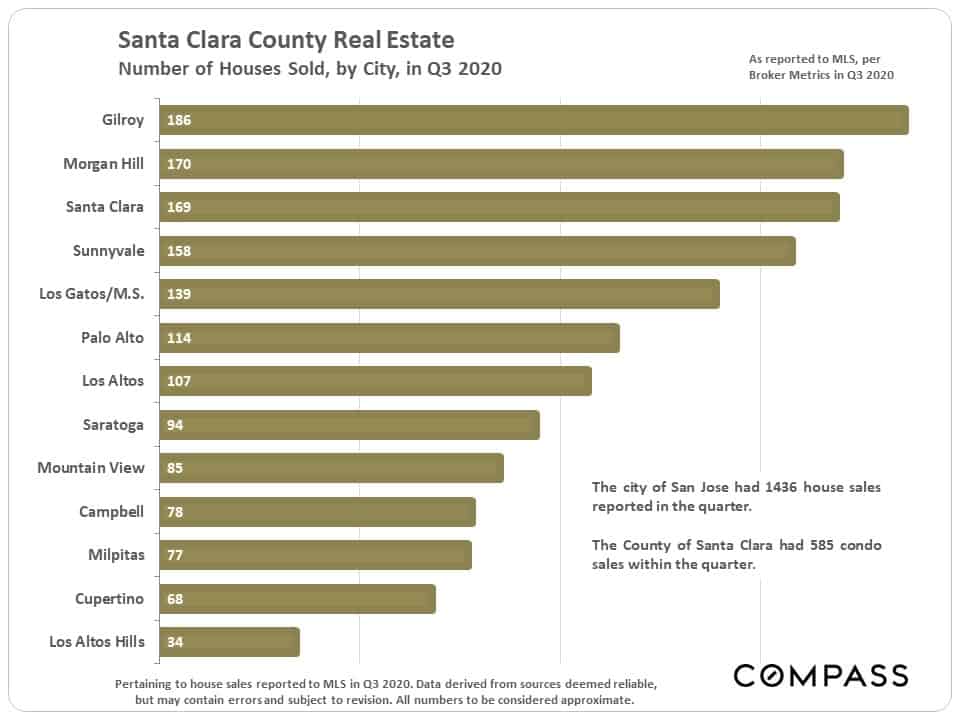
Market Dynamics by City
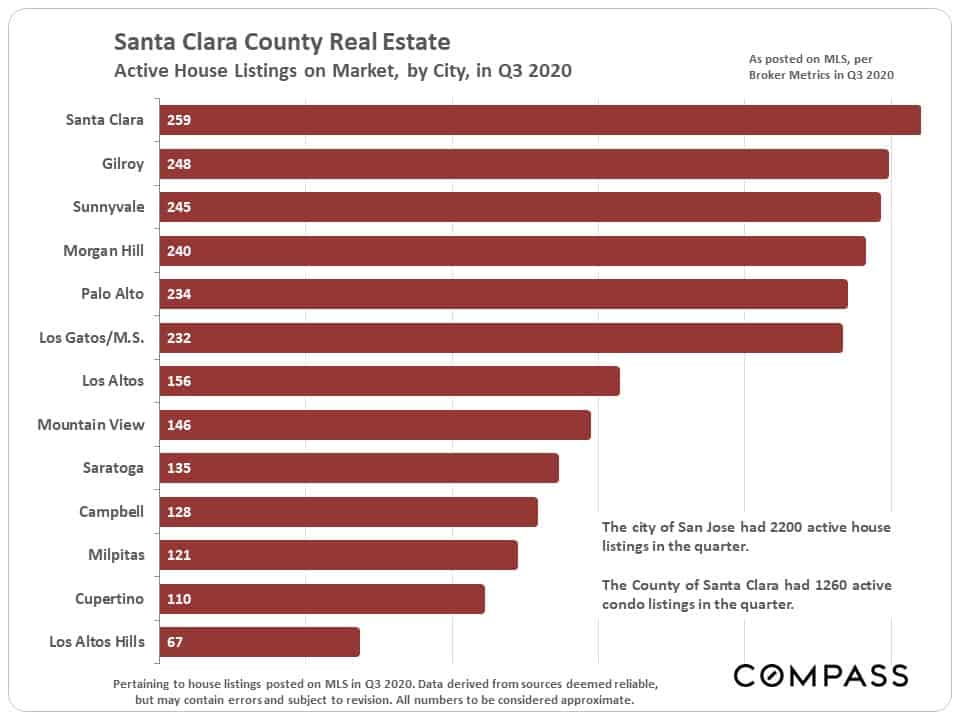
Following is a series of analyses that look at city sales volumes and median sales prices, luxury home sales, listings for sale, and a few standard measurements of supply and demand. Full county condo statistics are broken out on several of the charts – condos have generally seen weaker demand than the house market.
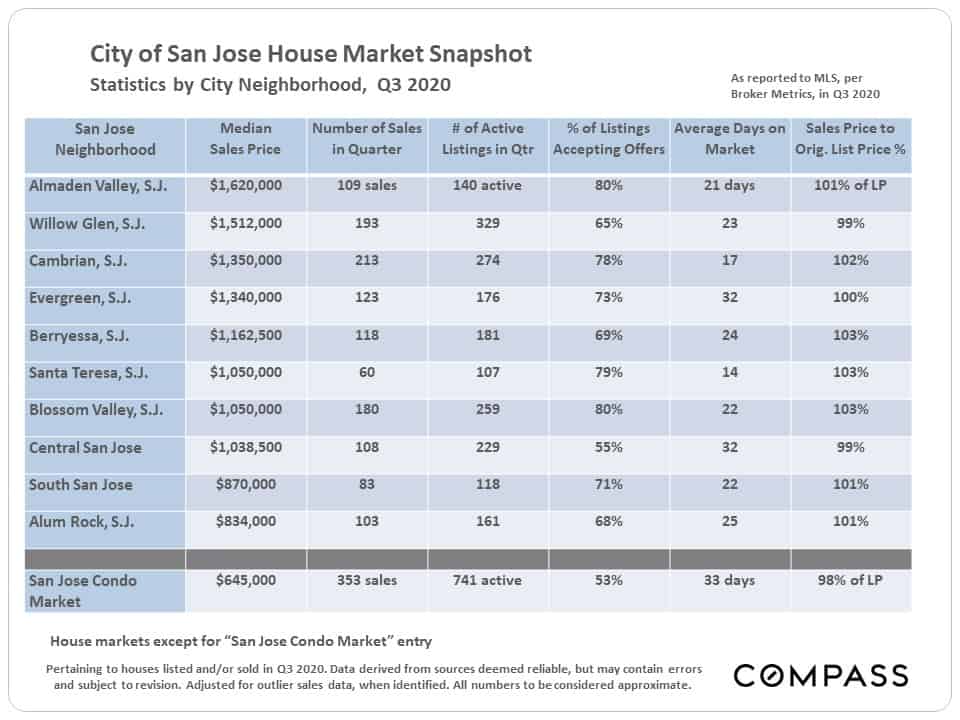
Following the city charts is a table with San Jose neighborhood statistics.
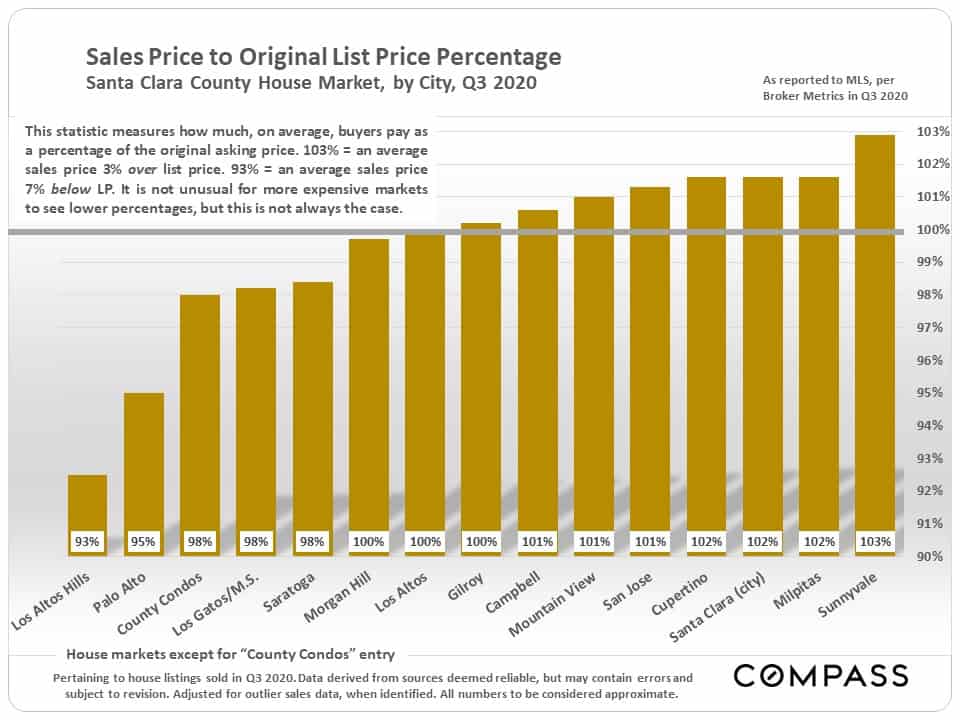
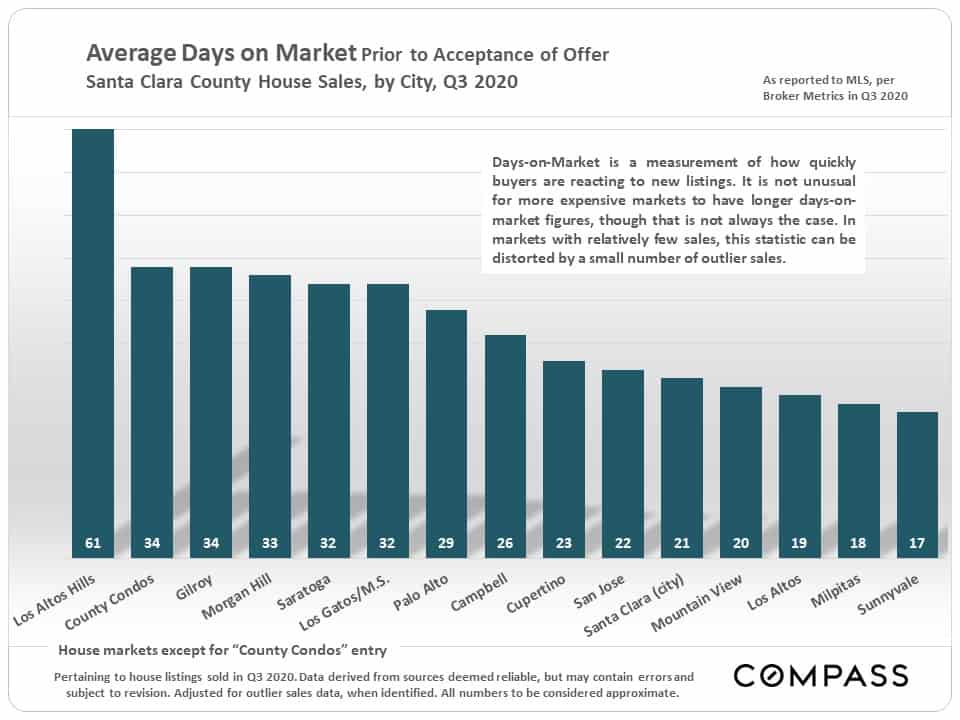
Note that very expensive homes often see softer supply and demand dynamics – the pool of buyers is much smaller, and overpricing more common for these very special properties – but this is not always the case.
Click on this link for a comparative review of Bay Area COUNTY Markets.
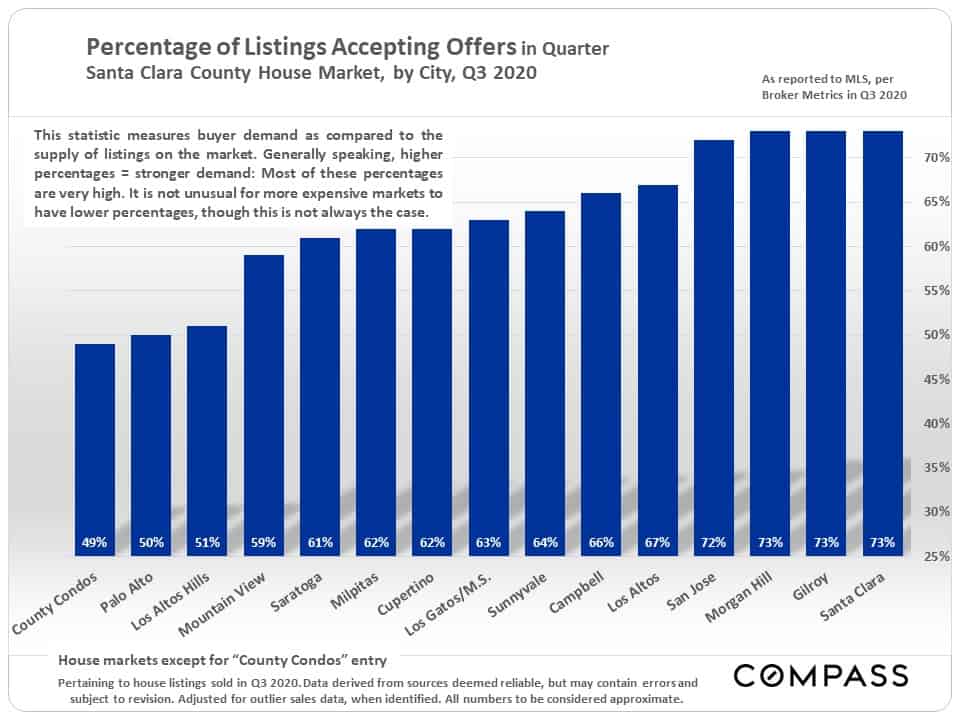
Regarding the next chart: Percentages of 50% or more would typically be considered to reflect a high-demand market. Over 60% signifies very high demand, or as it climbs, extremely high demand.
City of San Jose Neighborhood Statistics