Santa Clara County August Real Estate Market Report 2020
Santa Clara County Real Estate Market Report
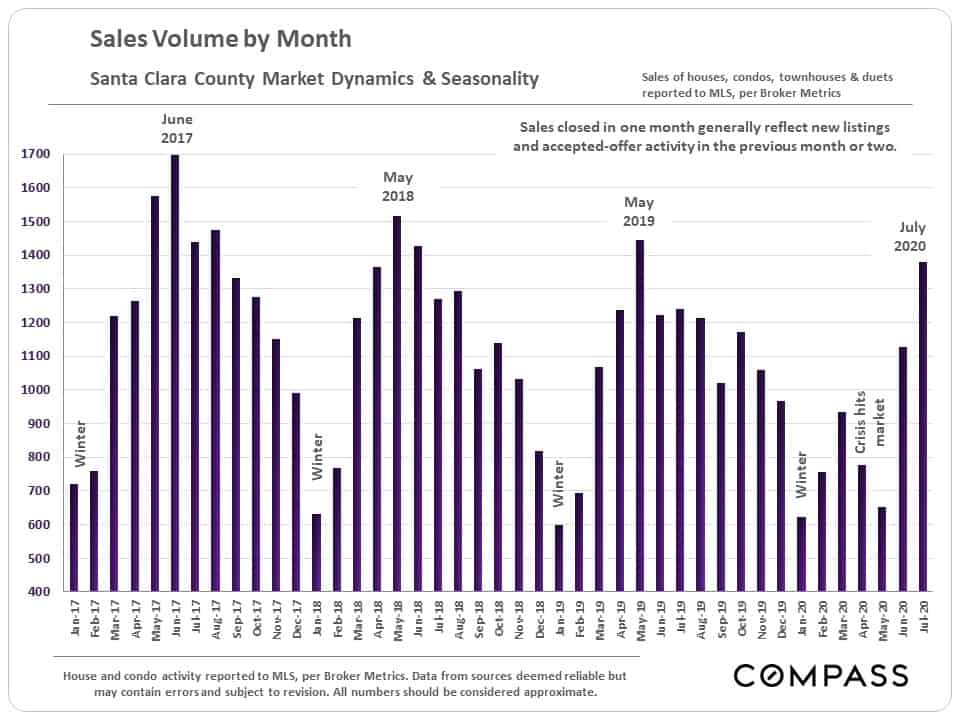
The Santa Clara County market is currently characterized by strong demand and low supply. Higher-price home sales, in particular, have spiked up. The condo market is weaker than the house market.
August 2020
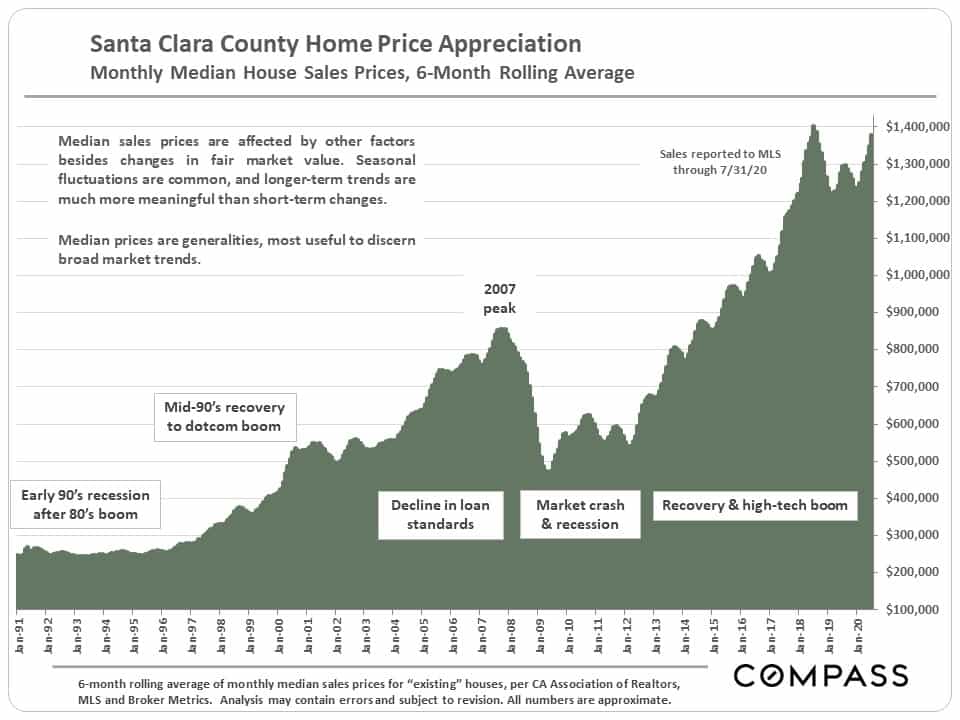
Median House Sales Price – Long-Term Trends
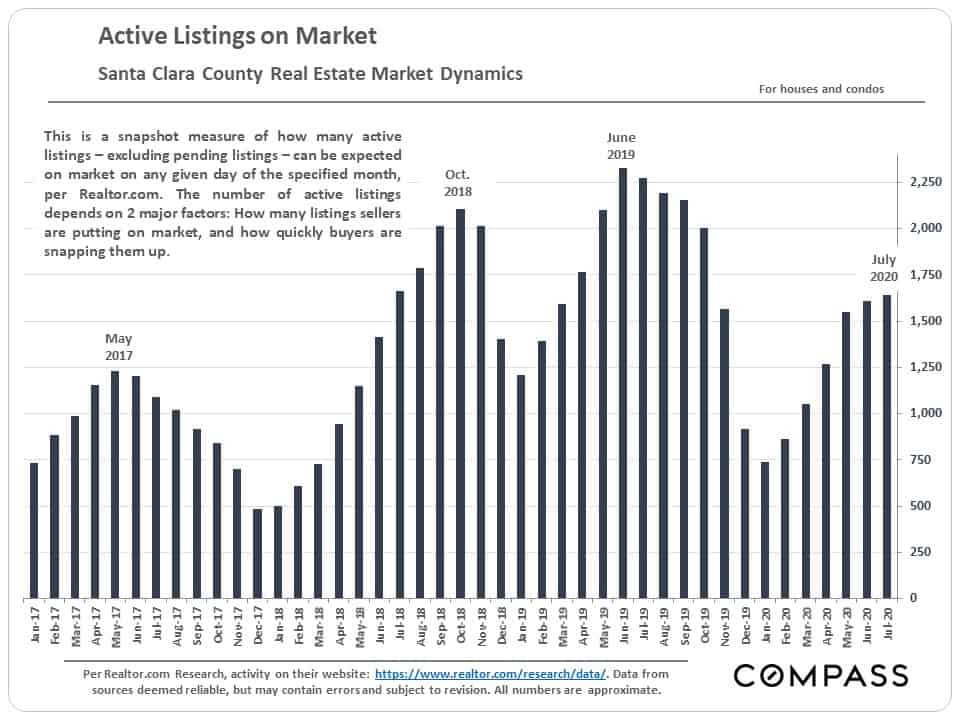
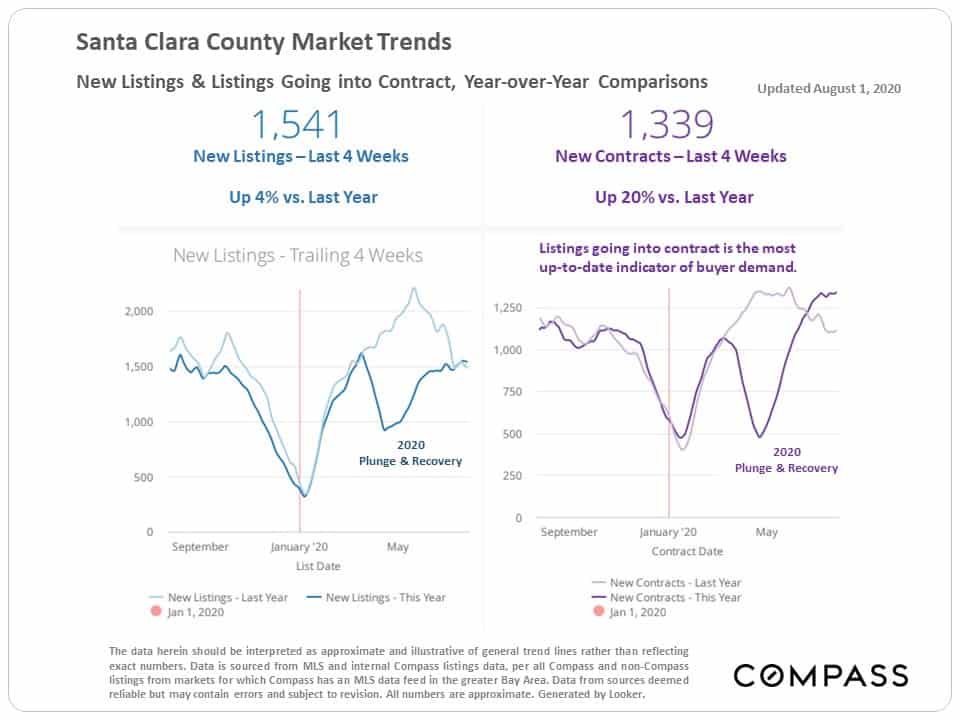
Supply & Demand
The number of active listings remains low.
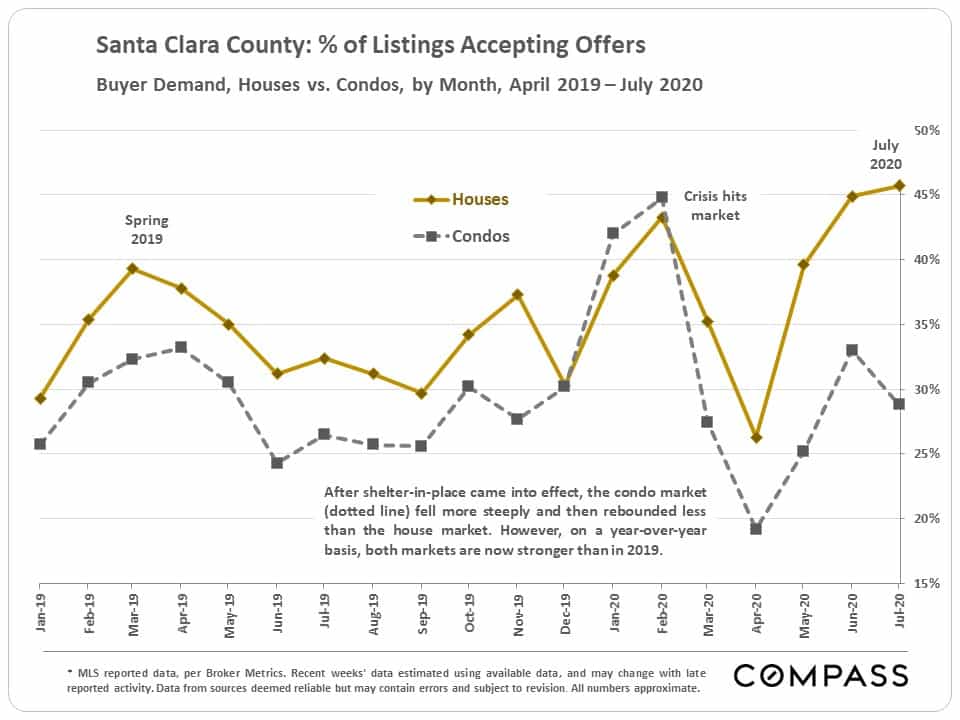
House vs. Condo Markets
As is not uncommon in other Bay Area Counties, the condo market is substantially softer.
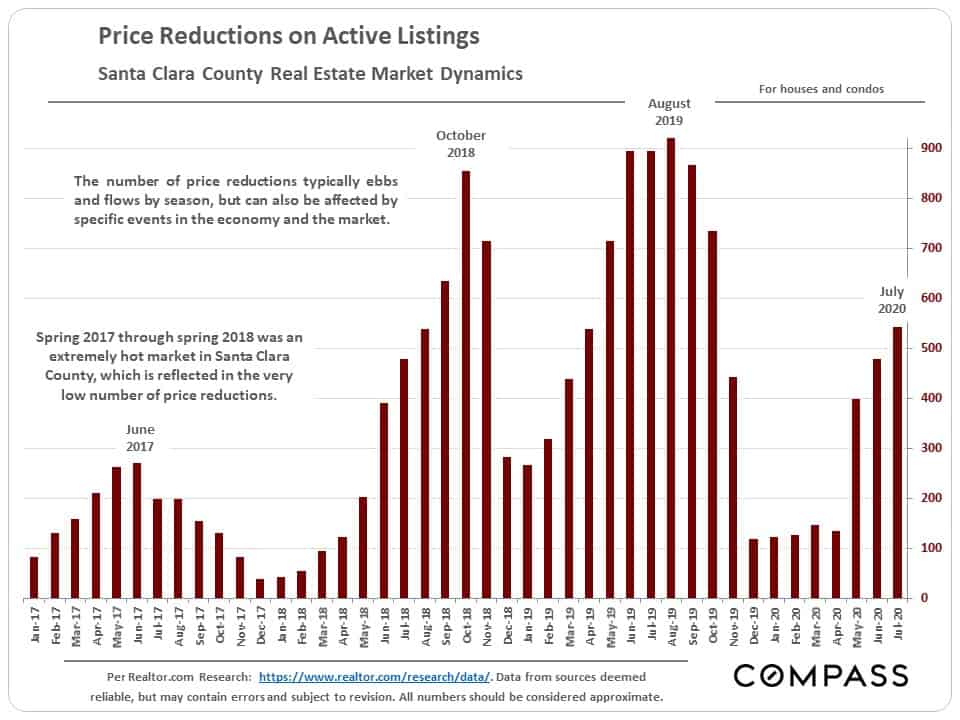
Selected Market Indicators
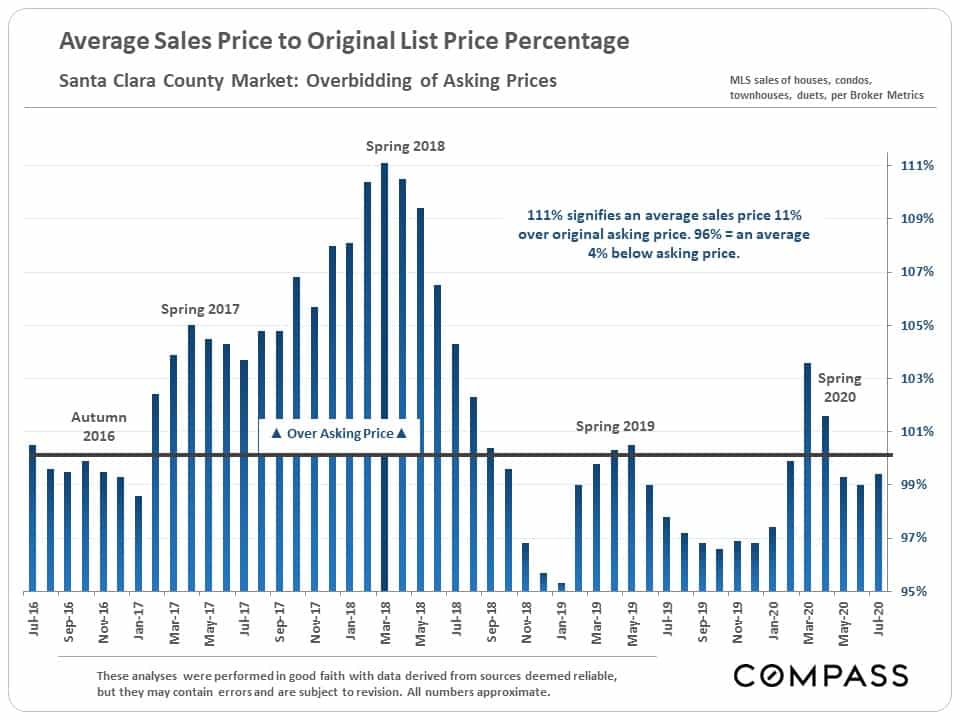
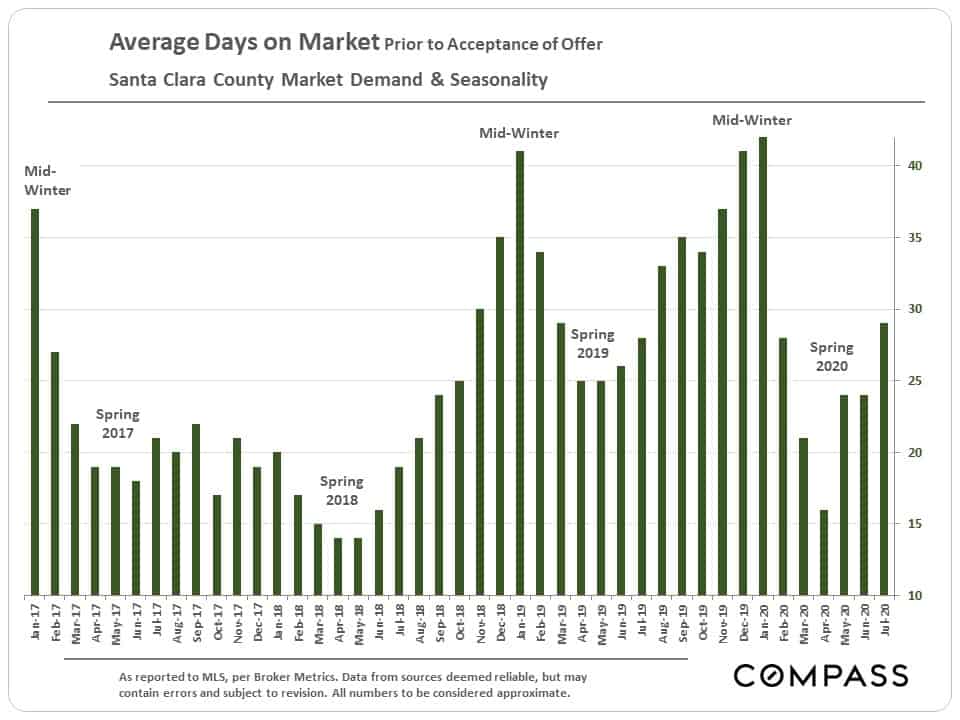
Year-over-year, the number of price reductions remains moderately low (chart 1); the average sales-price-to-list-price percentage is down from the heights two years ago (chart 2); and average days on market, though climbing a little, also remain moderately low (chart 3).
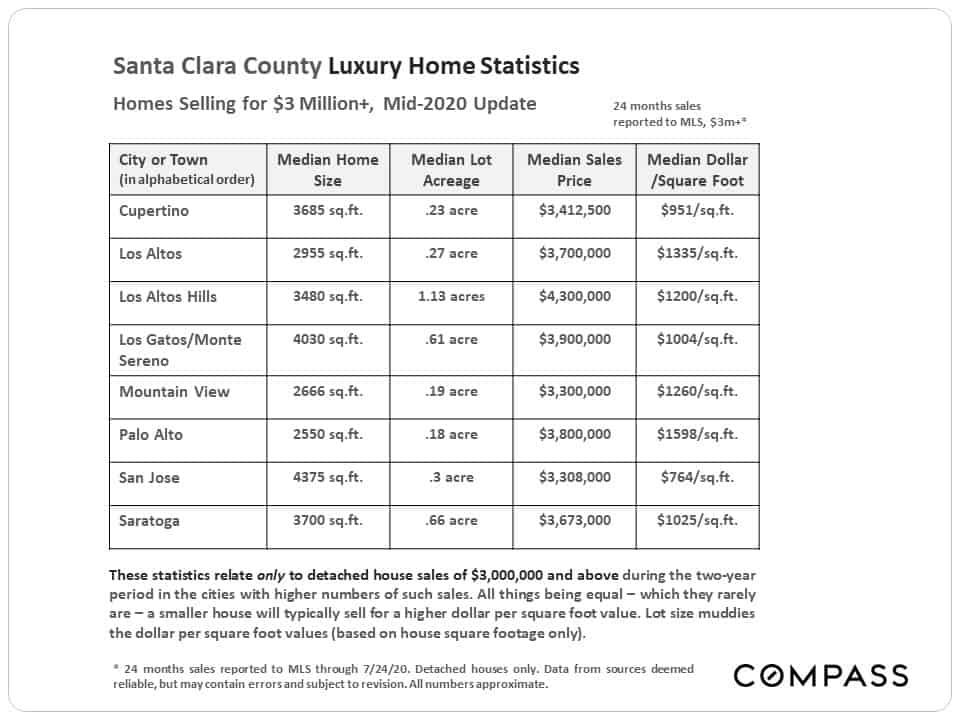
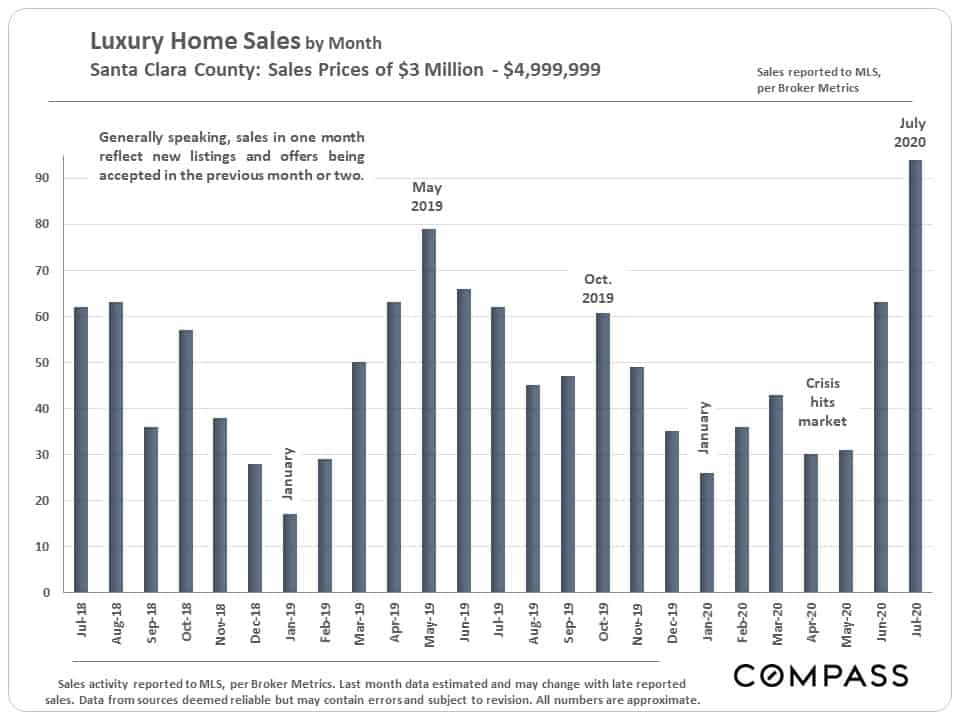
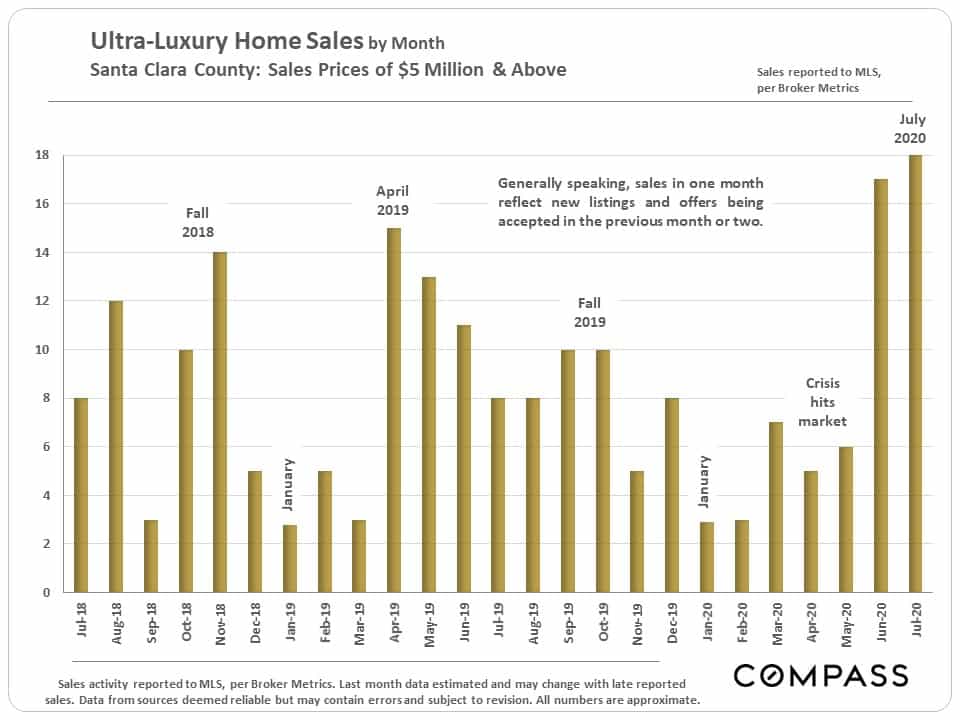
Luxury Home Sales
A comparative table on homes selling for $3,000,000+
Substantial spikes in higher-price home sales
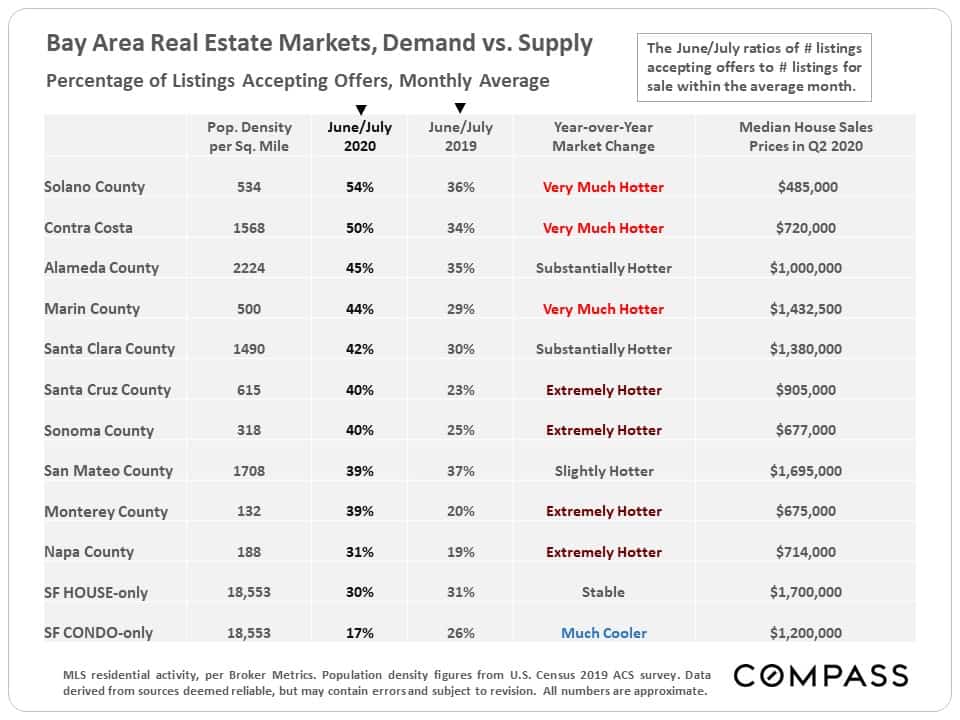
Bay Area County Markets Comparison
This table ranks each county by the percentage of active listings going into contract in June/July 2020 – a standard statistic of market heat – compares it to the same period of last year, and then rates the year-over-year change. The Santa Clara County market is substantially hotter than last year, but some other Bay Area counties – especially outlying, more rural counties – are seeing huge year-over-year increases in demand.