San Mateo County October Real Estate Market Report 2020

San Mateo Real Estate
7 Months after the Pandemic Hit
October 2020 Report
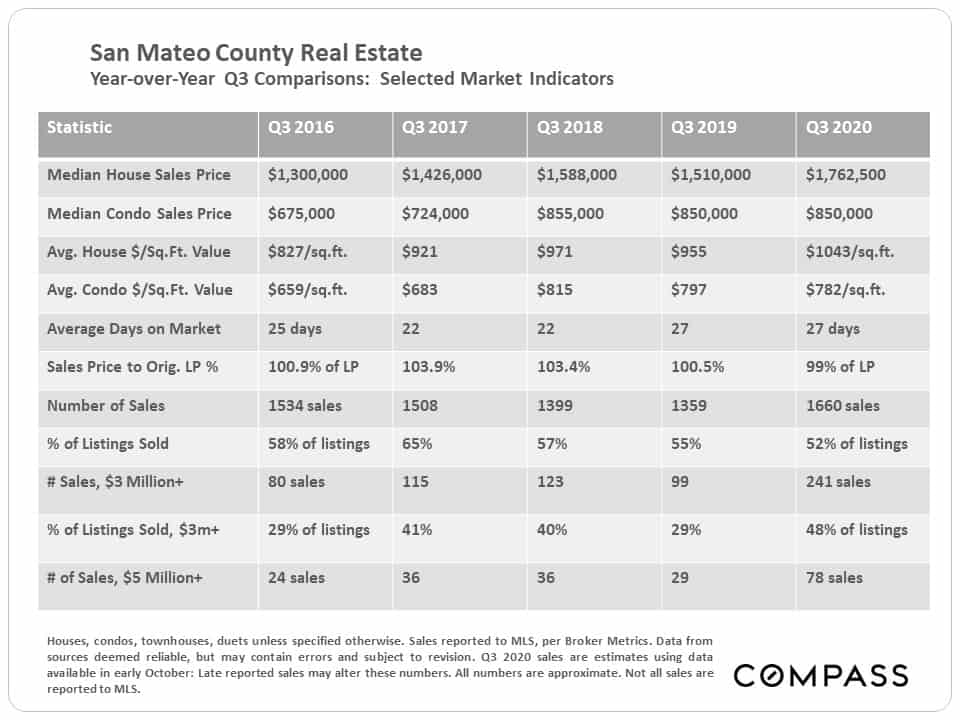
The table below compares Q3 statistics across 5 years. Three charts further down we will discuss one of the dynamics behind the huge year-over-year increase in median house sales price.
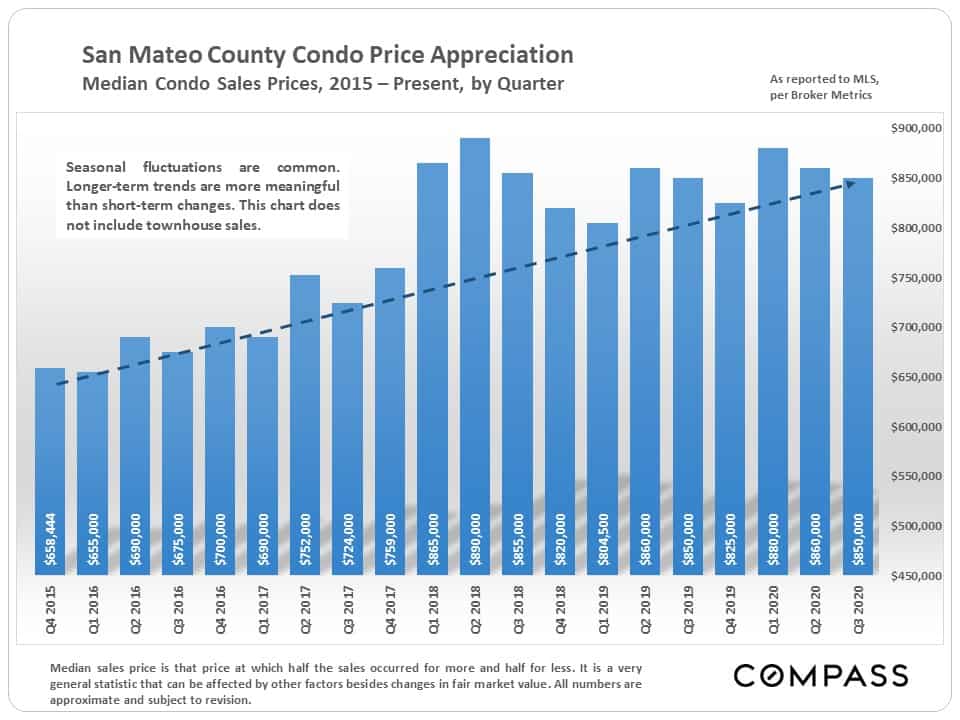
Median House & Condo Sales Prices by Quarter
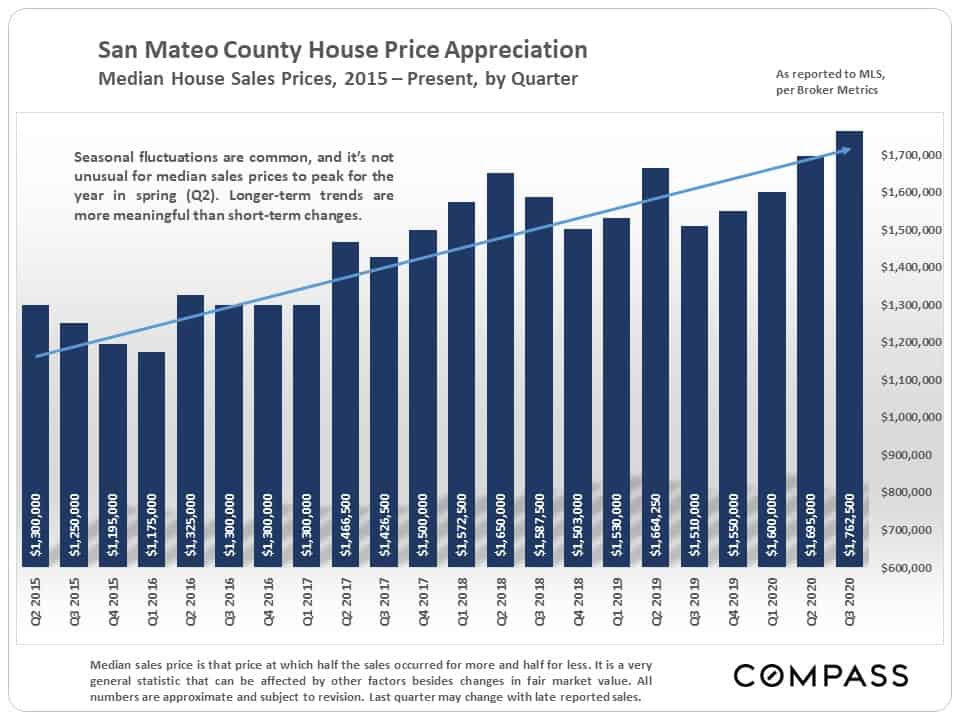
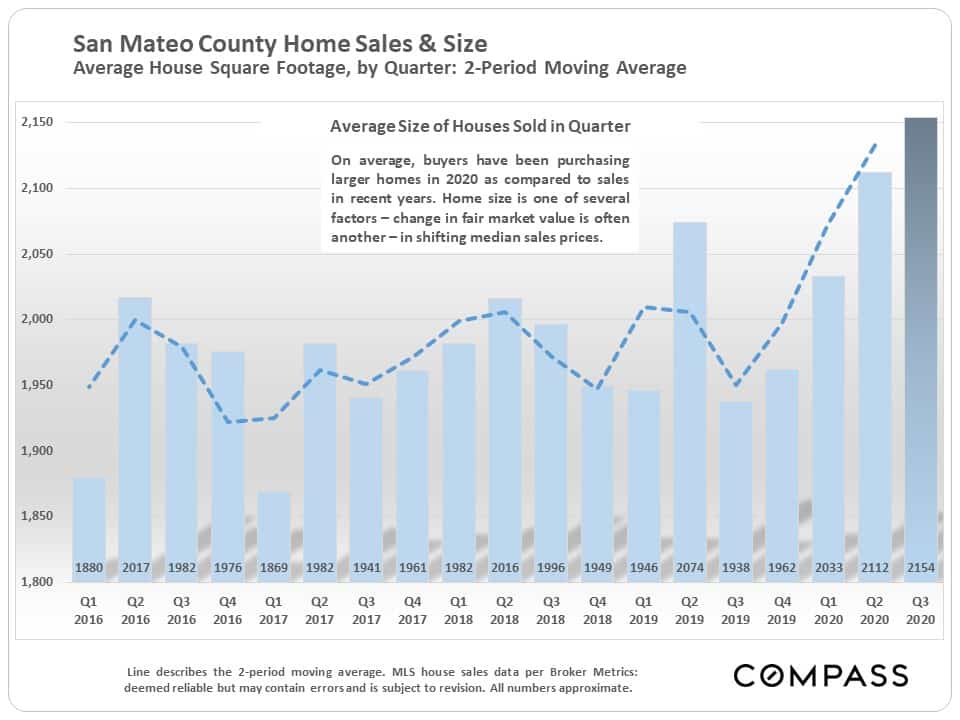
Median sales prices can rise because of increases in fair market value – i.e. buyers are paying more money for the same home (supply and demand) – and/or because buyers are purchasing larger, more expensive houses. Both dynamics are currently at play, but it is certain that affluent and very affluent buyers have made up a dramatically increasing percentage of the total market throughout the Bay Area. In San Mateo County, the average size of houses sold in Q3 jumped a whopping 11% year over year, which explains some of the enormous increase in median house sales price.
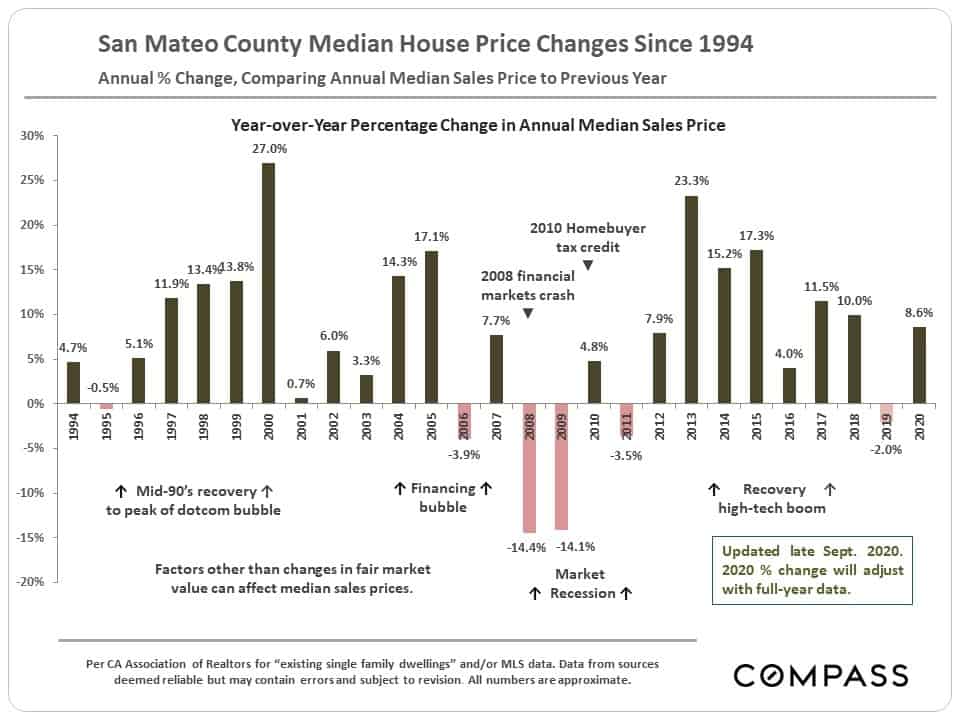
The next chart measures the annual percentage ups and downs in median house sales price since 1994. The 2020 YTD percentage will almost certainly change, one way or another, by the time full-year sales data is in.
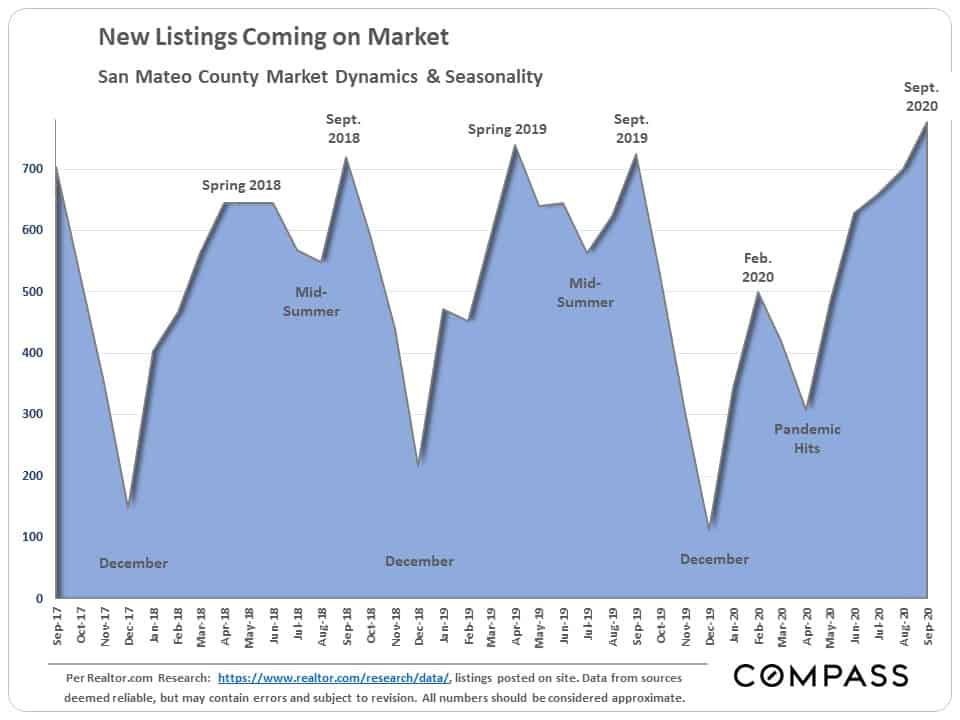
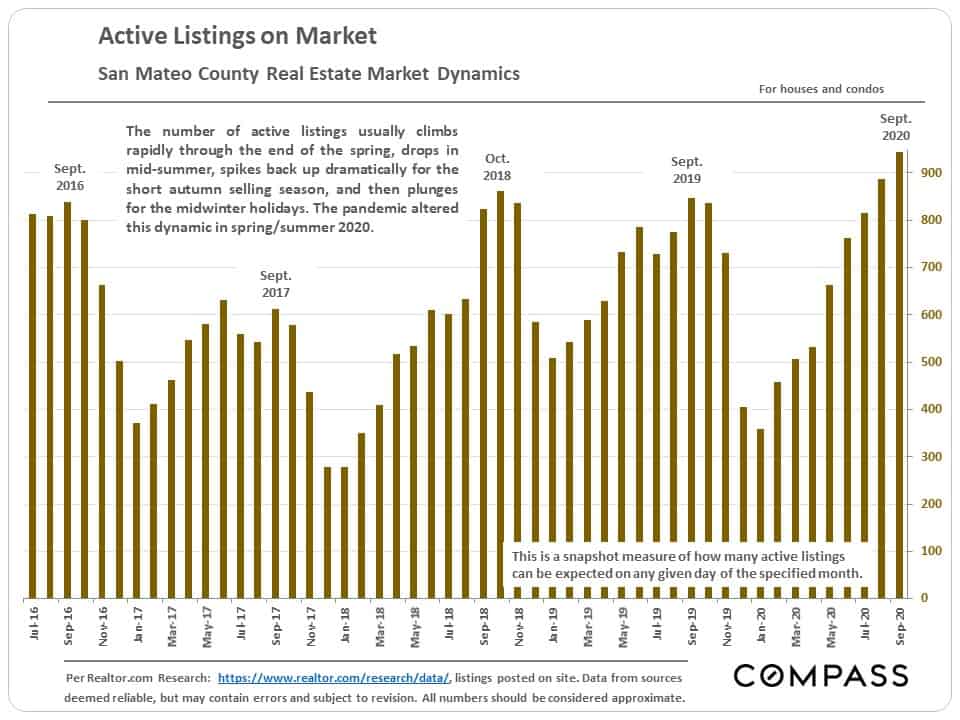
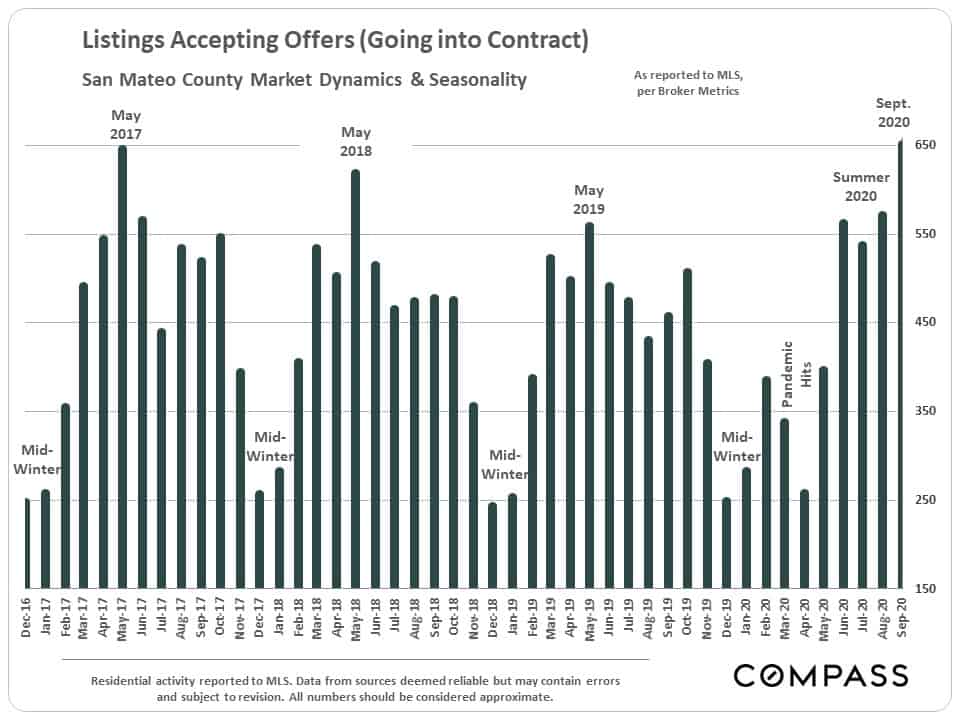
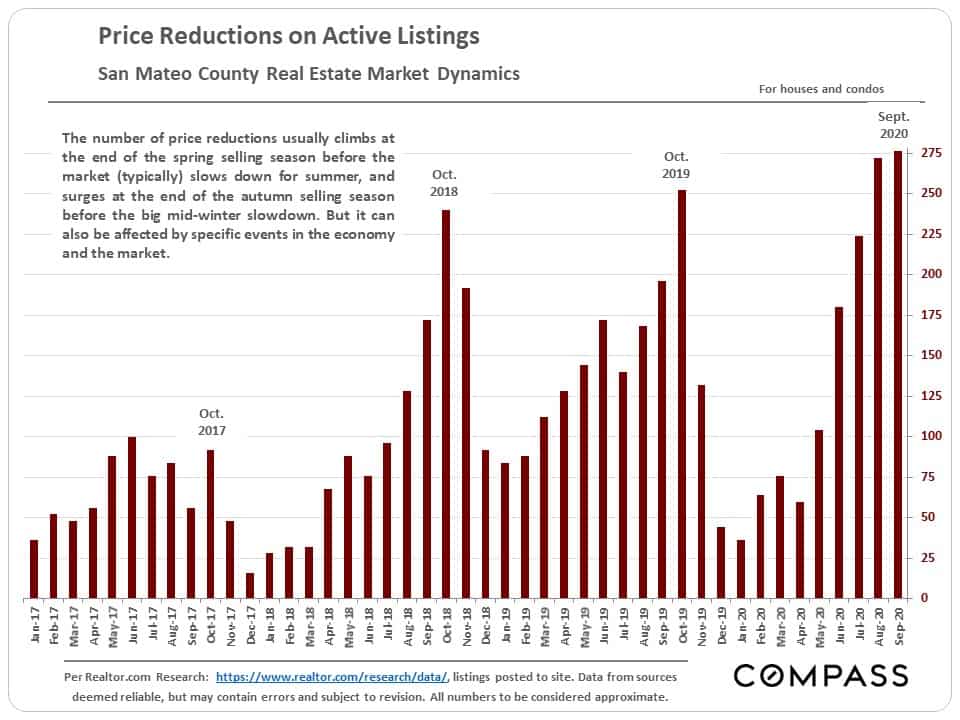
4 Supply & Demand Indicators
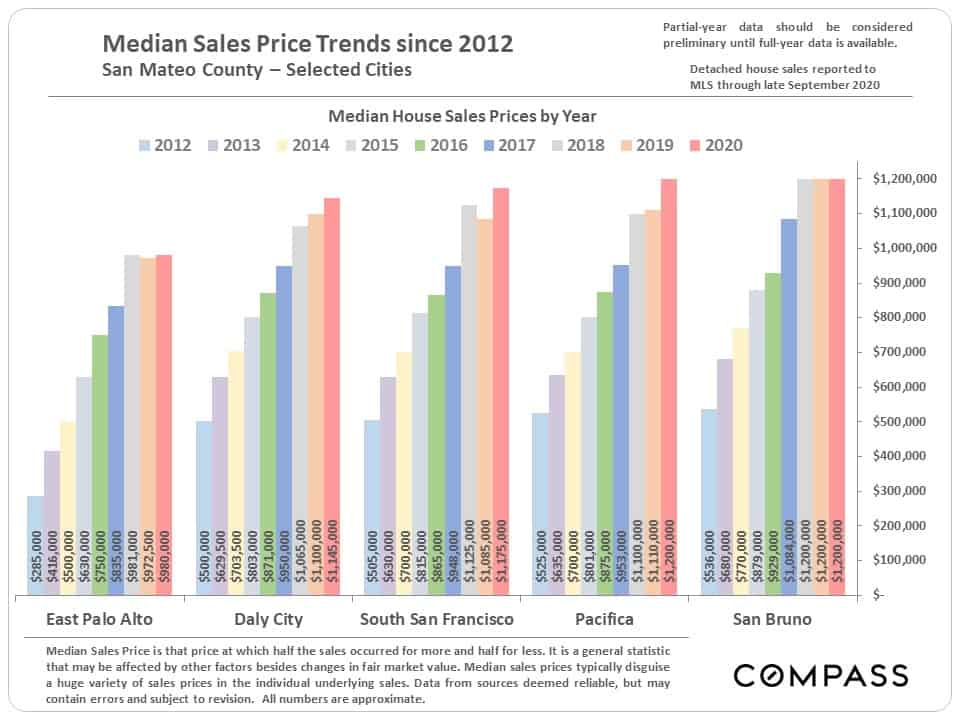
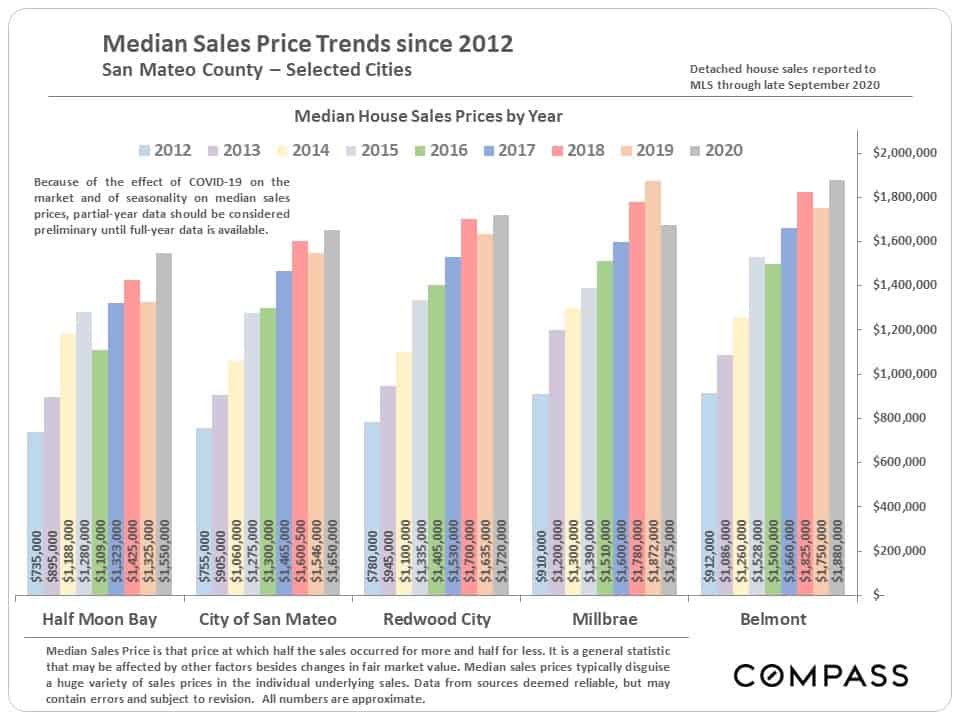
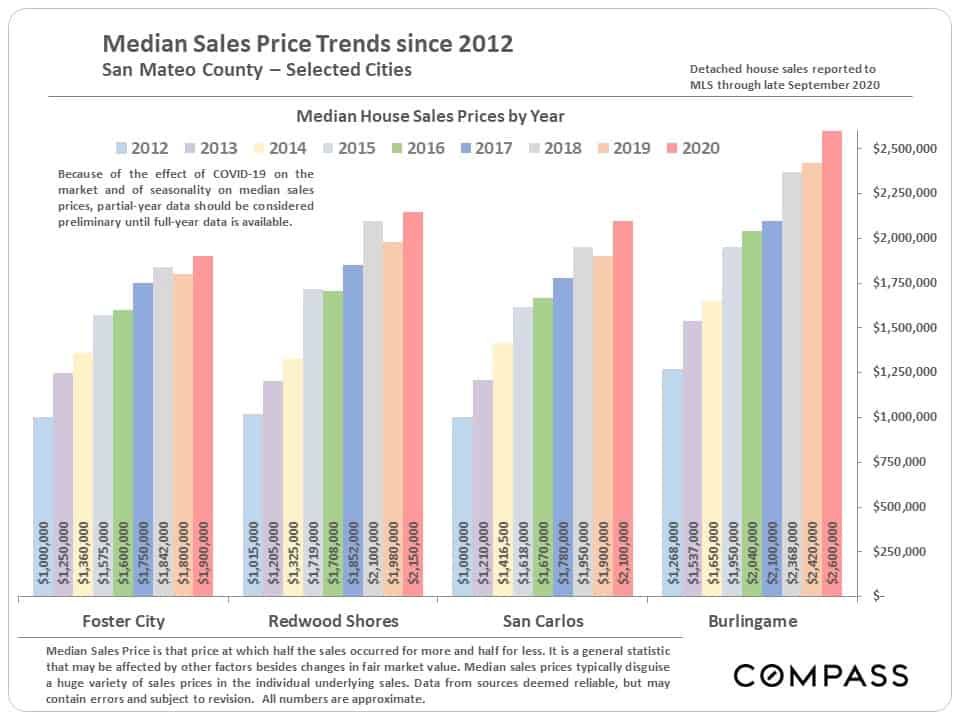
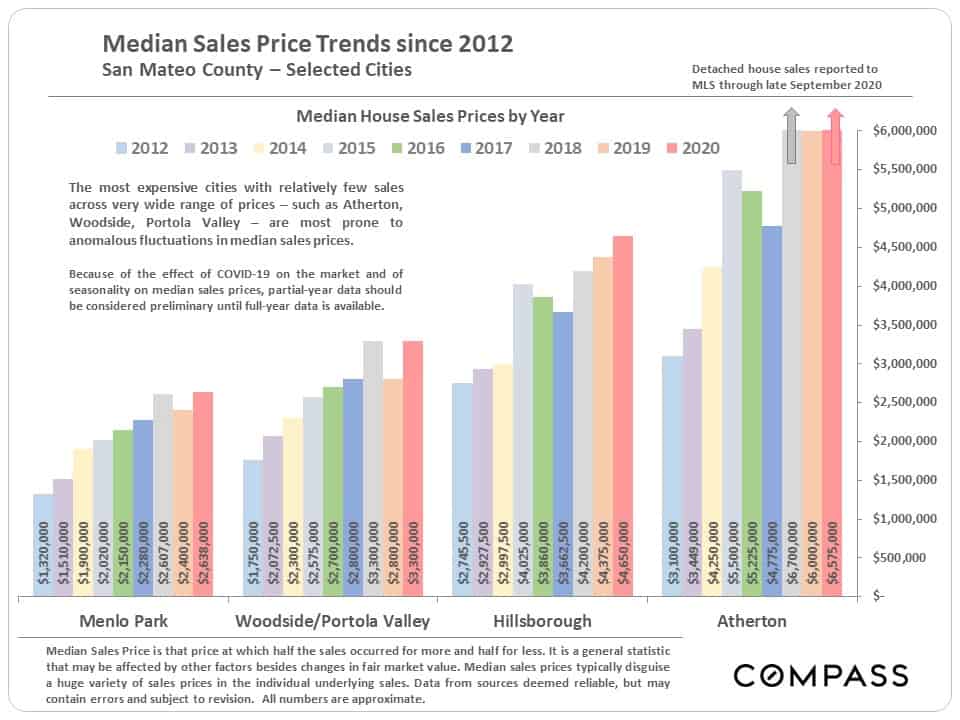
Median House Sales Price Trends in Selected Cities
In September, we also updated our semi-annual Survey of Bay Area Markets.