Marin September Real Estate Market Report 2020

Marin County Real Estate
September 2020 Report
In the context of the horrible fires we’ve seen in recent weeks – with many of our Bay Area communities and neighbors so terribly affected – a real estate report seems trivial. But since we have clients still trying to make buying and selling decisions, we will try to continue to deliver straightforward data on market conditions.
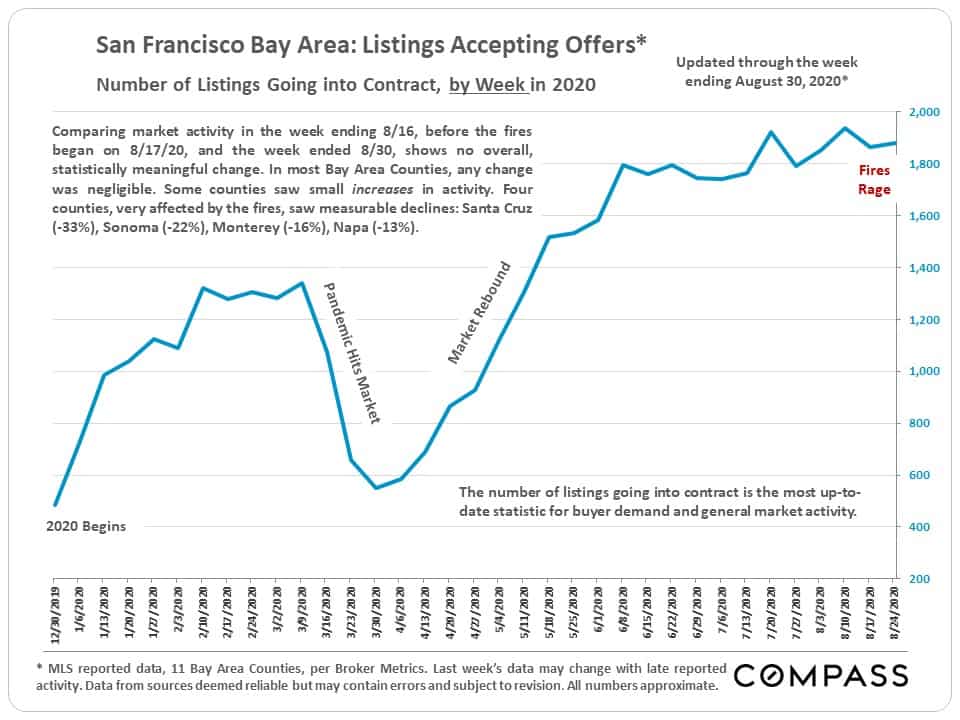
Surprisingly, the fires did not significantly impact the number of deals being made in most Bay Area counties during the last 2 weeks of August – the exceptions being Santa Cruz, Sonoma, Monterey and Napa Counties, which saw declines of 13% to 33%. Marin’s numbers didn’t really change at all in the second half of the month. (This chart looks at week by week activity in the Bay Area.)
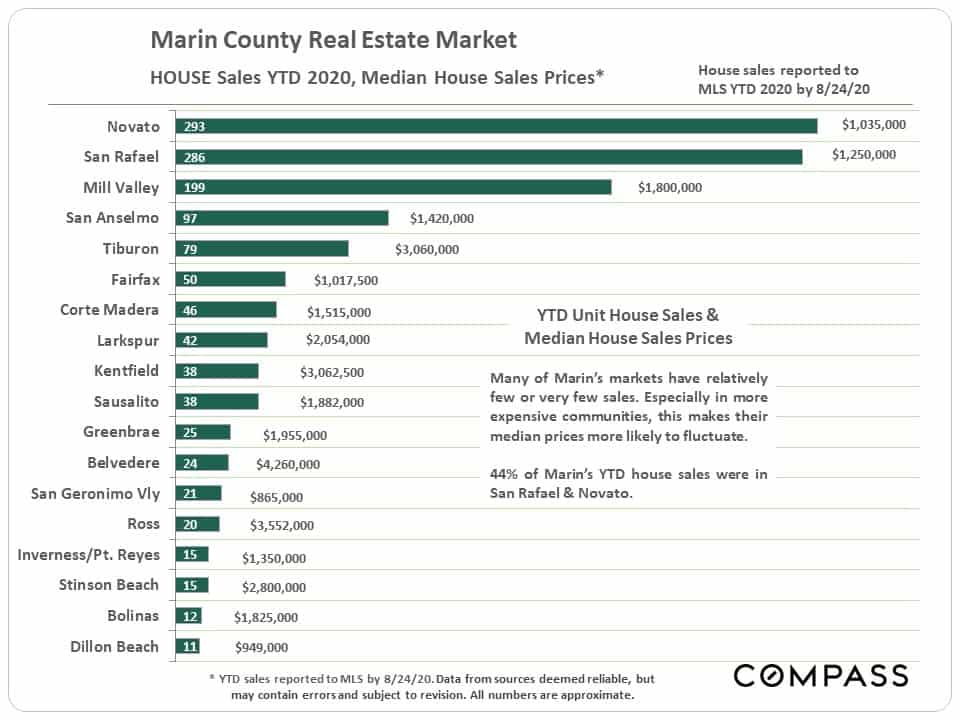
Year-to-date, house sales and median house sales prices by city: As can be seen, Novato and San Rafael dominate in terms of sales volume.
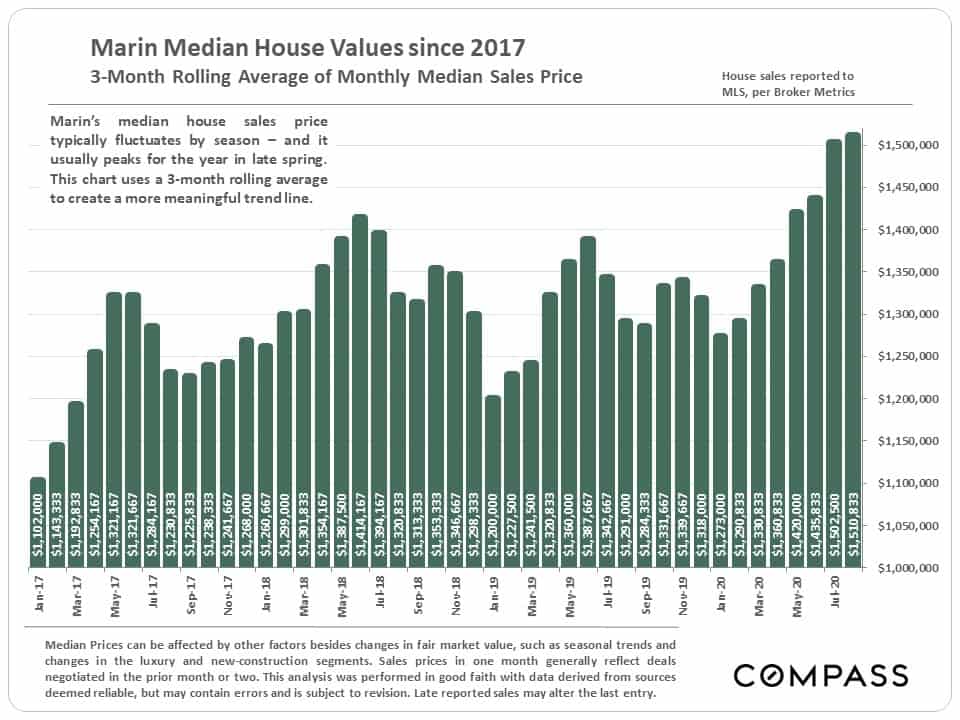
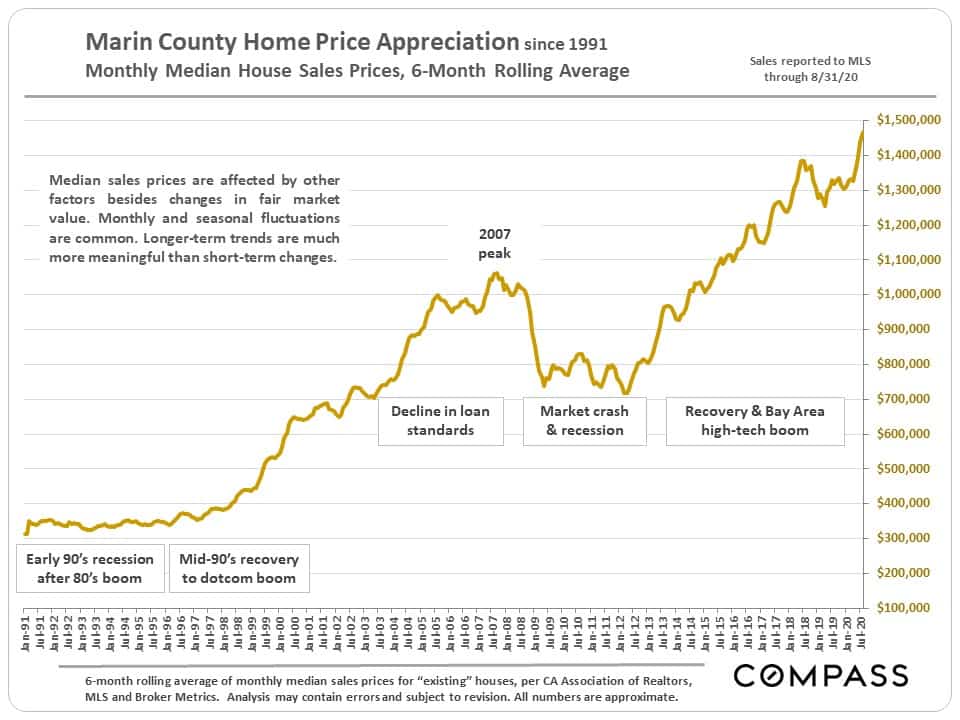
2 charts – shorter-term and longer-term – regarding the Marin median house sales price.
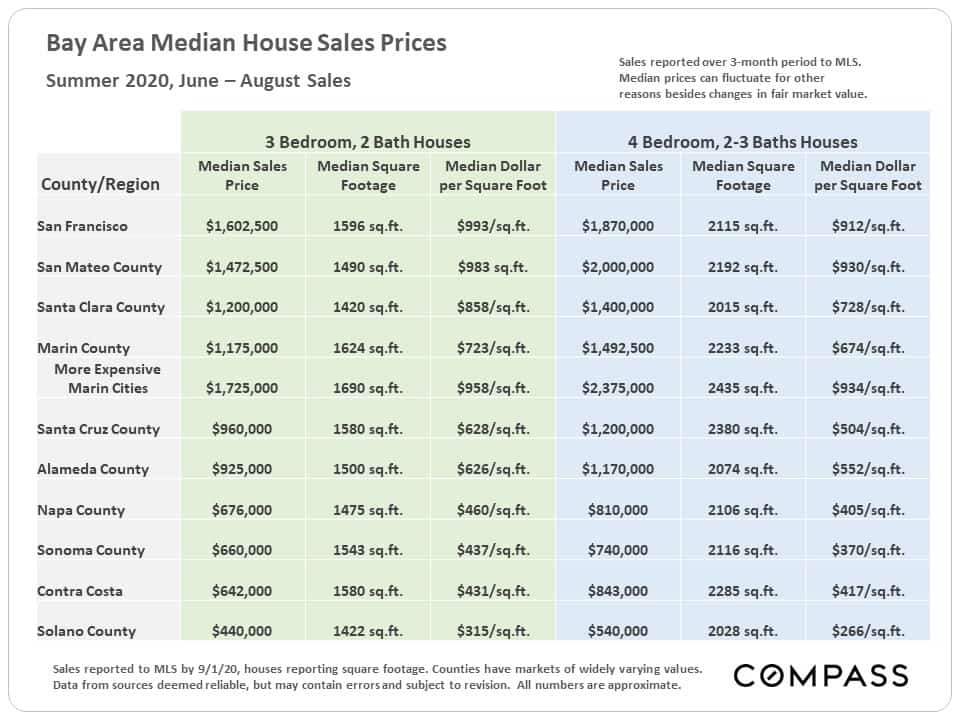
Bay Area median house sales prices, summer 2020. We’ve also broken out the more expensive county markets – generally located in central and southern Marin.
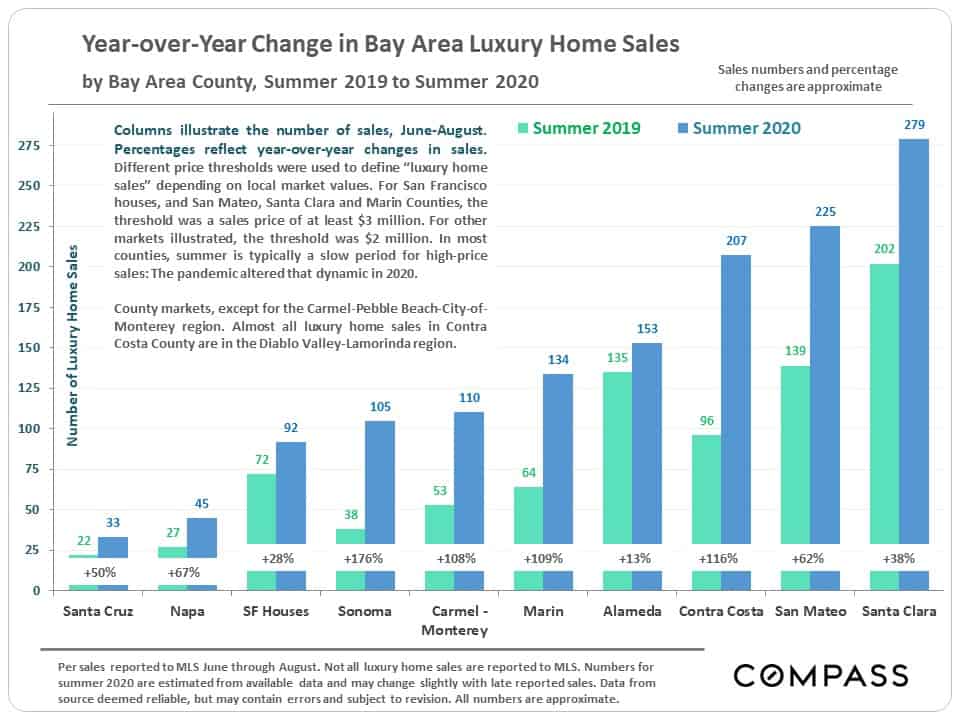
Bay Area luxury home markets: Year-over-year, summer sales volumes and percentage changes. Marin County saw its luxury sales more than double over summer 2019. As compared to its population count, Marin has a very large and dynamic luxury home segment.
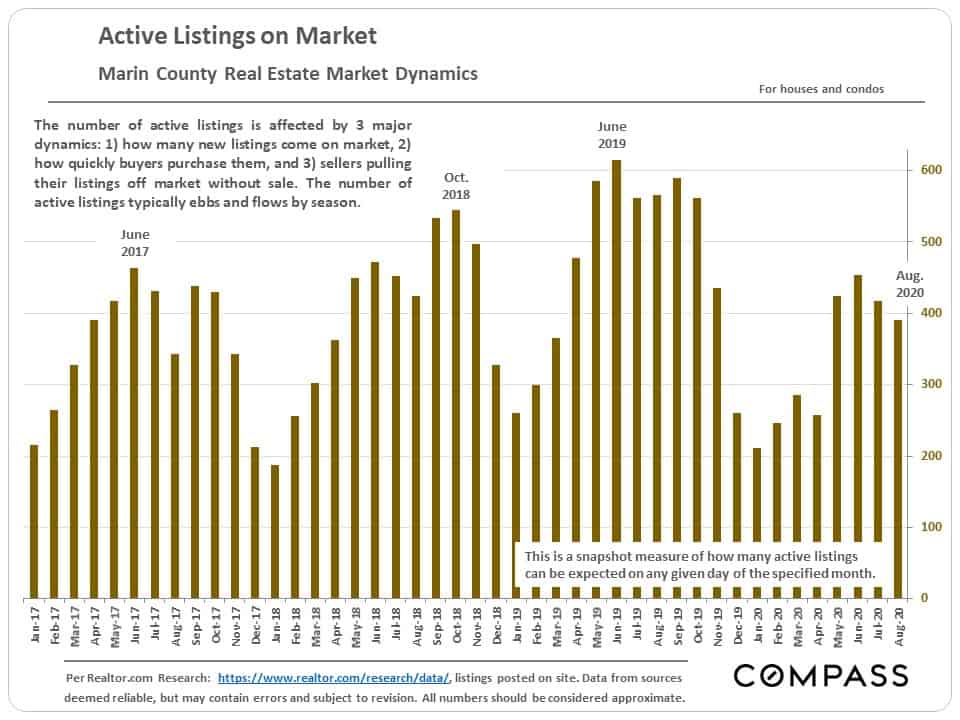
A snapshot measure of how many listings were typically active on any given day of the specified month: Marin’s inventory of listings is running quite low, putting additional pressure on the market.
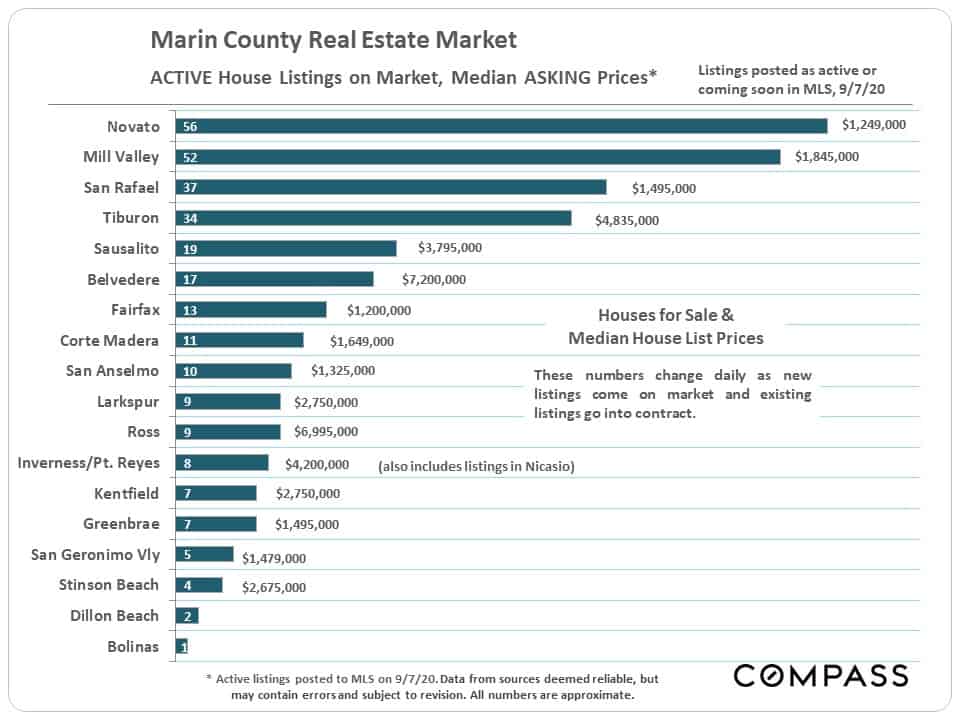
Active house listings and median house listing price by city as of September 7th. These numbers change daily, as new listings come on market and existing listings go into contract.
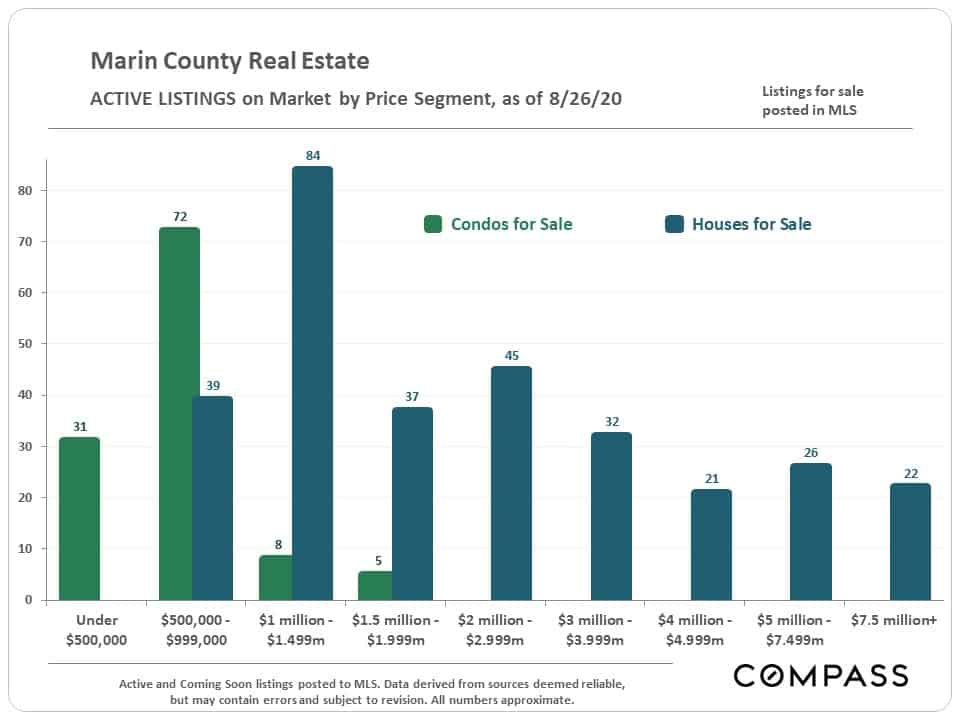
Active listings on the market in late August by price segment and property type. These numbers change daily.
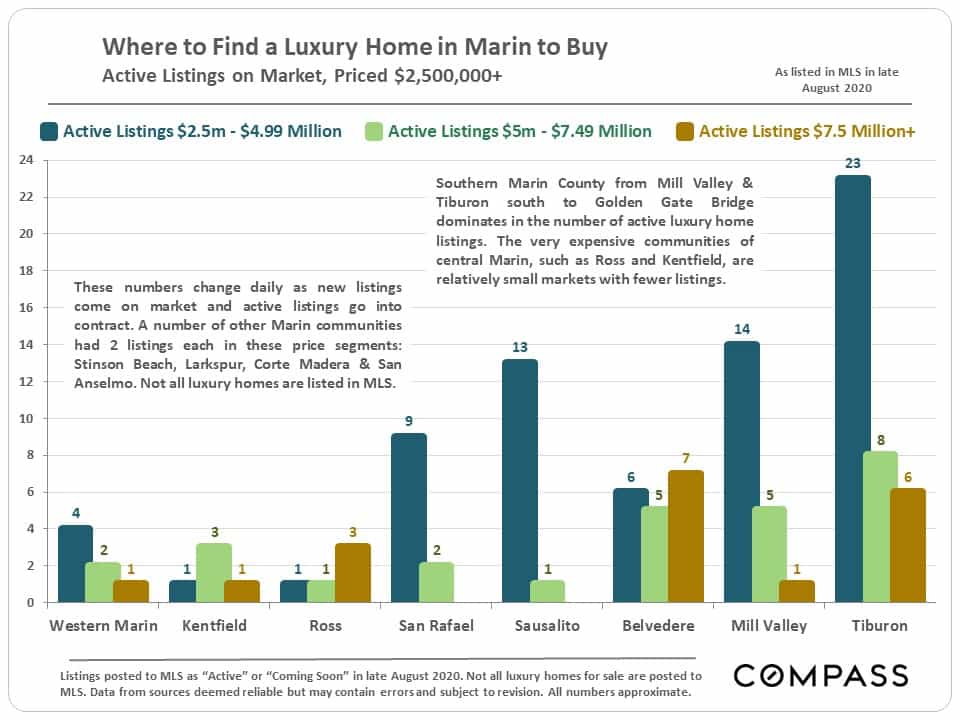
Active luxury home listing on market in late August by city. These numbers change daily.
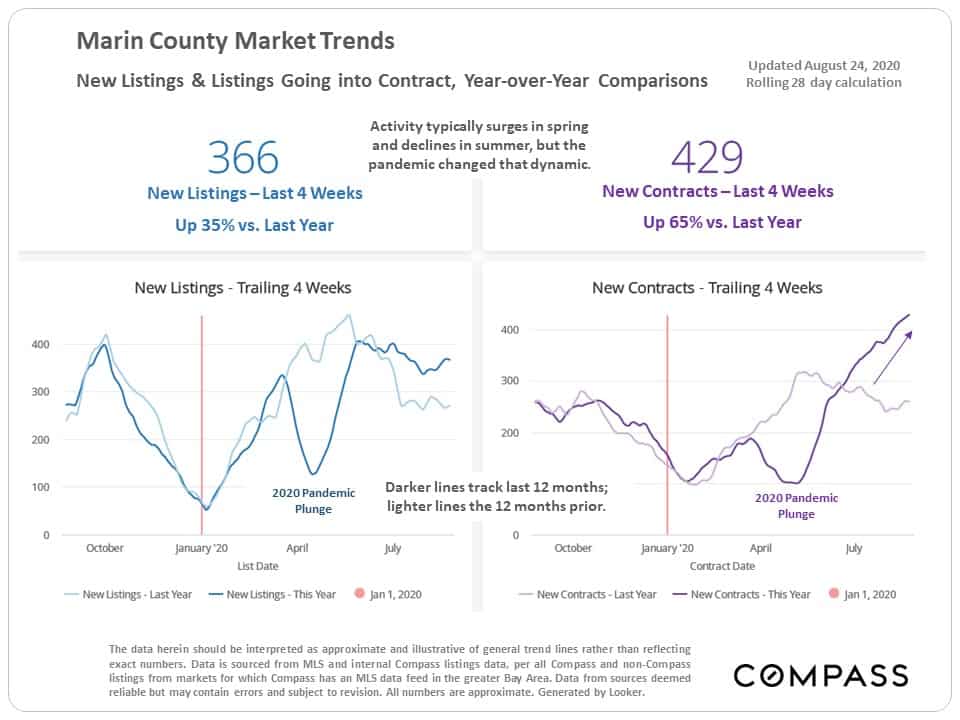
Year-over-year market indicators: New listings are up 35% vs. the number of listings going into contract up 65%. Buyers are snapping up listings faster than sellers are putting their homes on the market.
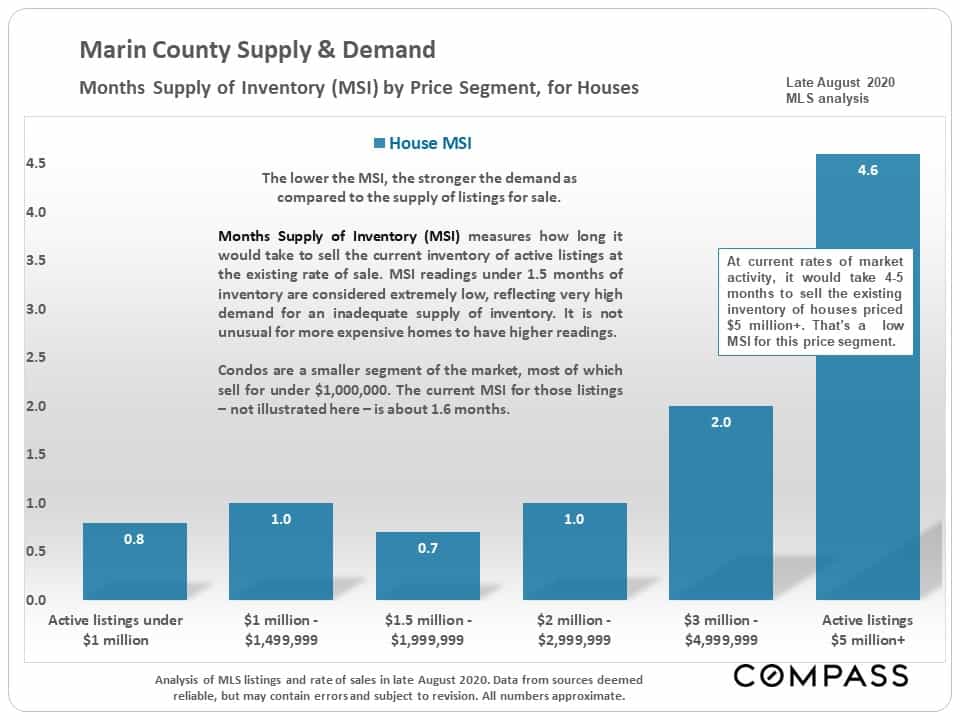
The lower the Months Supply of Inventory (MSI), the stronger the demand as compared to the supply of listings. Most of the Marin market remains very deep in “seller’s market” territory by this measure.
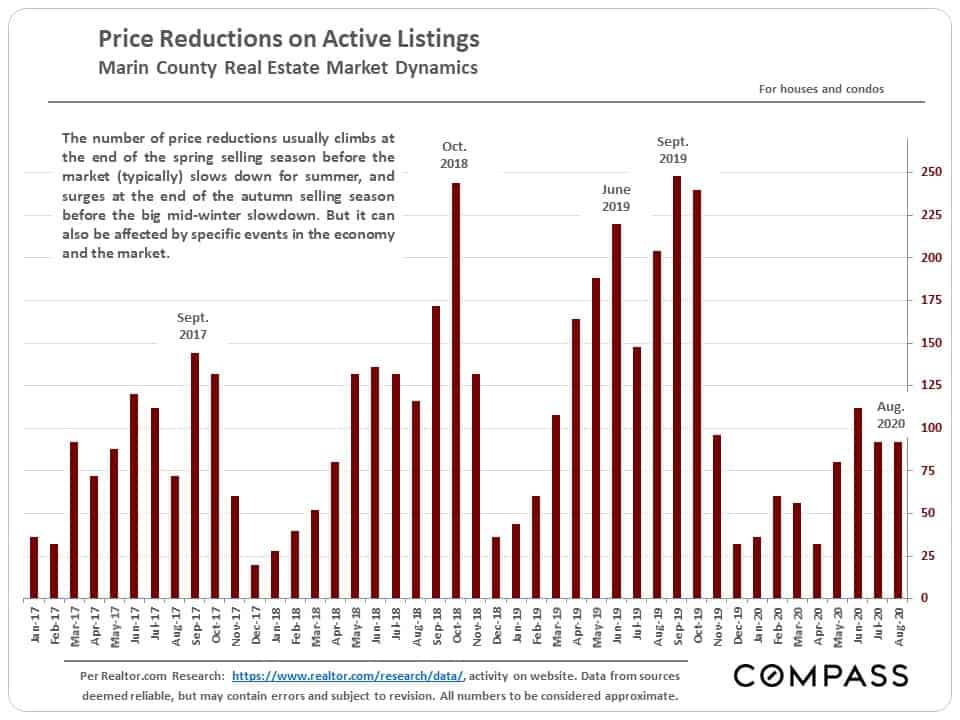
Another indicator of high demand: Very few price reductions.