Marin August Real Estate Market Report 2020

Marin County Real Estate Report
Median house sales price hits new high; year-over-year total listing inventory down; sales activity way up; luxury home sales soar
August 2020
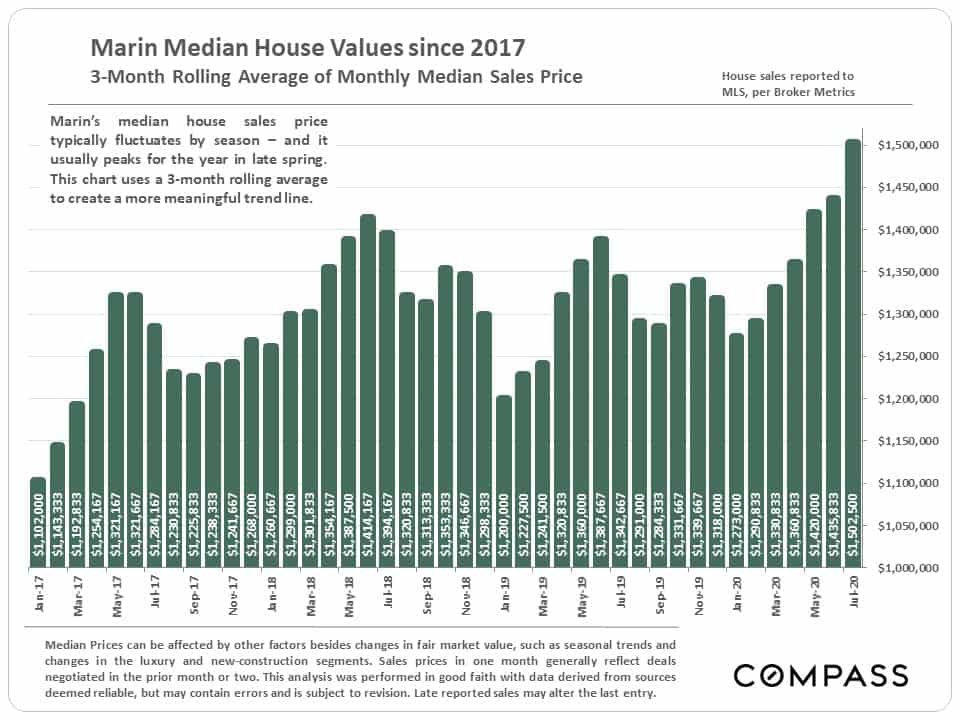
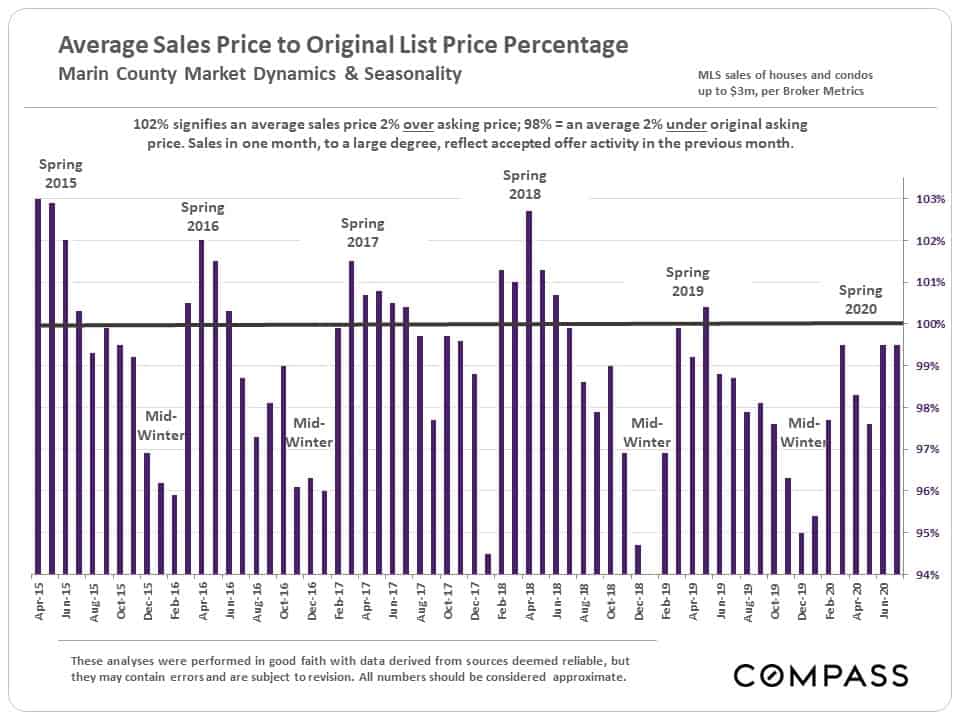
Median House Sales Price Trend
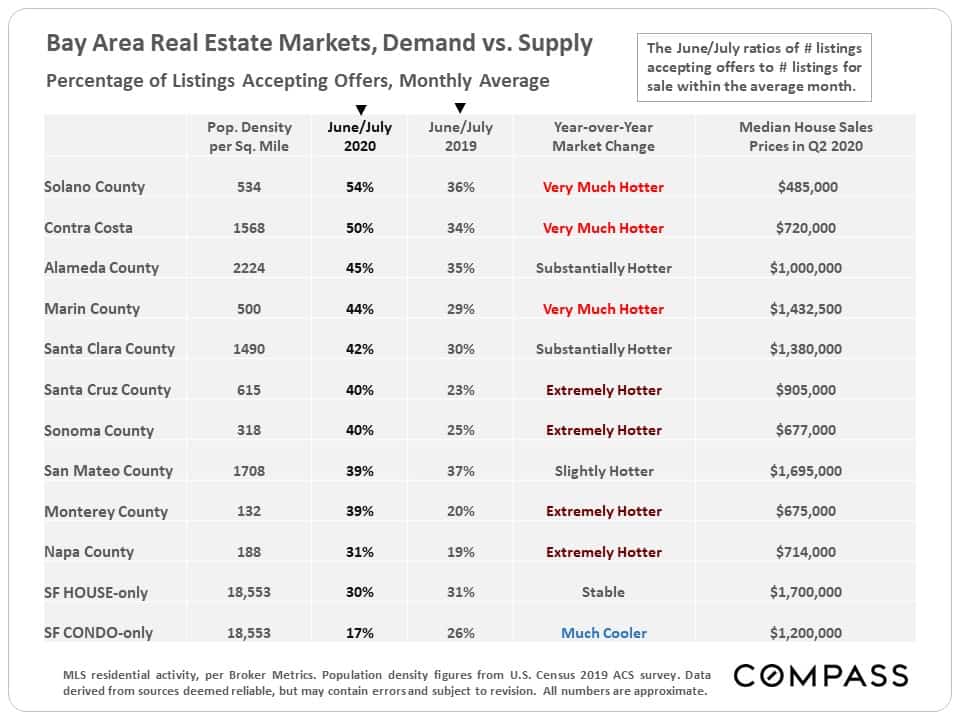
Bay Area Market Comparisons
This table ranks each county by the percentage of active listings going into contract in June/July 2020 – a standard statistic of market heat – compares it to the same period of last year, and then rates the year-over-year change.
Of the 3 most expensive counties, Marin ranks first in market heat and in year-over-year change.
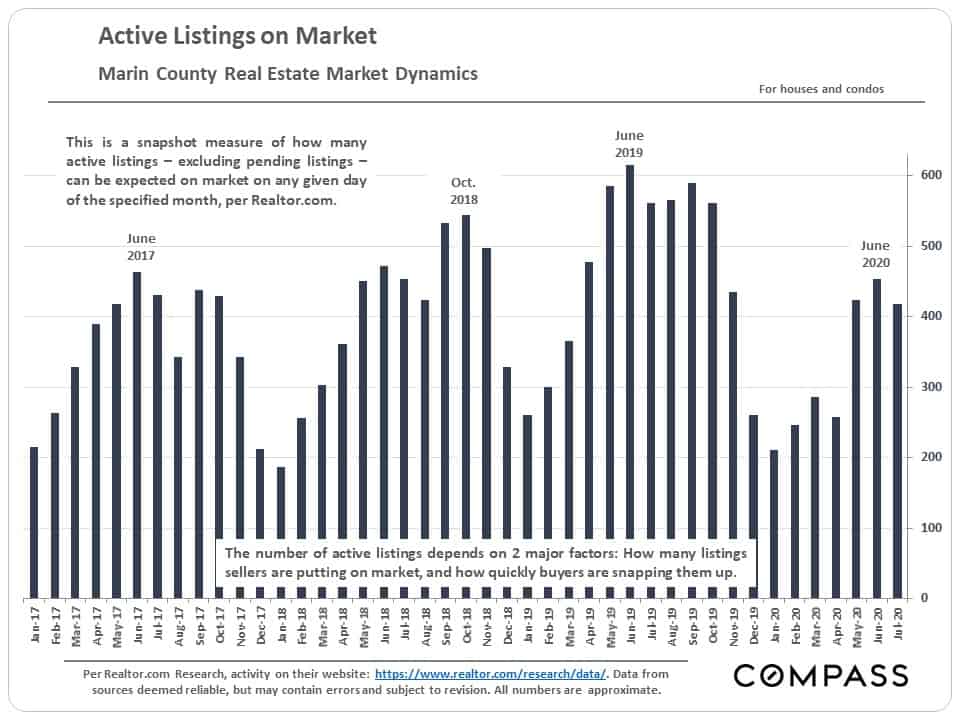
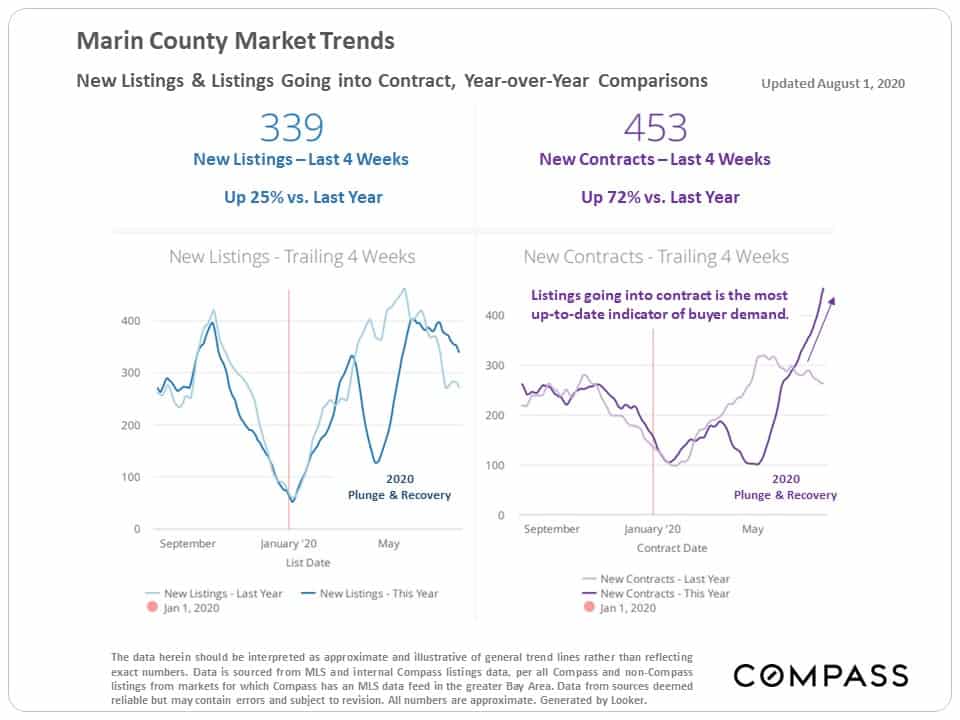
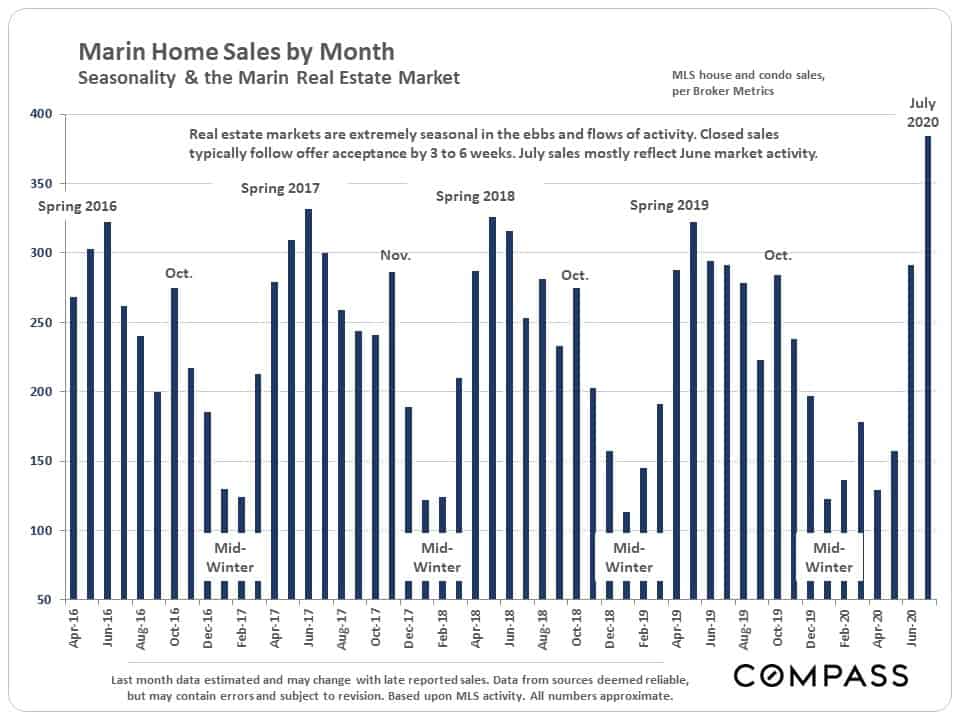
Supply & Demand
Active listings, new listings coming on market, listings going into contract and sales volume trends
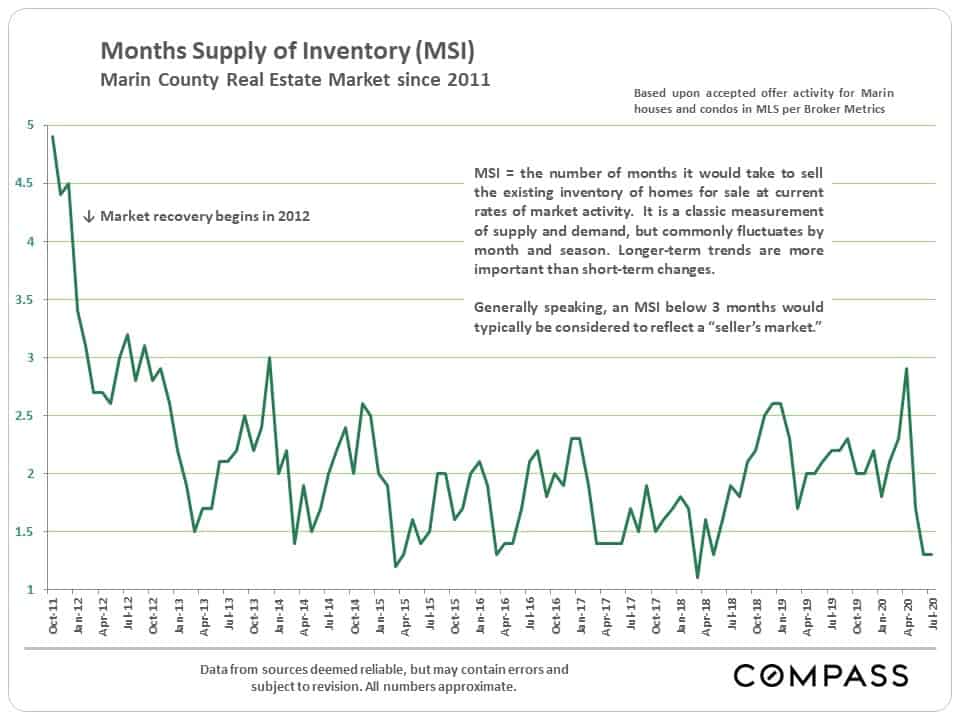
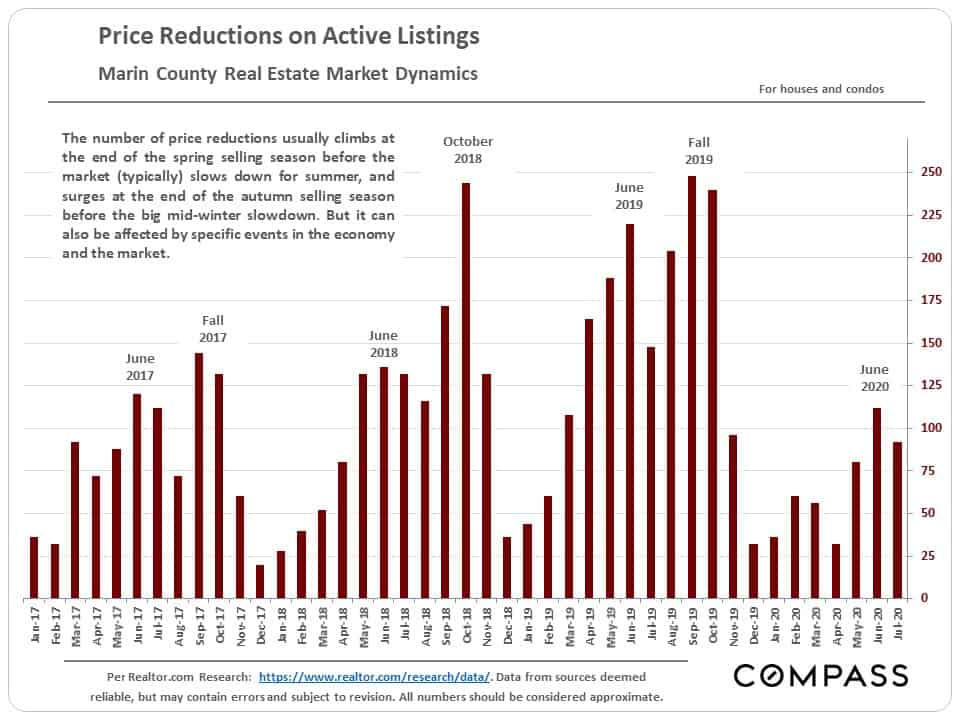
Selected Market Indicators
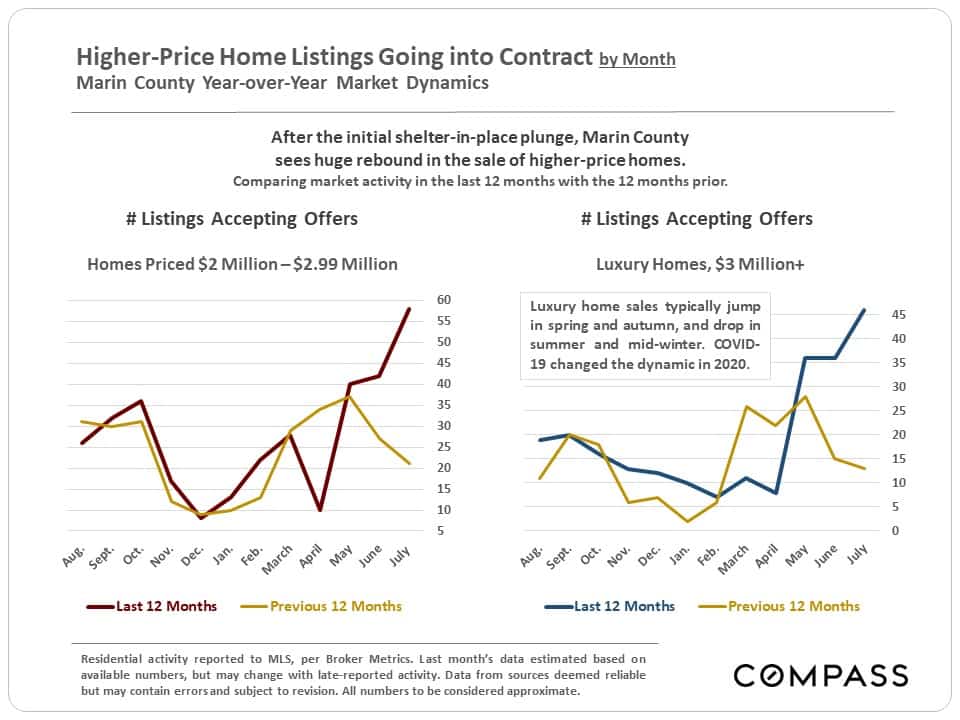
Higher-Price & Luxury Home Listings Accepting Offers
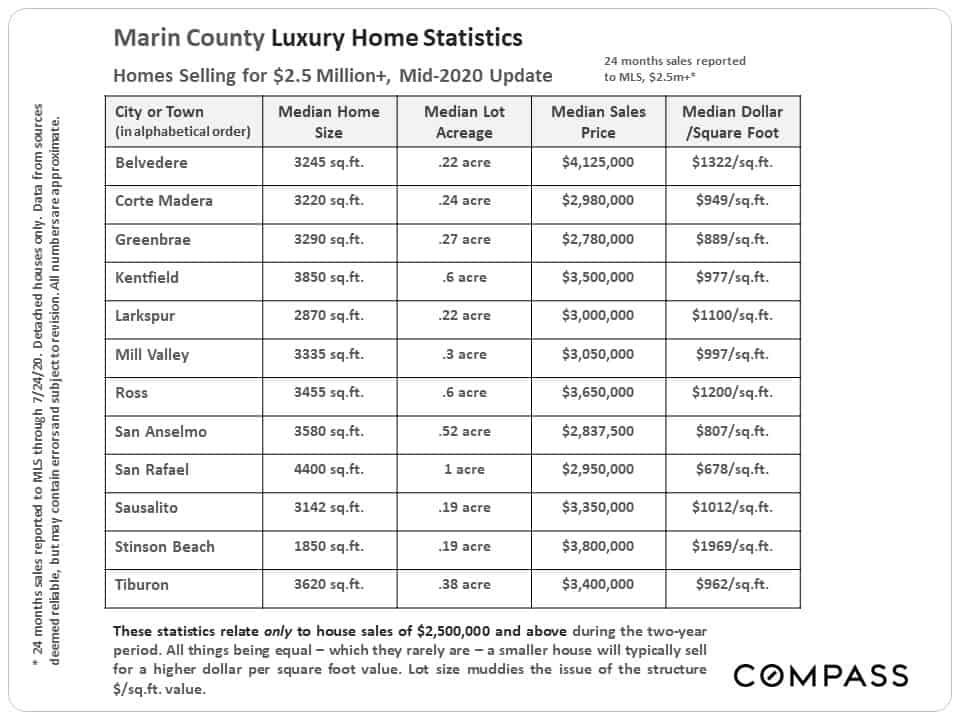
Selected Statistics on Homes Selling for $2.5 Million+
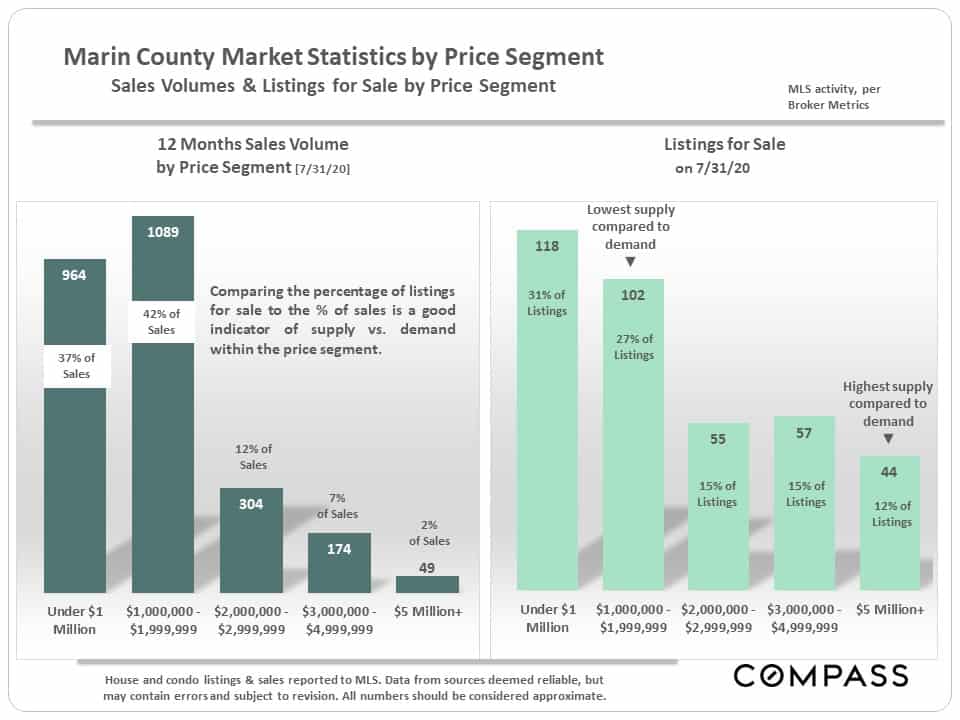
12 Months Sales & Listings for Sale, by Price Segment
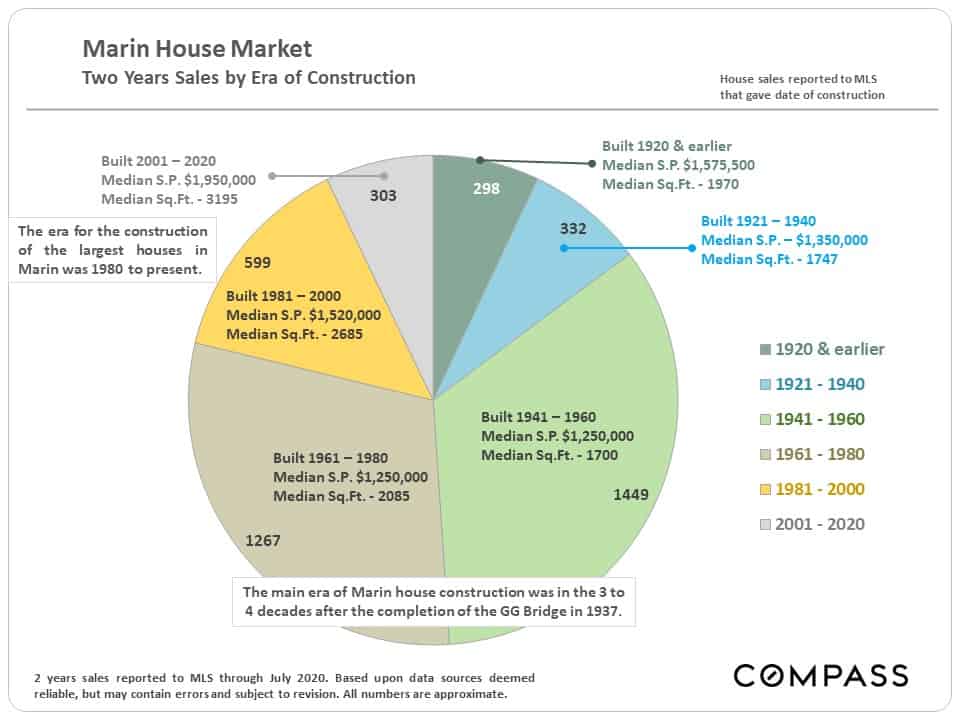
House Sales by Era of Construction