Marin October Real Estate Market Report 2020

Marin County Real Estate
7 Months into the Pandemic
October 2020 Report
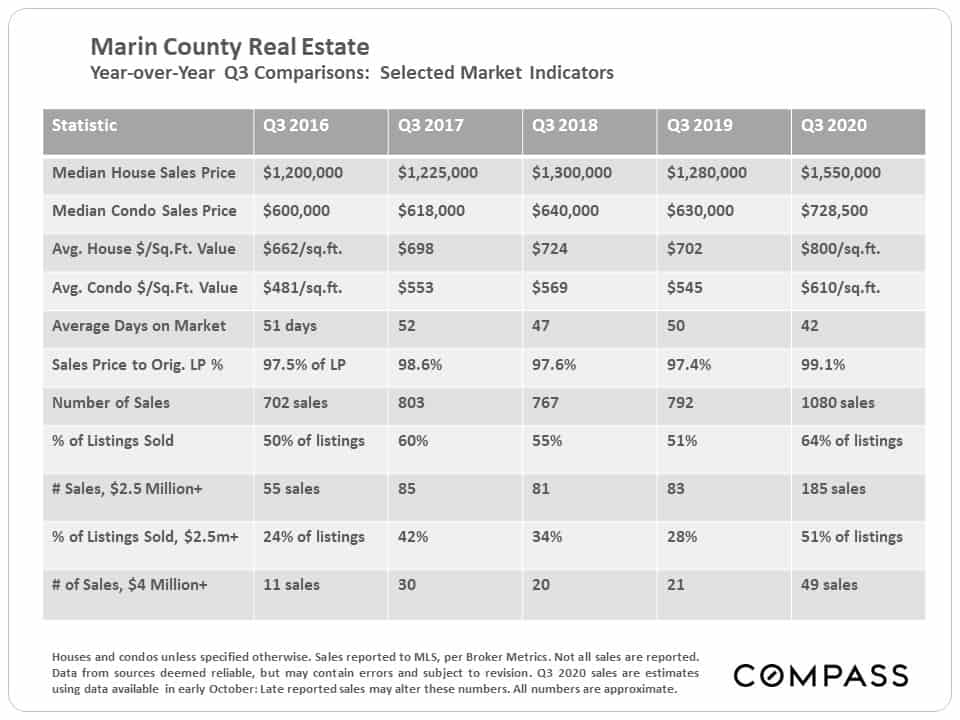
The table below compares Q3 statistics across 5 years. The huge jump in the median house sales price will be discussed further later in the report.
Median House Sales Price by Quarter
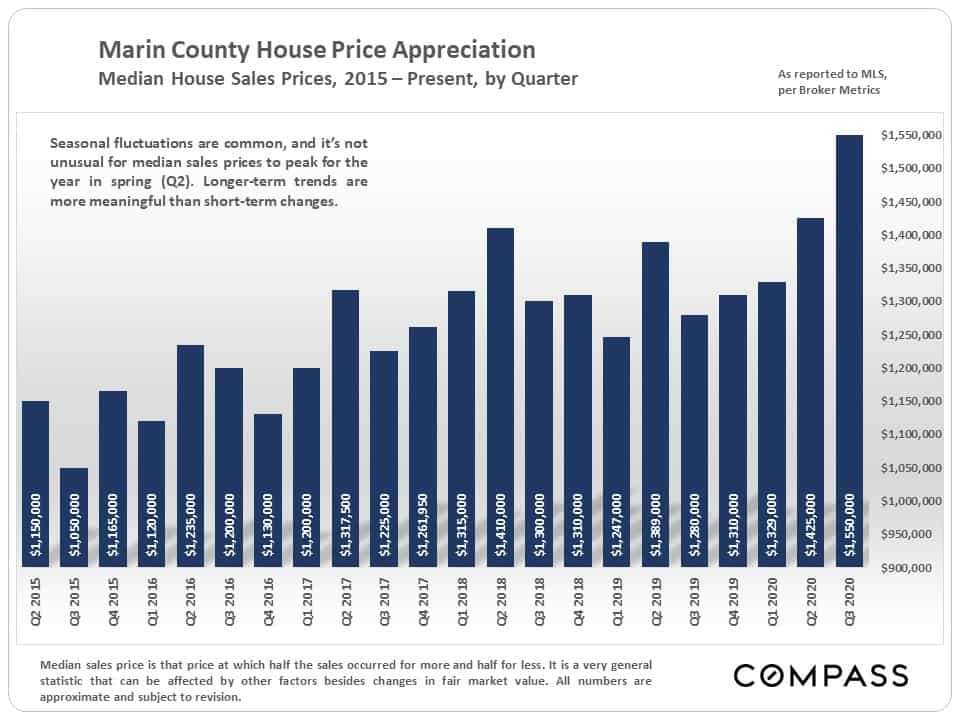
Median sales prices can rise because of increases in fair market value – i.e. buyers are paying more money for the same home (supply and demand) – and/or because buyers are purchasing larger, more expensive houses, often in more expensive communities. Both dynamics are currently at play, but it is certain that affluent and very affluent buyers have made up a dramatically increasing percentage of the demand in Marin and Bay Area markets.
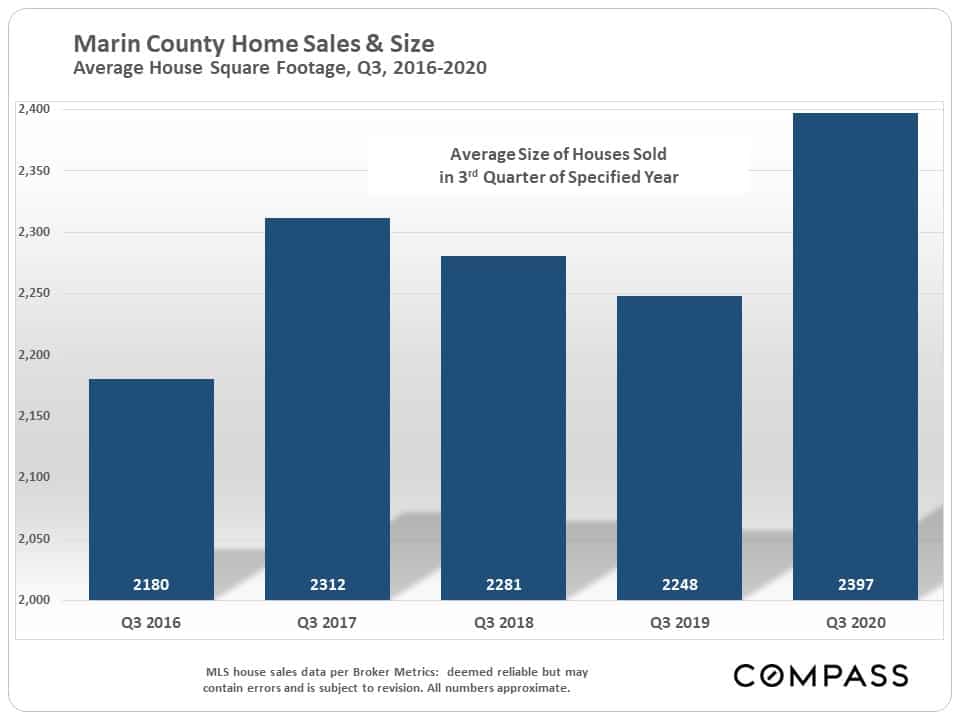
This next chart illustrates the large year-over-year increase in the average size of houses sold.
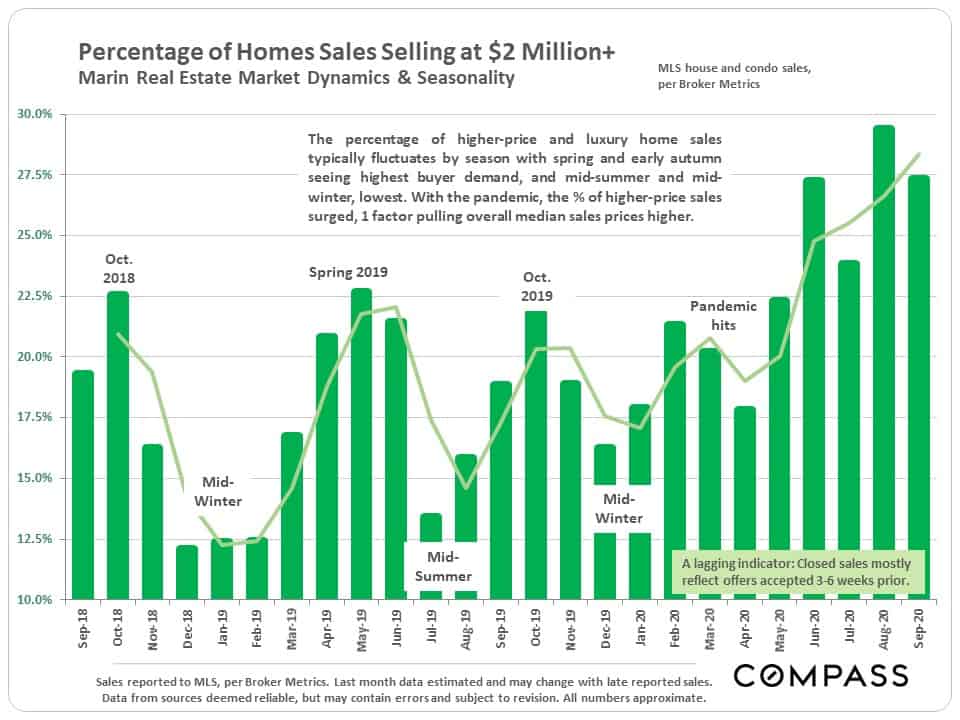
And this chart graphs the increasing percentage of higher-price home sales in recent months.
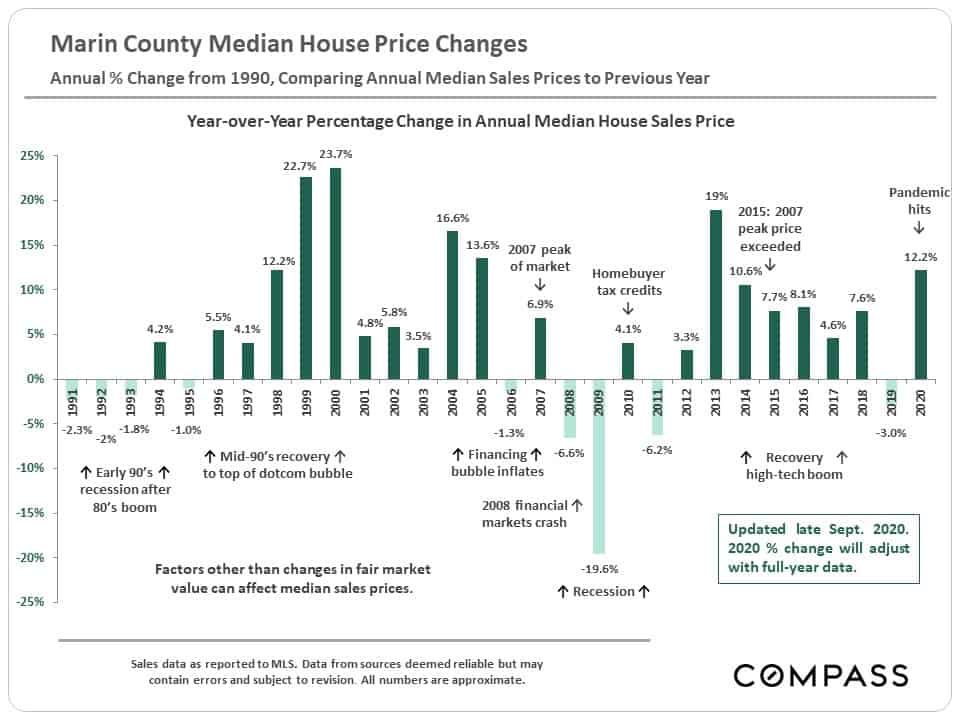
Annual percentage changes in median house sales price: The 2020 YTD percentage will almost certainly change, one way or another, by the time full-year sales data is in.
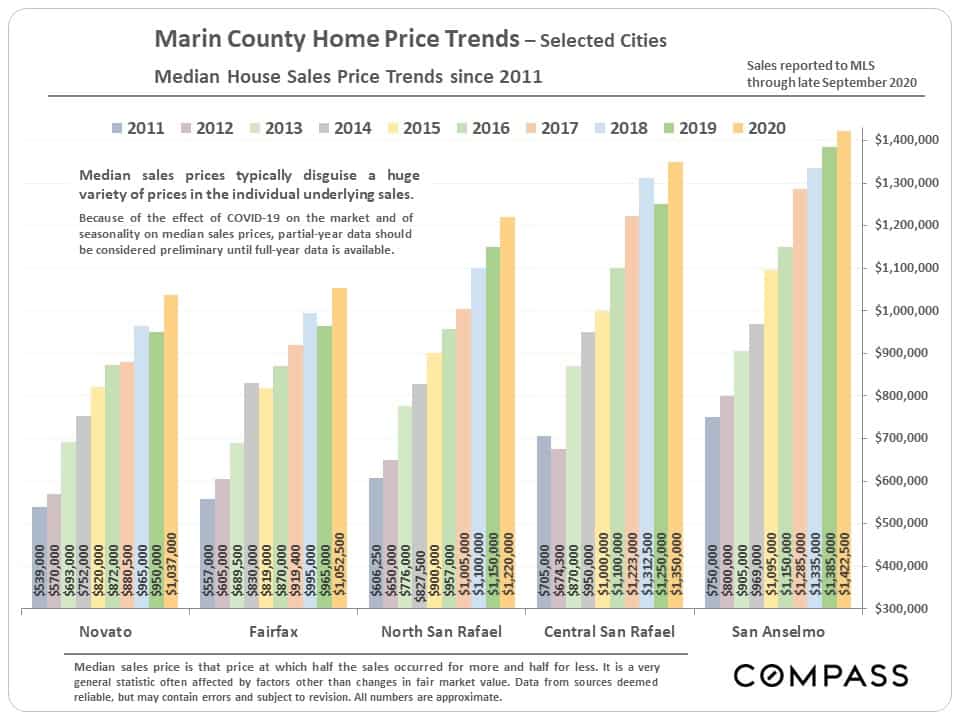
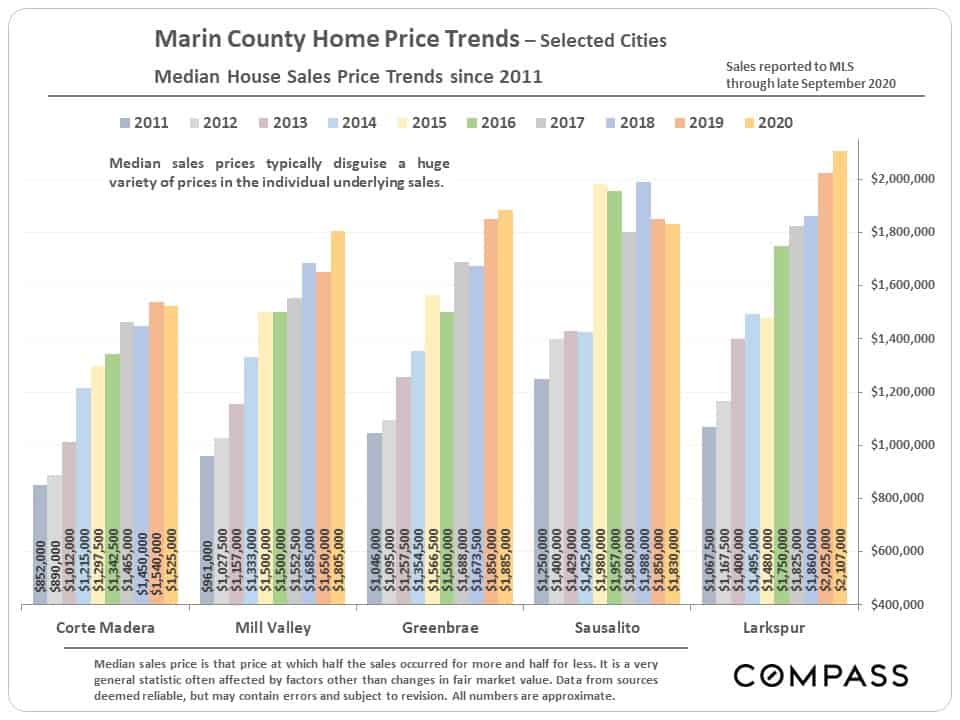
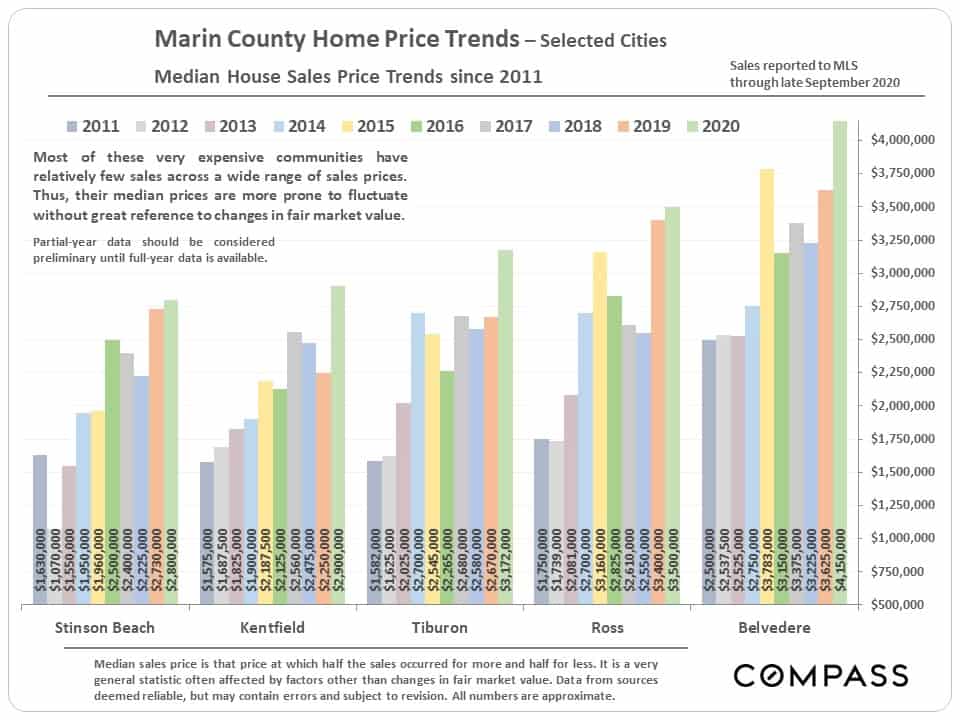
Median House Sales Price Trends by City
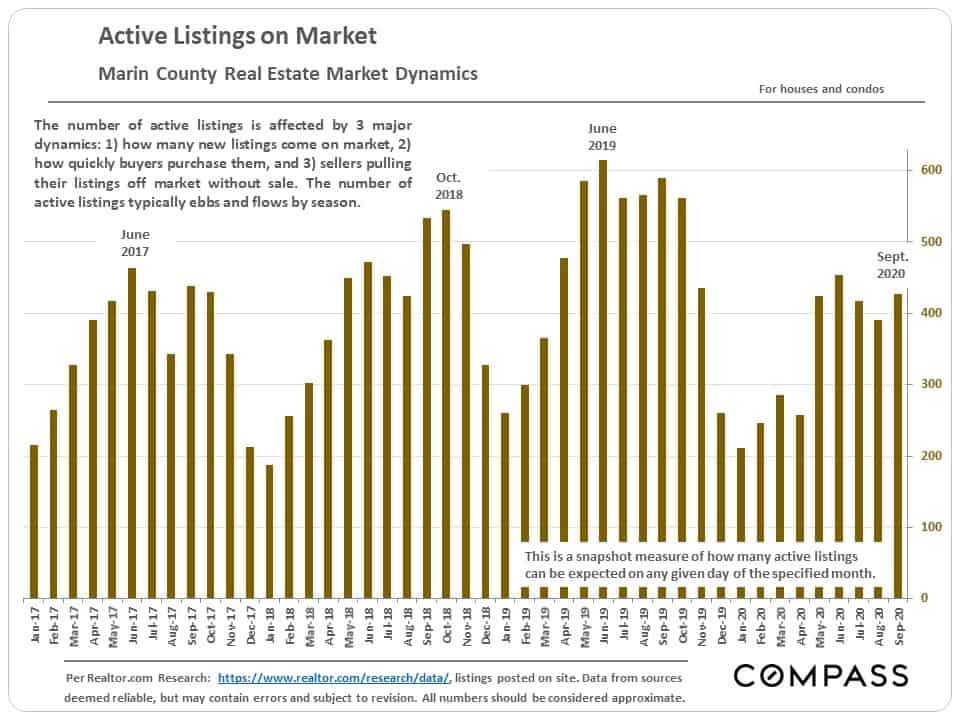
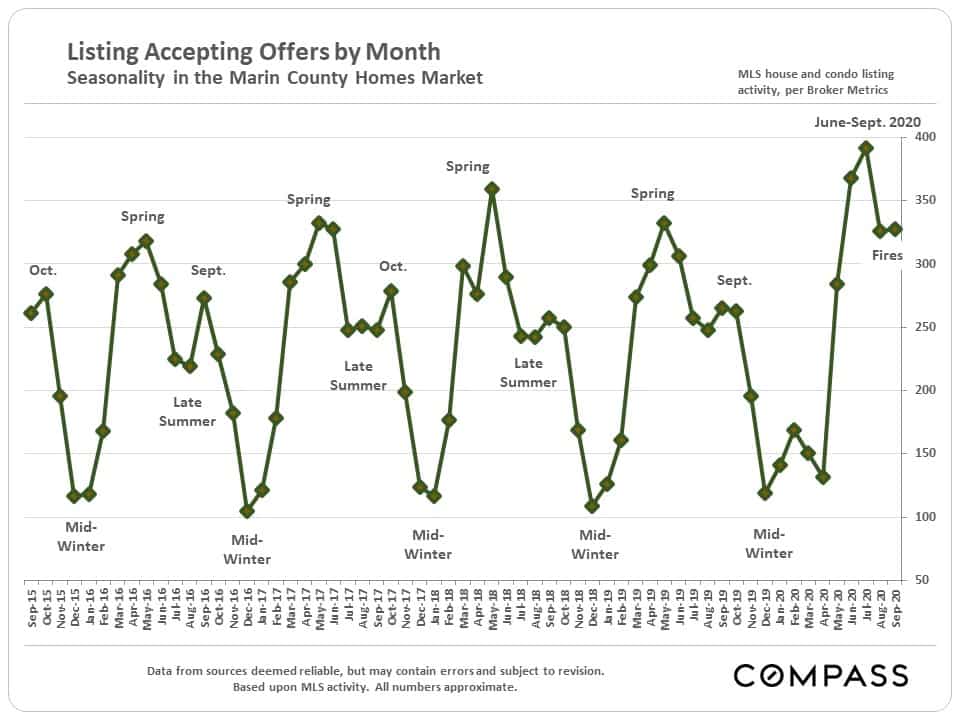
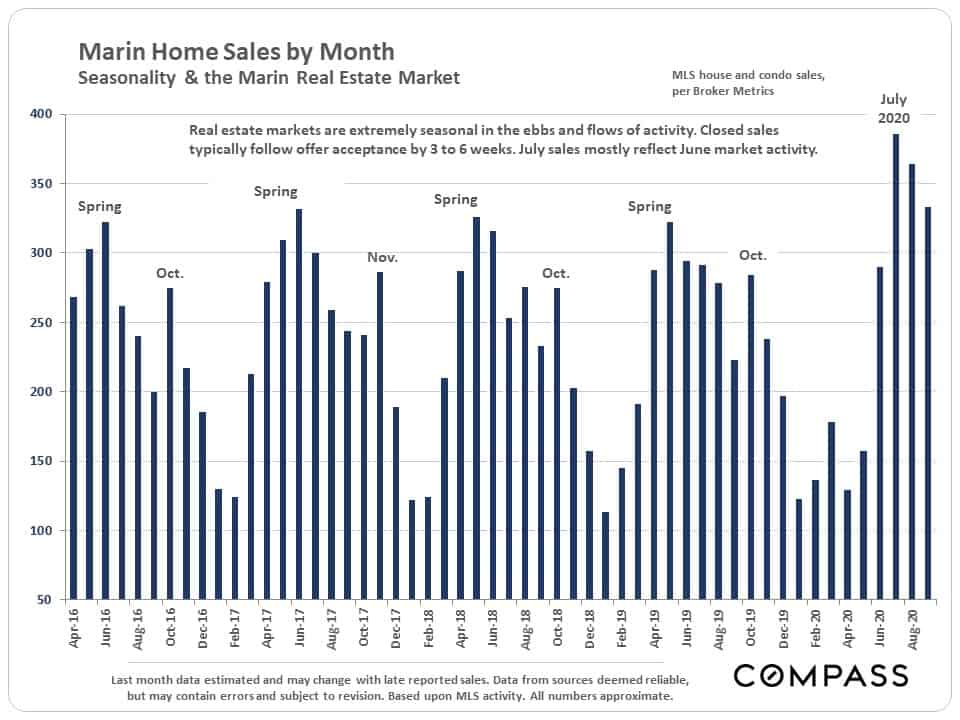
Selected Supply & Demand Indicators
In September, we also updated our semi-annual Survey of Bay Area Markets.