Santa Clara County October Real Estate Market Report

Updated Market & Census Statistics, Home Prices & Appreciation Rates, Luxury Home Sales, Price Reductions, Employment & Interest Rates
October 2019 Report
————
It will be another month before hard data on the autumn selling season begins to become available. In the meantime, below is a review of market trends and statistics through the third quarter. Note that September sales data mostly reflects market activity in August, a historically slow month.
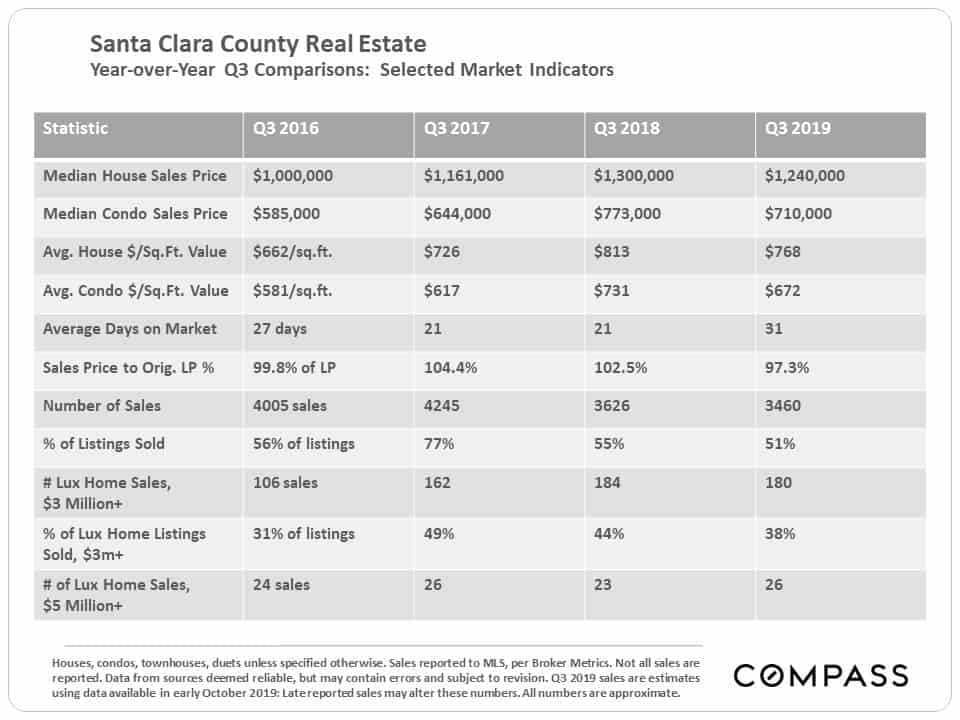
Year-over-Year Q3 Comparisons –
Q3 2016 – Q3 2019
Comparing Q3 2019 to Q3 2018, virtually every measure indicates a considerable softening in the market, though high-end home sales have held up relatively well.
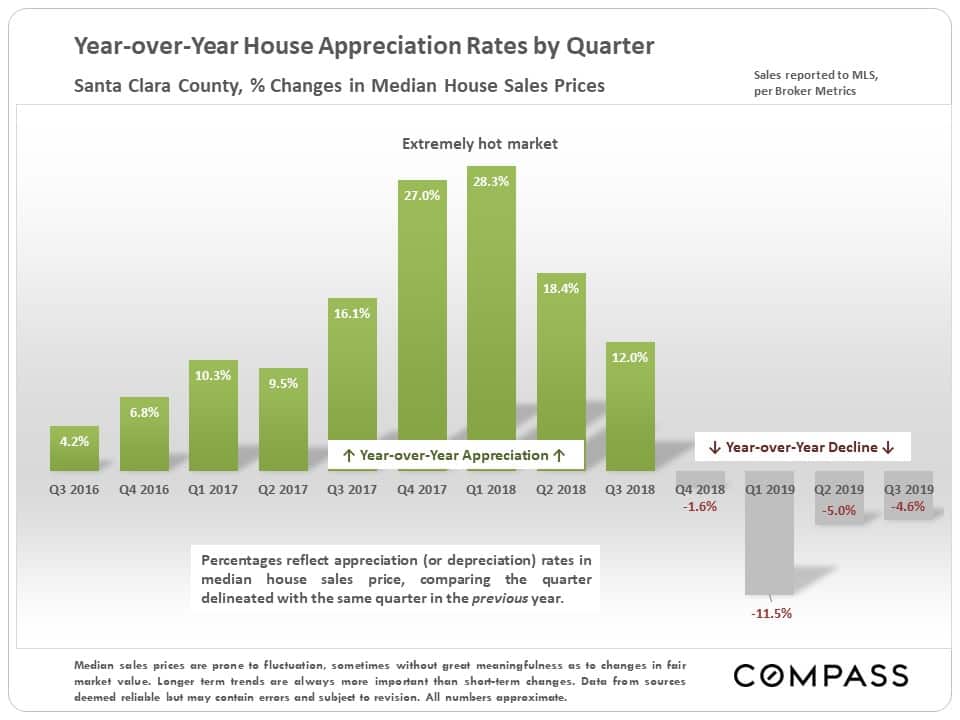
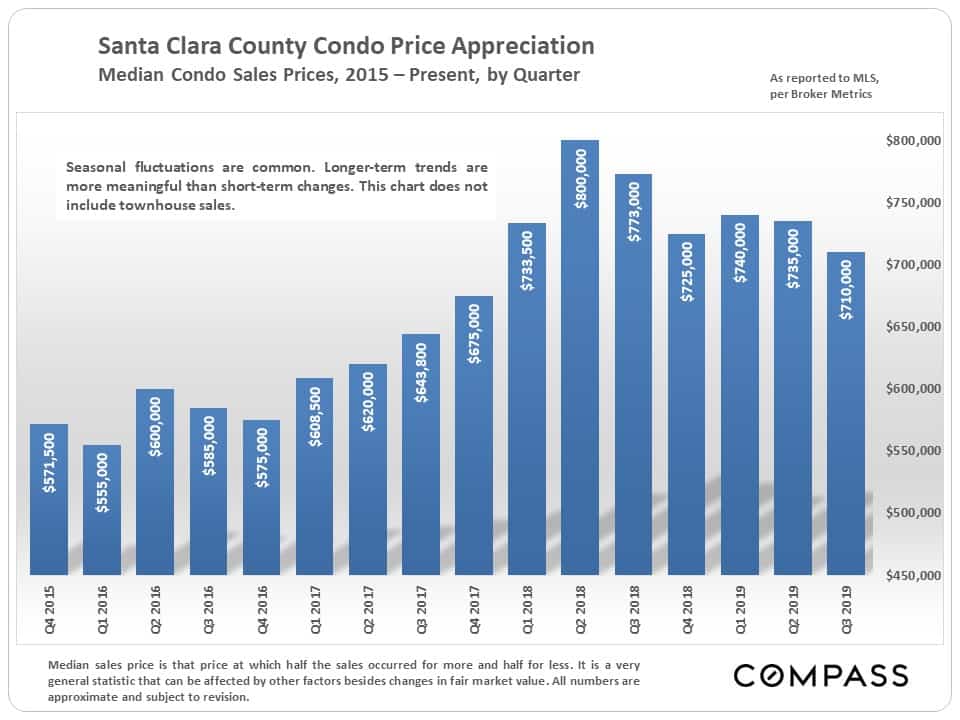
Median Home Sales Prices &
Year-over-Year Appreciation Rates
Both median house and median condo sales prices peaked in Q2 of 2018, at least for the time being.
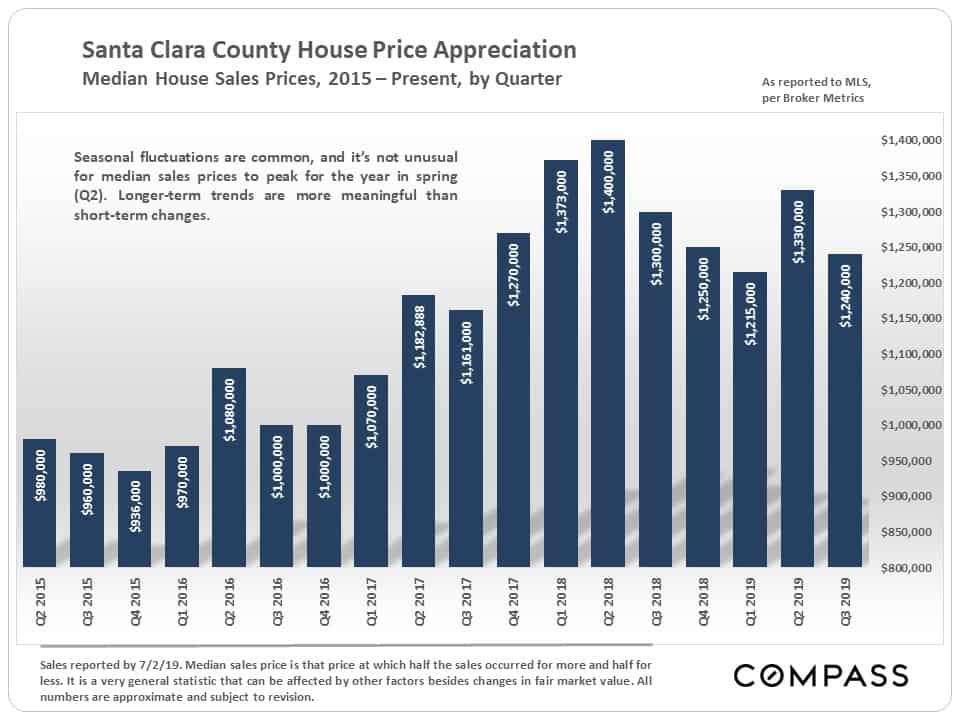
Santa Clara County has seen a radical shift over the past 4 quarters from the extremely high appreciation rates of the previous 5 quarters.
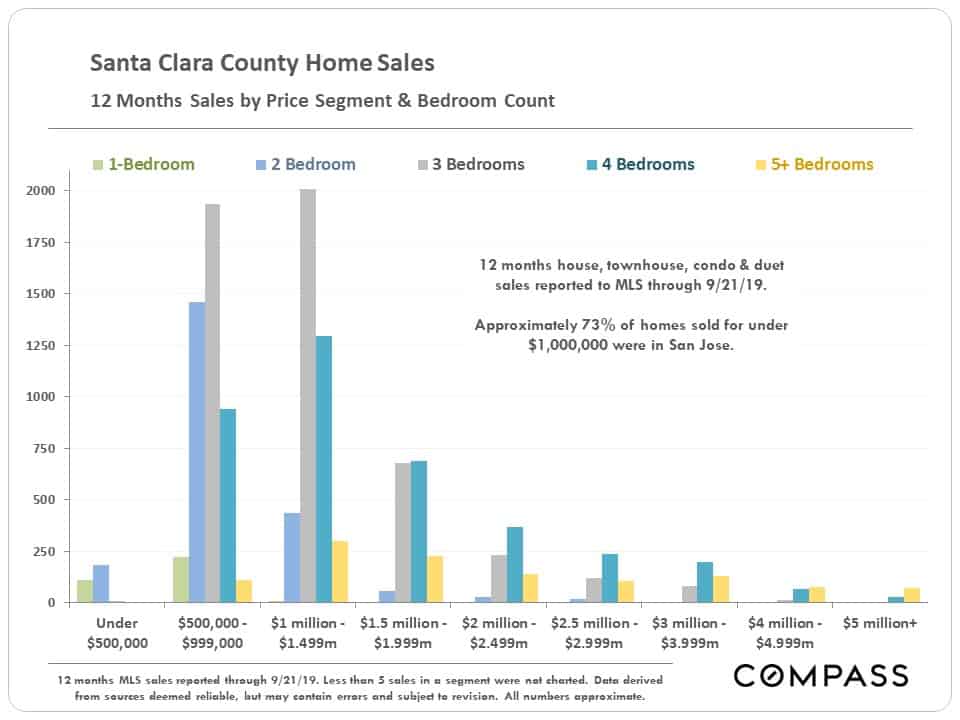
Home Sales by Price Segment & Bedroom Count
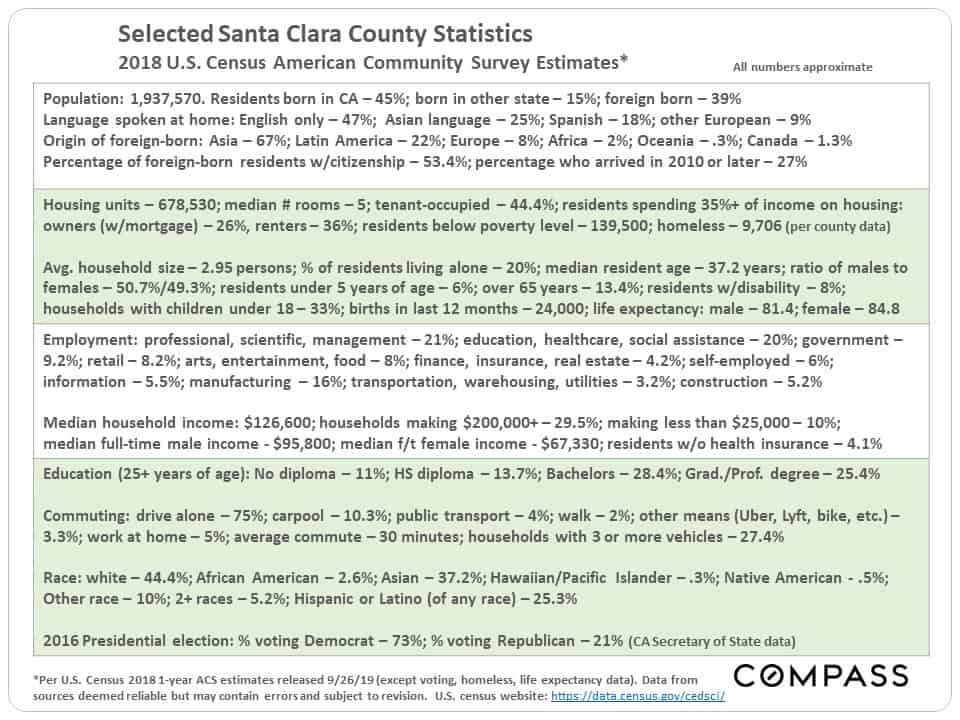
Updated Census Statistics
Underlying the real estate market are the changing details and circumstances of its population. At the end of September, the U.S. Census released its 2018 American Community Survey 1-year data estimates for a broad range of economic, social and demographic statistics. Below is a selection of survey insights into our community, plus 2 or 3 statistics from other sources. (You may want to expand this slide for easier reading.)
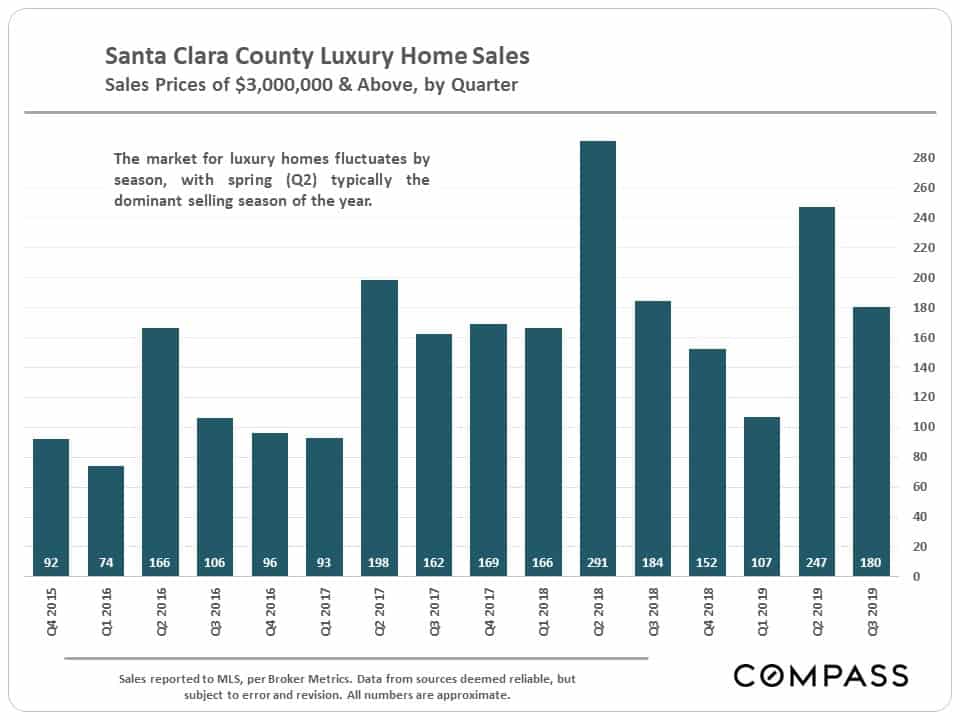
Luxury Home Sales
Luxury home sales peaked in Q2 2018, but Q3 2018 to Q3 2019, year-over-year sales volume remained stable.
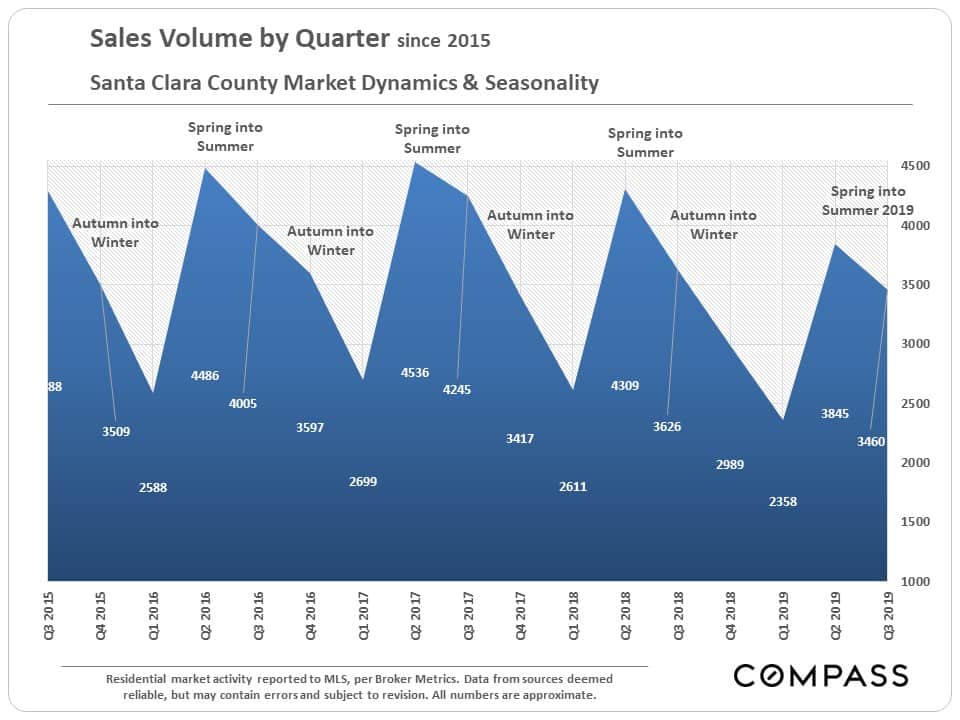
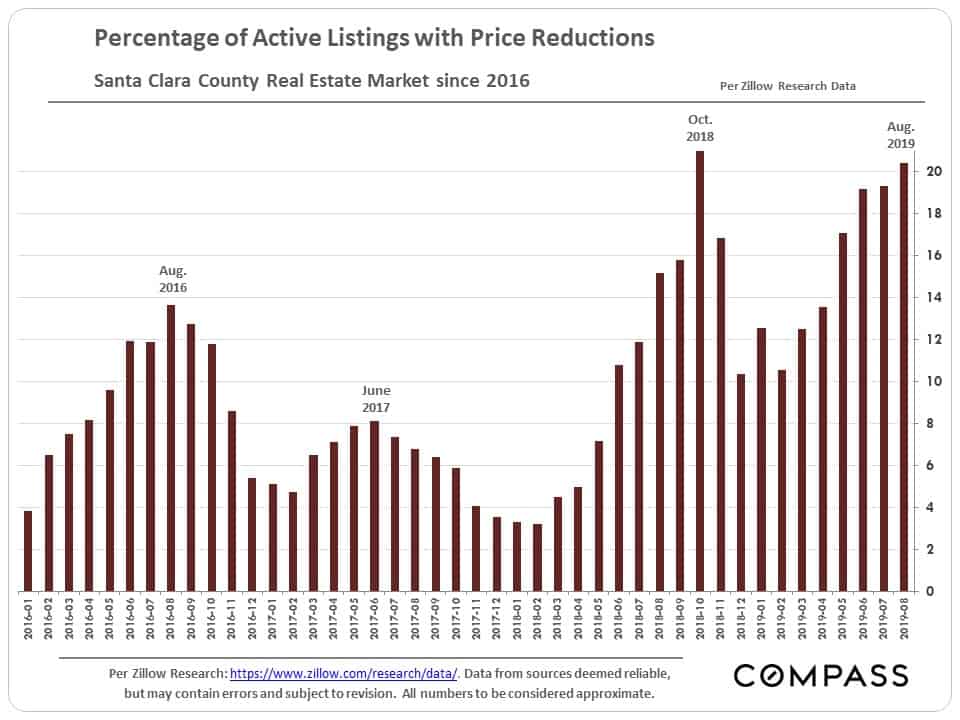
Sales Volumes & Price Reductions
Over the past 2 years. the number of sales has declined significantly, and the number of price reductions has surged dramatically. These are typically signs of a mismatch between seller and buyer expectations regarding fair market value.
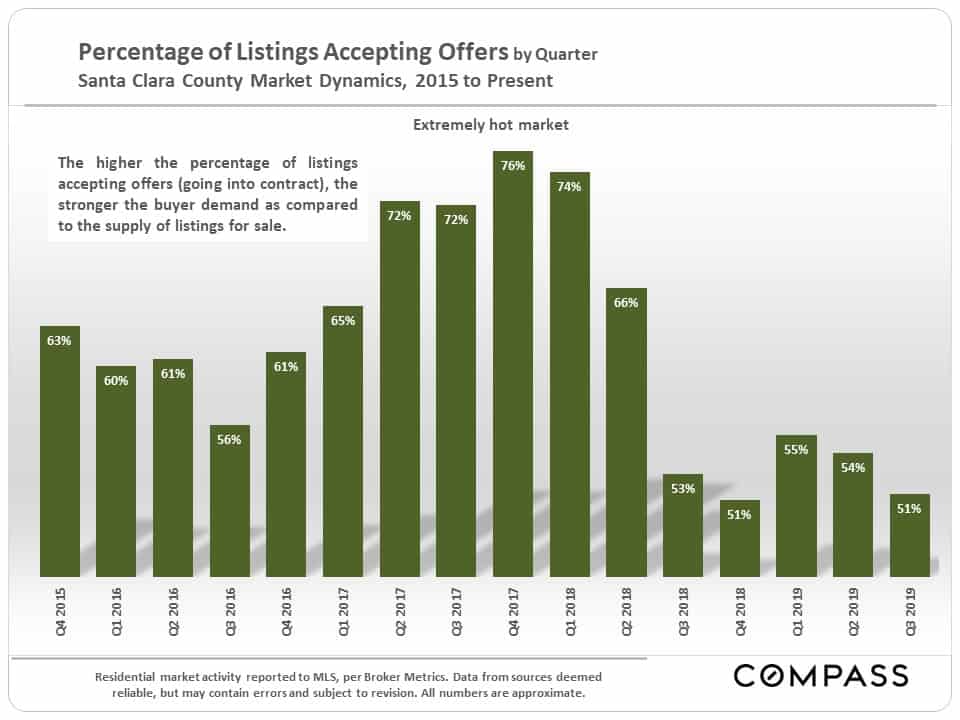
One of the clearest indicators of market conditions is the percentage of listings accepting offers. It is not that the percentages in the past 5 quarters are so terribly low, historically speaking, it is that the percentages seen in prior quarters were fantastically high. Sometimes, one’s sense of the market is distorted by the sheer contrast between 2 periods. Santa Clara County transitioned from being probably the hottest metro-area market in the country to, simply, a more normal market.
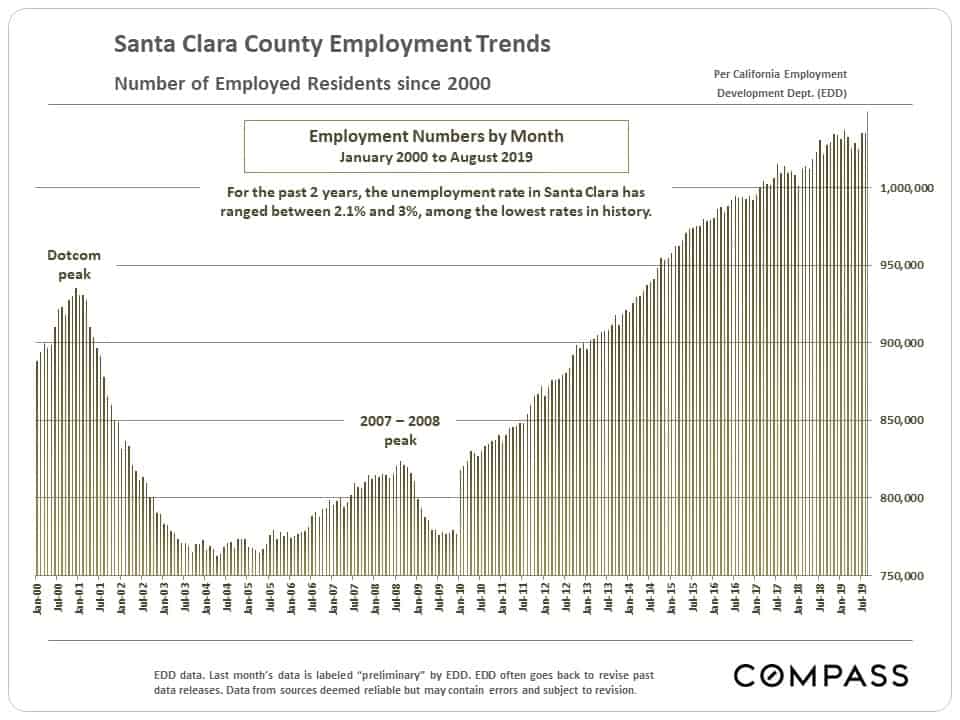
Employment Trends since 2000
Behind the story of home price appreciation since 2000 are the ups and down in the number of employed residents. After a spectacular boom in job creation since 2010 – many of the new jobs extremely well paid – the number has generally leveled off in the past year (according to the CA Employment Development Department). That still qualifies as short-term data.
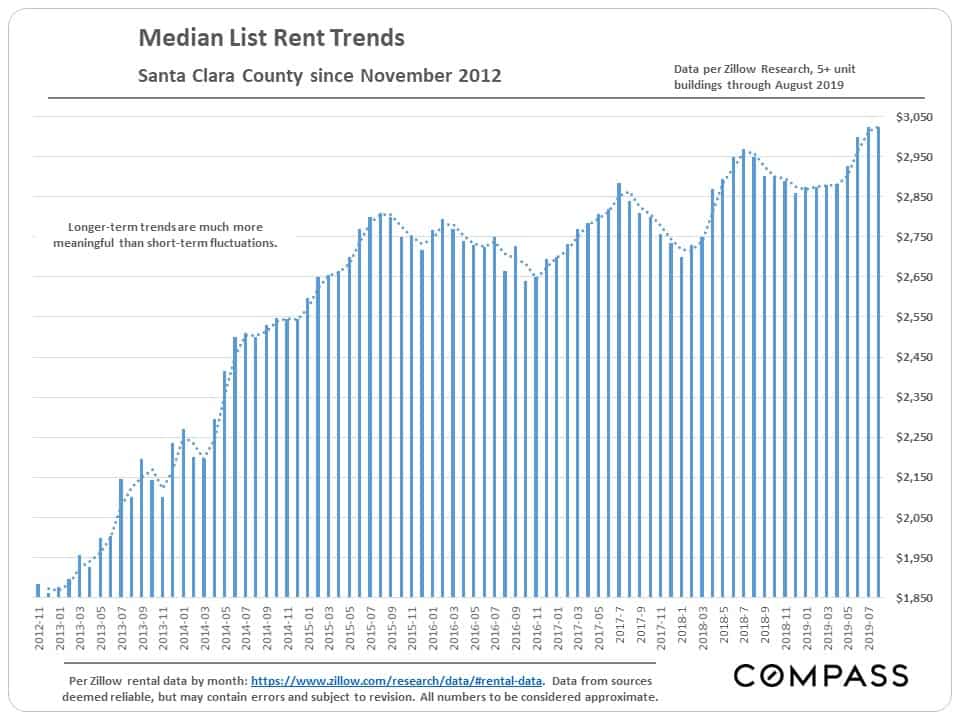
County Rent Trends
Housing affordability, rents and rent control have been much in the news. Illustrated below is the dramatic increase in rent rates since 2012. Economists believe there should be generally parallel trends in rents and home prices, those being the 2 housing options (besides living with one’s parents). Any significant divergence should correct itself over time.
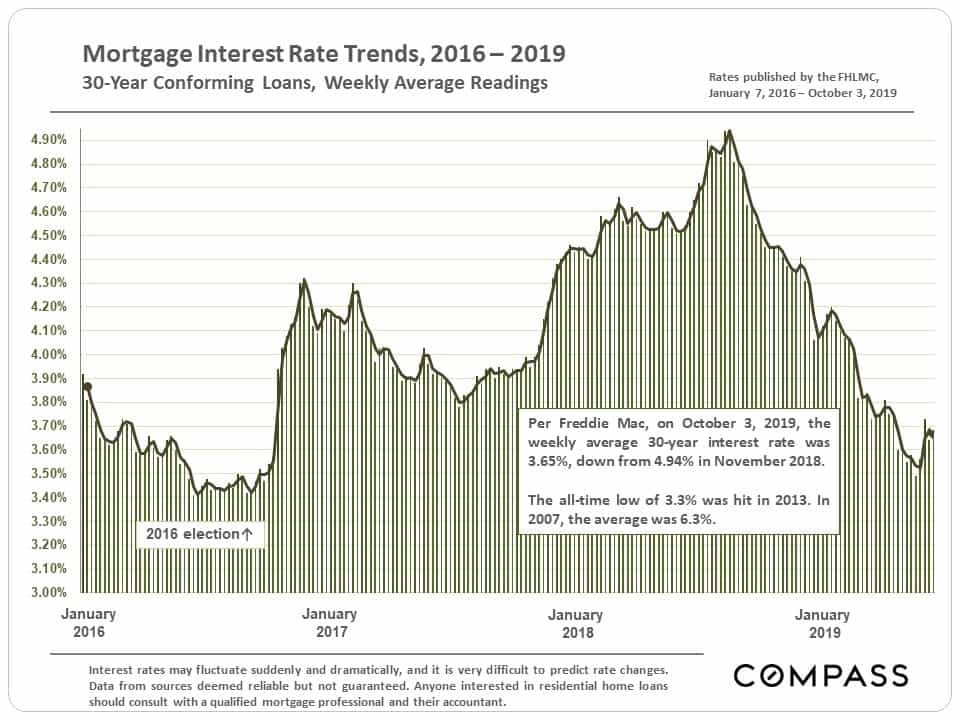
Mortgage Interest Rates
A year ago, many experts predicted that interest rates in 2019 would average in the 5.5% range, but they plummeted instead, a major dynamic in this year’s market. Note: Historically, it has been very difficult to predict interest rate movements.