Santa Clara County December Real Estate Market Report

Santa Clara County Real Estate
December 2019 Market Snapshots
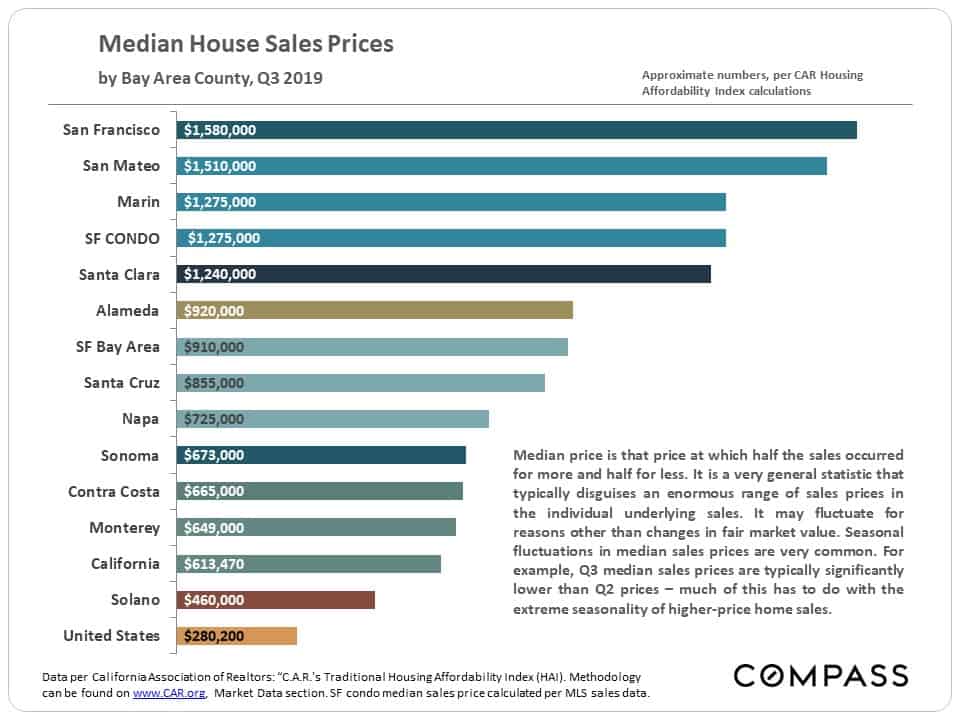
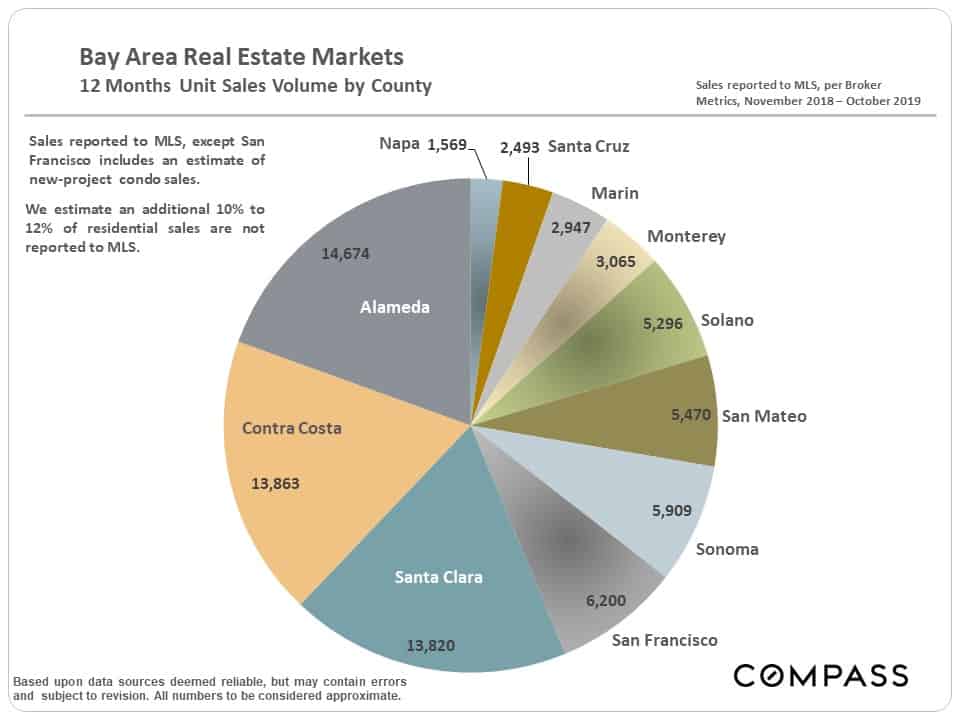
Bay Area Home Prices & Market Sizes
Estimated Percentage Appreciation since 2012 –
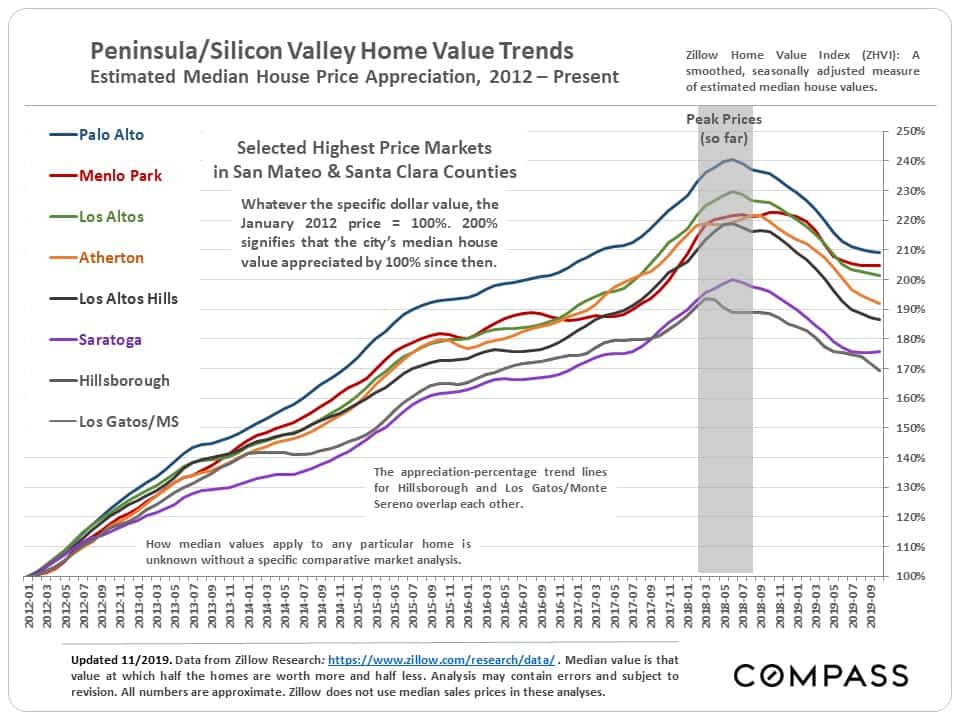
Most Expensive Markets, Peninsula/Silicon Valley
This next chart looks at percentage appreciation since 2012 in the most expensive cities of Santa Clara & San Mateo Counties. This graph does not delineate prices, which vary hugely, only estimated percentage home price changes over time. According to the calculations of this algorithm, the most recent peak in median home values occurred in the first half of 2018.
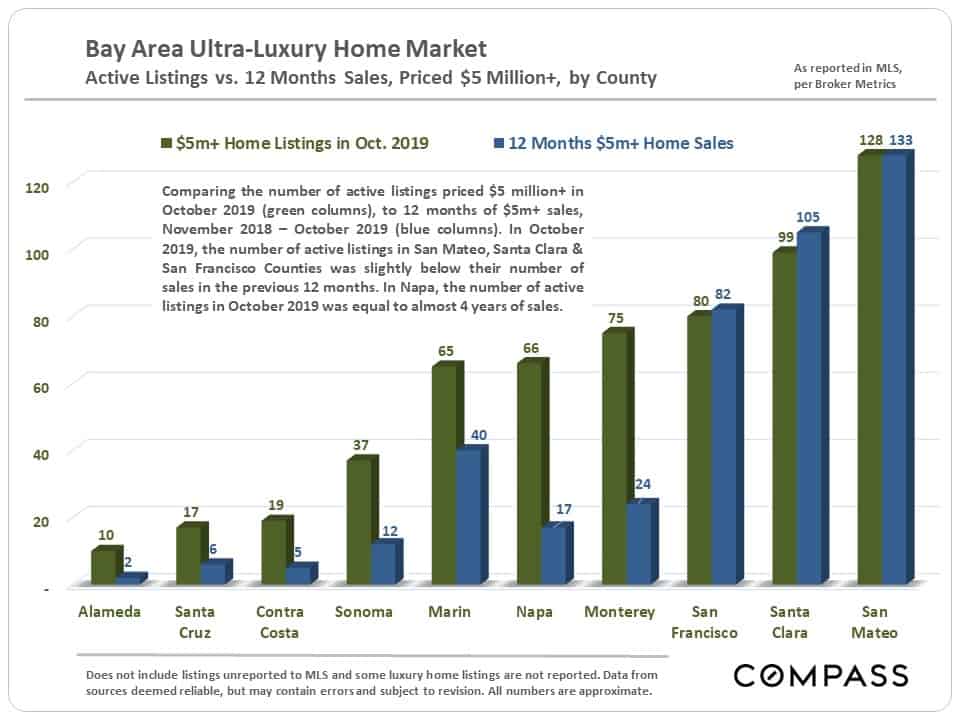
Bay Area Markets for Homes of $5 Million+
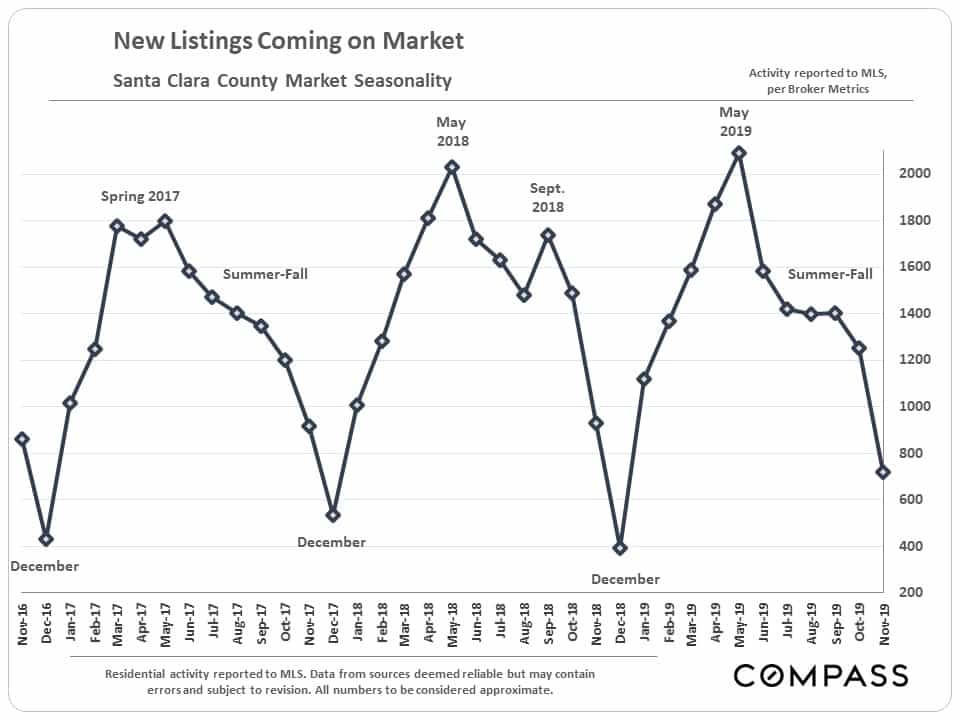
Market Seasonality: New Listings
Coming on Market
The market is now deep into its seasonal plunge in activity, which hits its nadir in December.
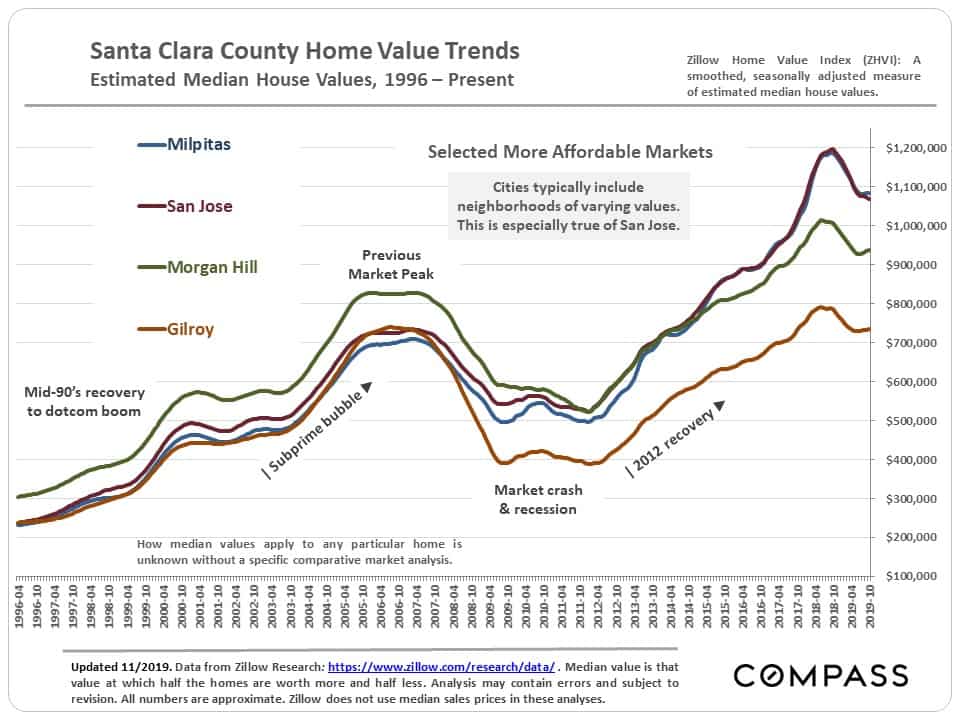
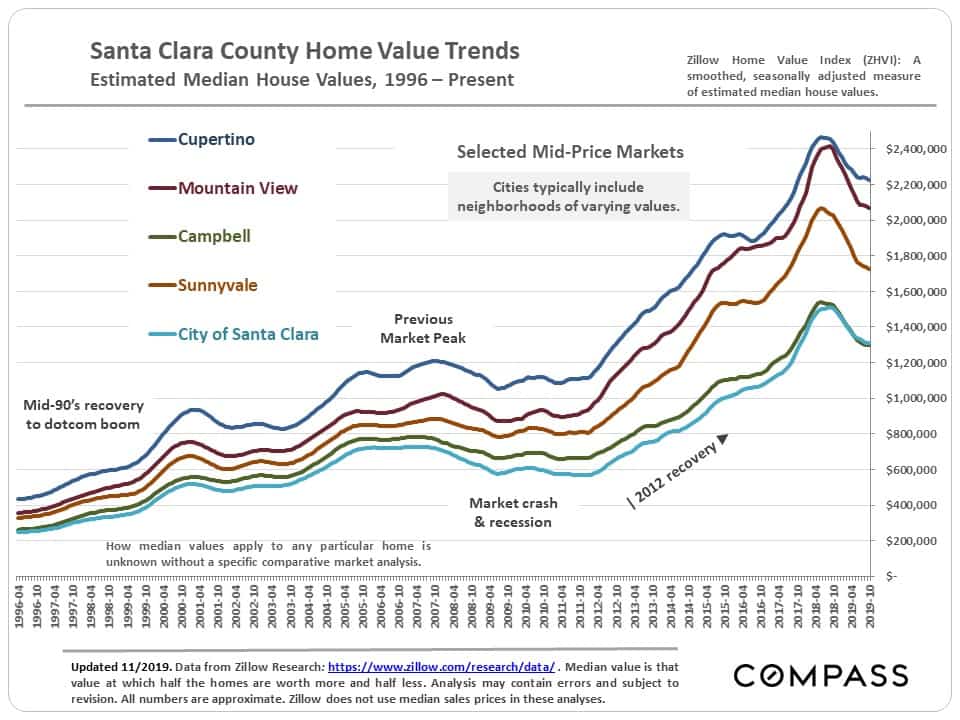
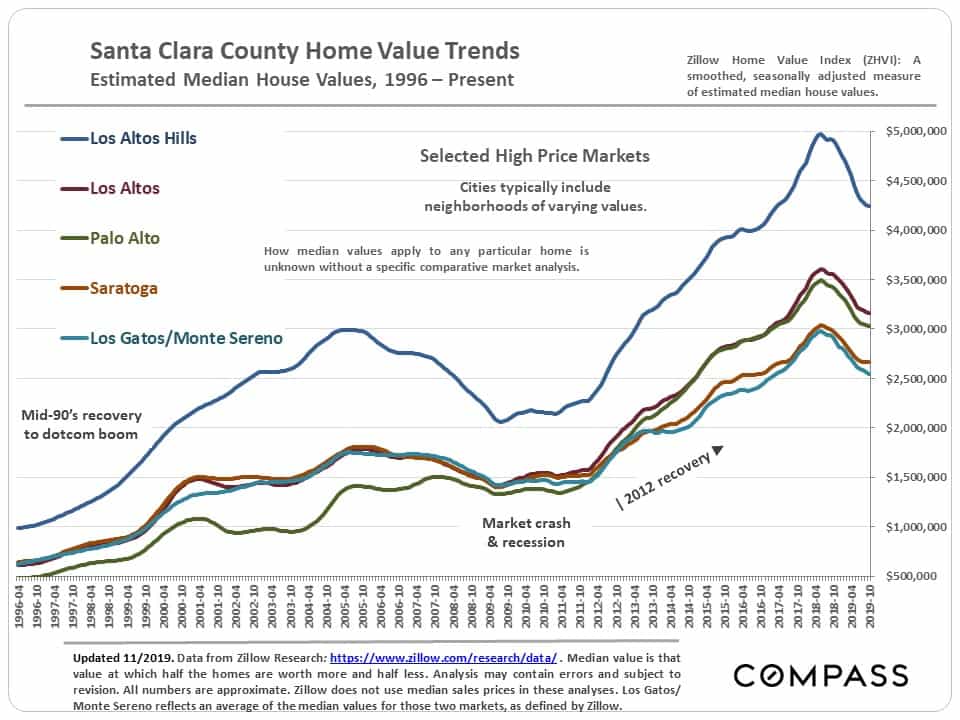
Estimated Median Home Price Trends
by City since 1996
The following charts reflect estimated calculations of median home price trends since 1996 by an algorithm created for that purpose. As always, these numbers should be considered very general approximations of prices in complex markets containing homes of widely varying size and quality.
Due to the large drop in interest rates since Q4 2018 and the drop in home prices, the percentage of county households able to afford to buy a median priced house with a 20% down-payment has ticked up in 2019.
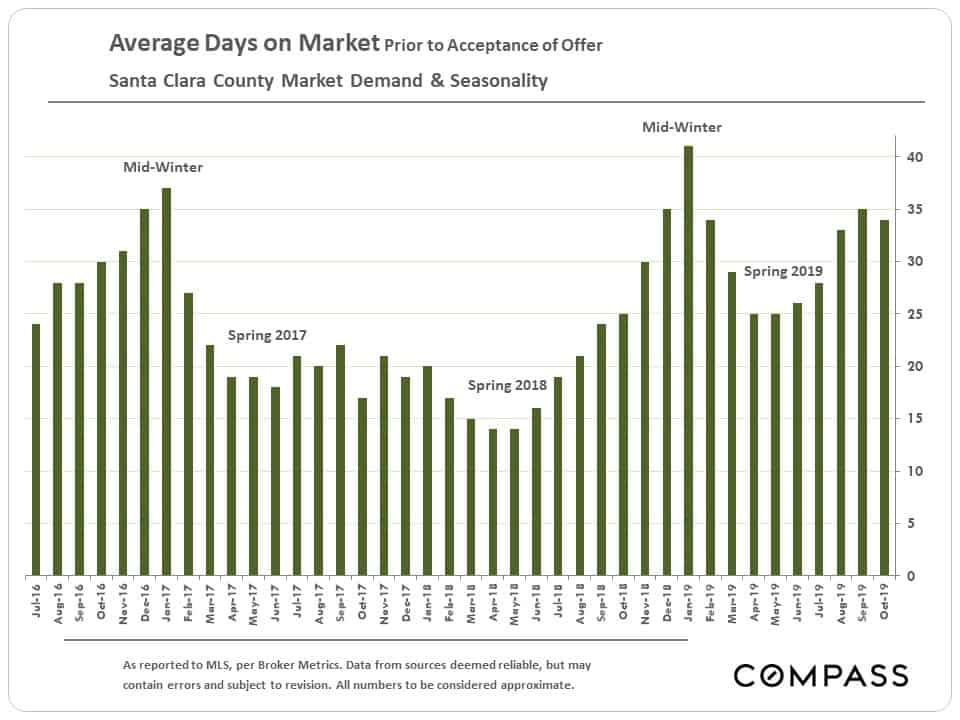
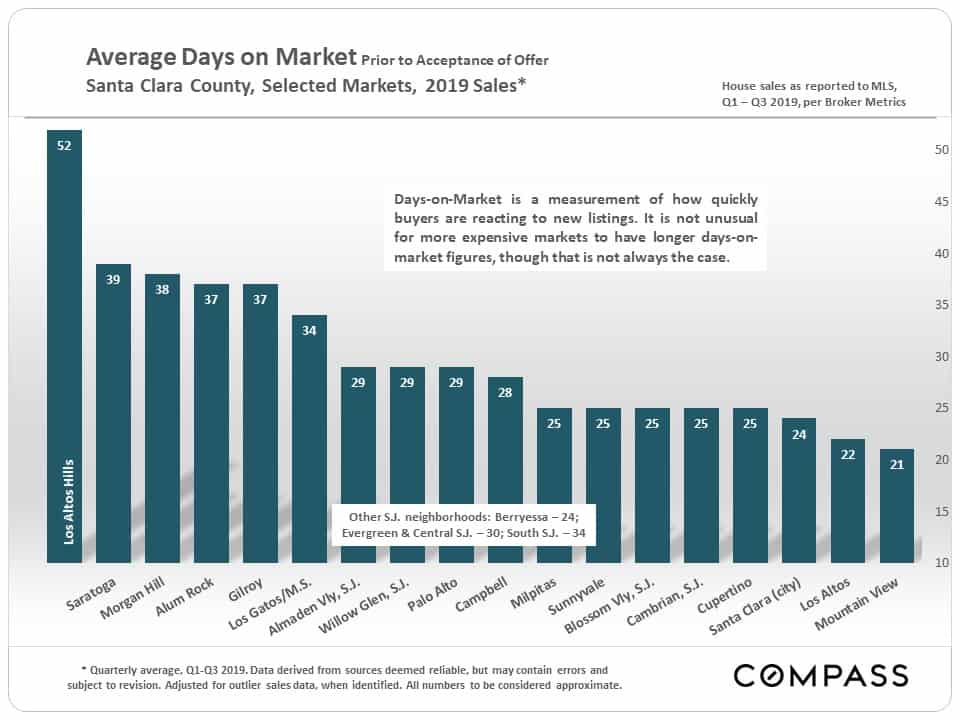
Average Days on Market
– County & City
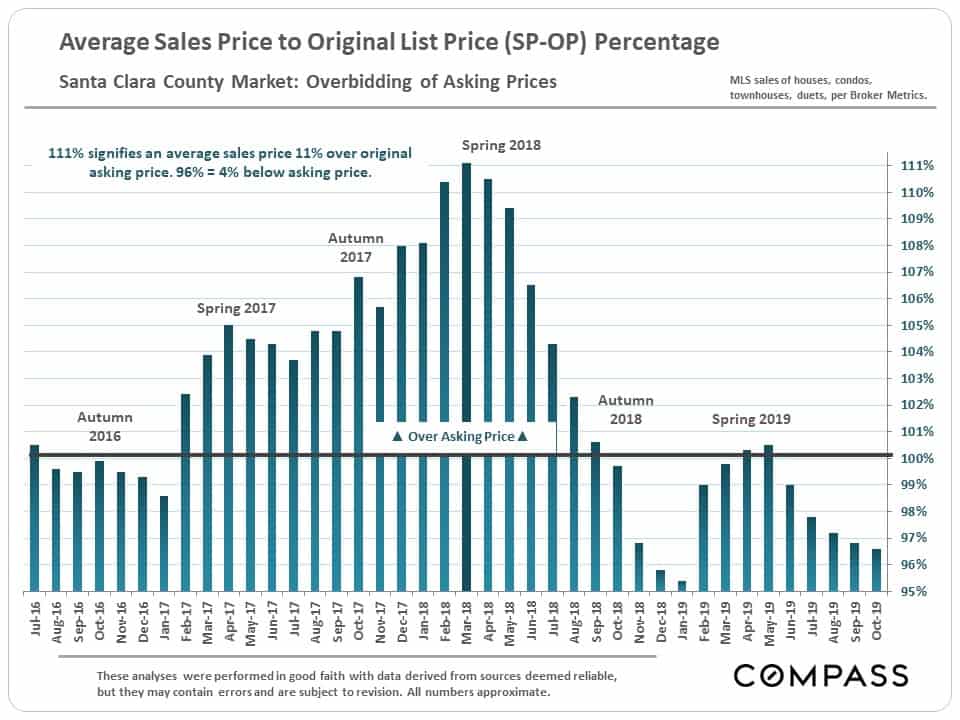
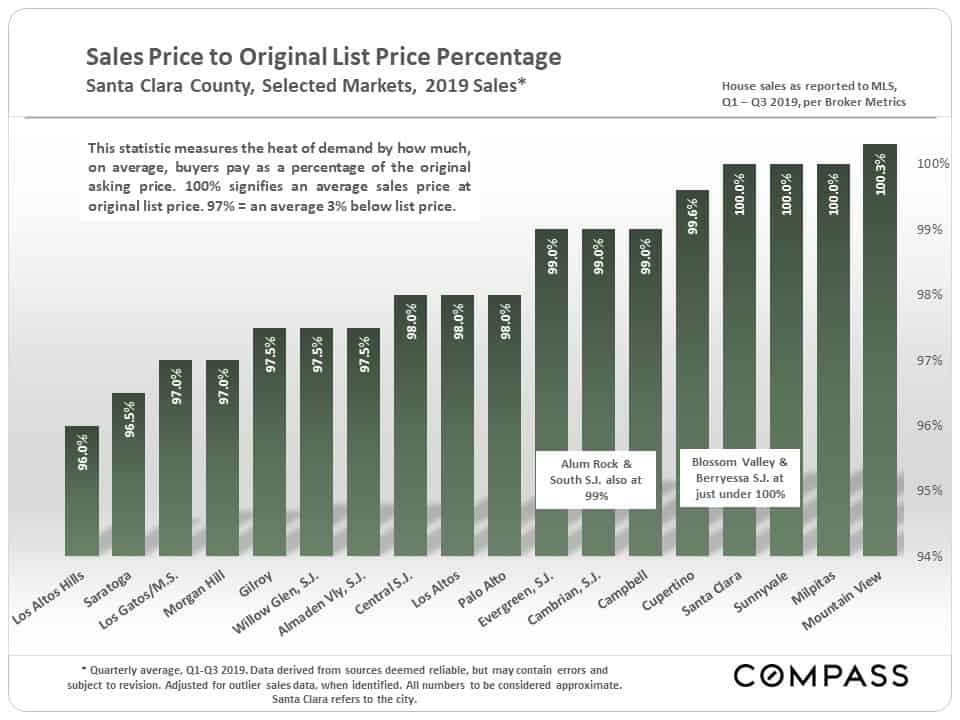
Average Sales Price to Original List Price %
– County & City
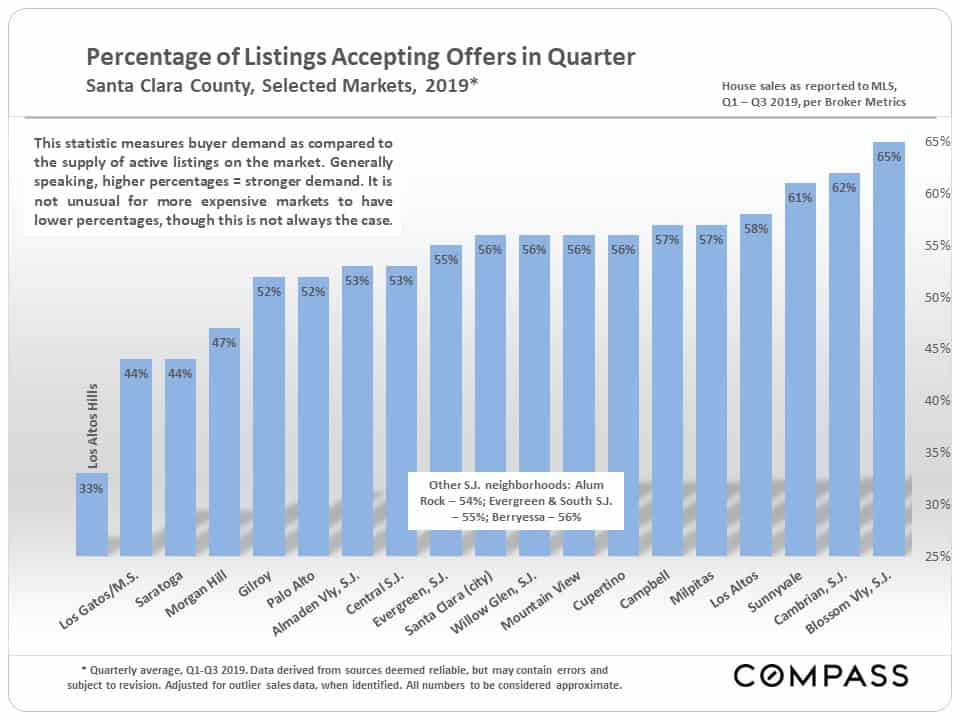
Percentage of Listings Accepting Offers
by City
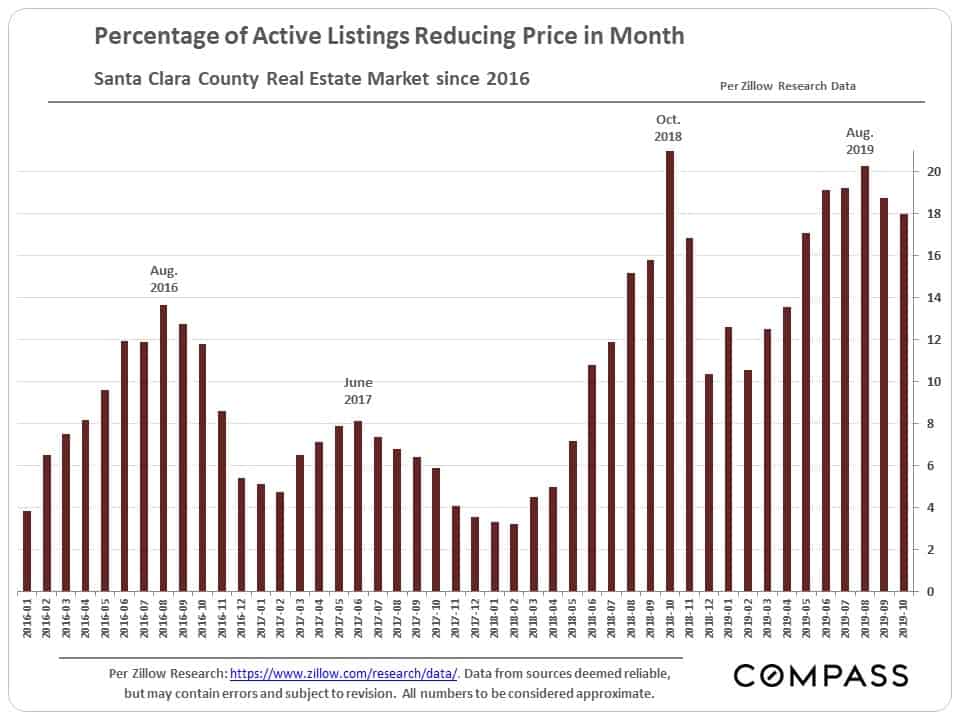
Price Reductions by Month –
Santa Clara County