Santa Clara County February Real Estate Market Report
Heading into the 2019 Market
February 2019 Report
As of early February, the government shutdown is over – at least for a couple weeks – the stock market has recovered dramatically from its late 2018 plunge, and interest rates are well down from November highs. A good number of large, local, high-tech “unicorns” continue to plan IPOs in 2019. All these are positive economic indicators for the Bay Area real estate market – though indicators have proven to be quite volatile over the past 5 months and future movements are not to be taken for granted.
As detailed in our last report, there was considerable cooling in the Santa Clara market in the second half of 2018, especially as compared to the white hot conditions of last spring. The month of January typically has the fewest sales of the year, sales which mostly reflect activity during the December market doldrums: So, we don’t consider its data to be a reliable indicator of conditions or trends. But activity is picking up, and the beginning of the spring sales season – which in the Bay Area can start as early as February – will soon provide more direction as to where the market is heading.
Market Overviews
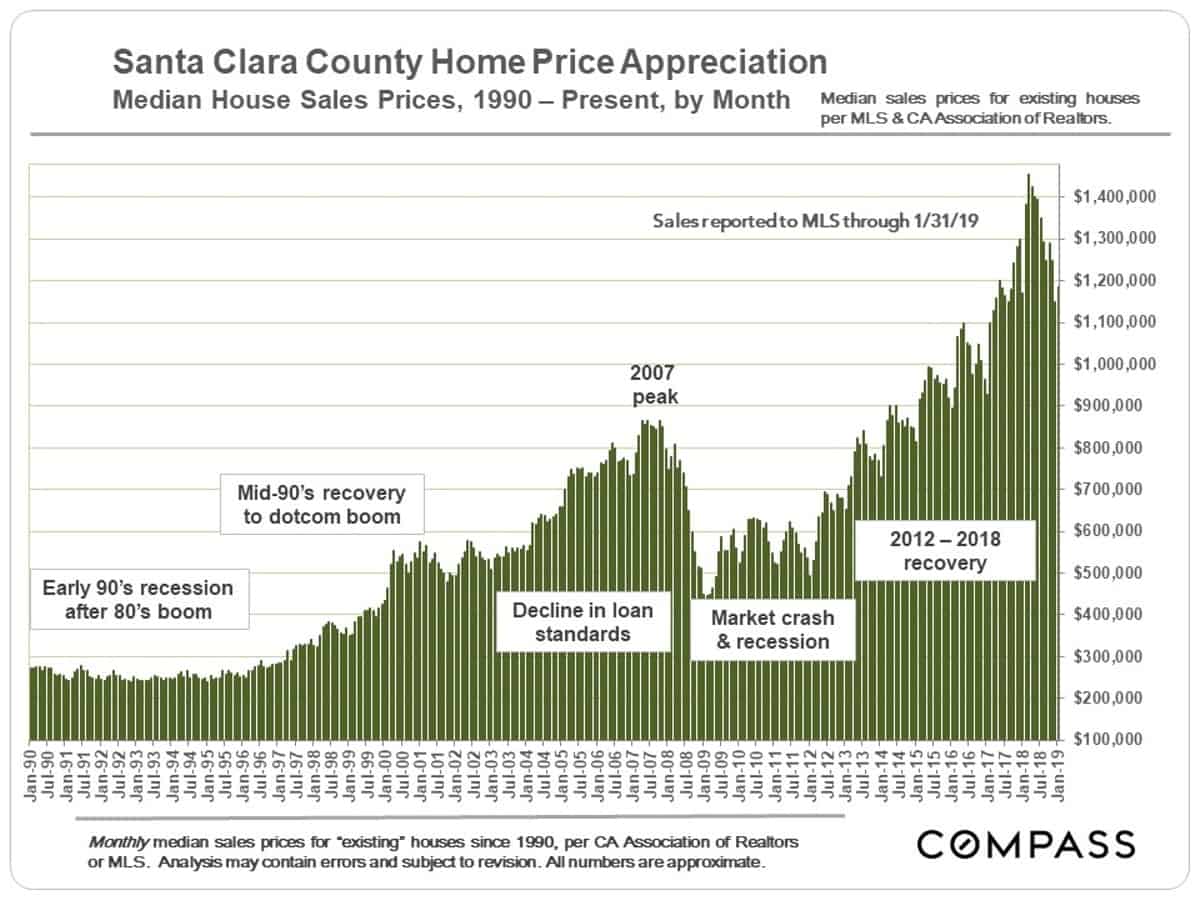
Median House Sales Prices since 1990
Median home prices fluctuate by month and by season, sometimes without great reference to changes in fair market value. But one can see the tremendous spike in prices that occurred at the end of 2017 through spring 2018, which then fell back in the second half of the year.
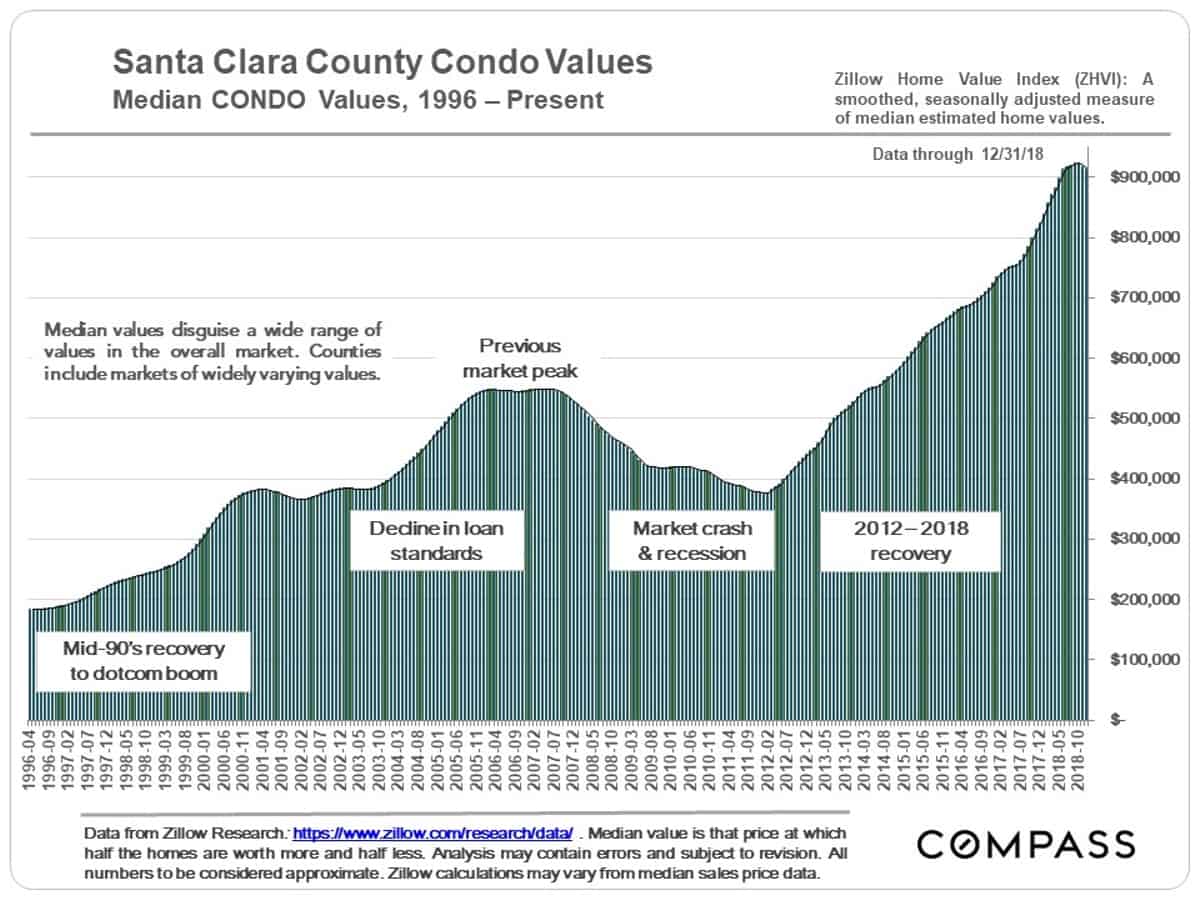
Median Condo Value Appreciation since 1996
Monthly and seasonal fluctuations are smoothed out in this median condo value chart.
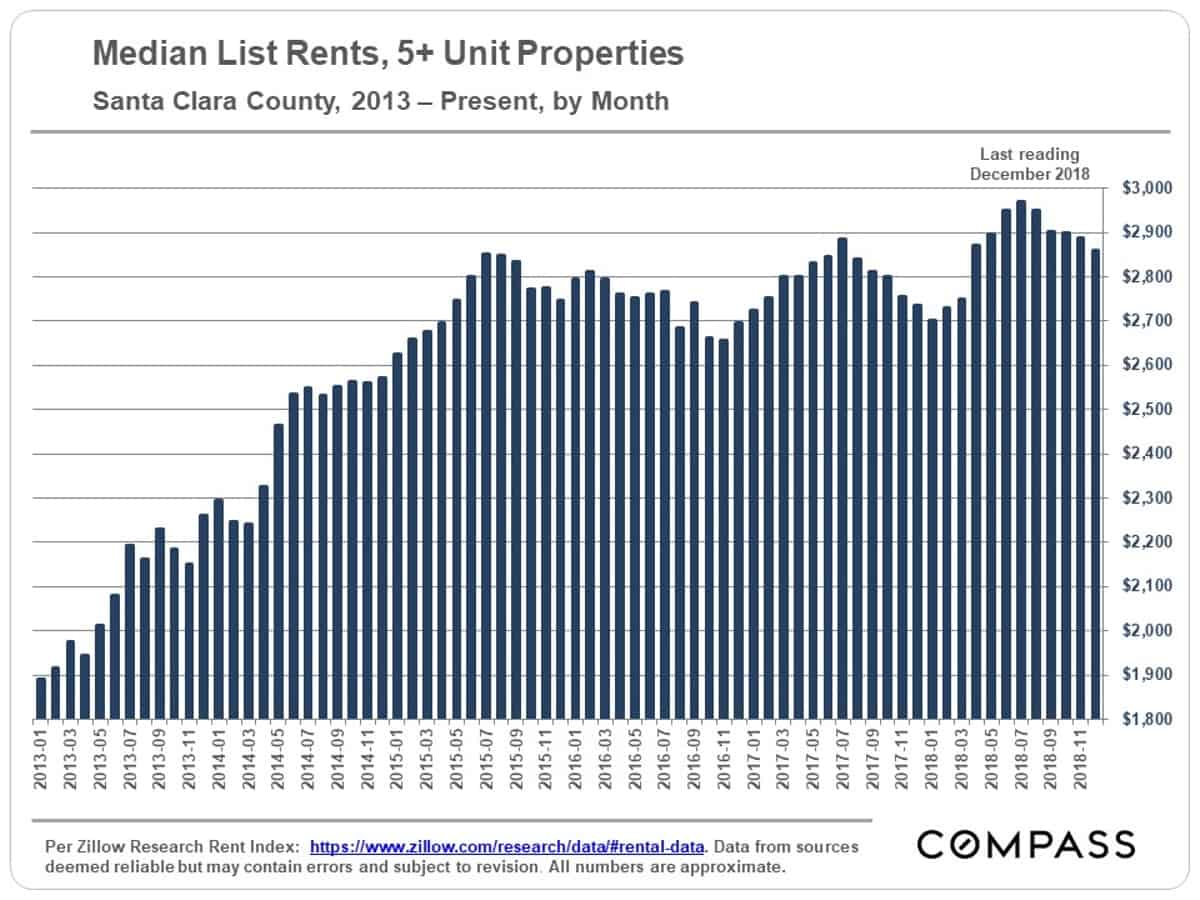
Rent Rate Appreciation since 2013
Generally speaking, there should be a relatively close correlation between home prices and rents: They constitute the 2 main options for paying for one’s housing. It is not an apples-to-apples comparison, because there are other issues at play, such as building home equity, the ability to remodel and improve, certain tax benefits (though diminished by recent tax law changes), and so forth. Still, if one rises and the other does not, most economists would suggest an imbalance in the market that will probably be corrected sooner or later.
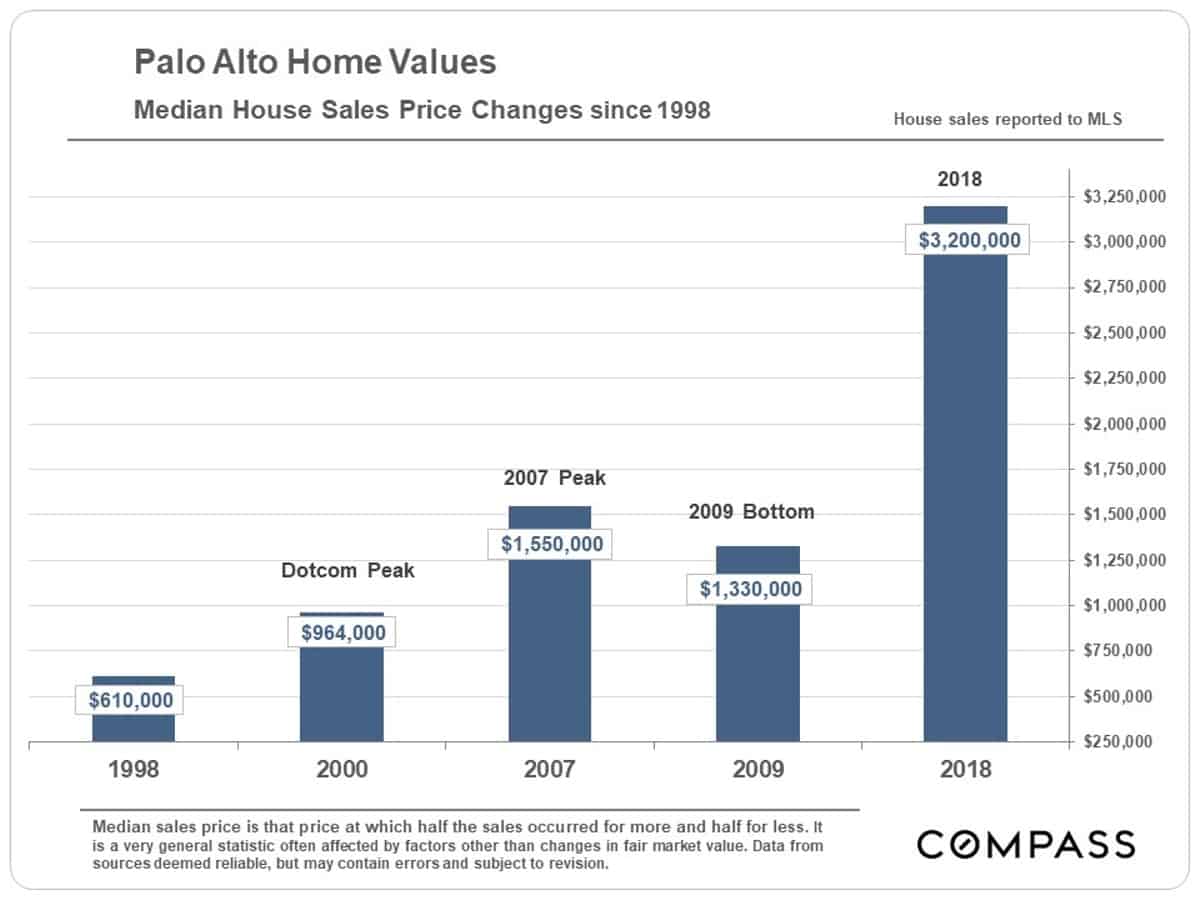
City Snapshot: Palo Alto
Few cities anywhere have seen the extreme rate of appreciation since the market’s post-financial-crash bottom that has occurred in Palo Alto.
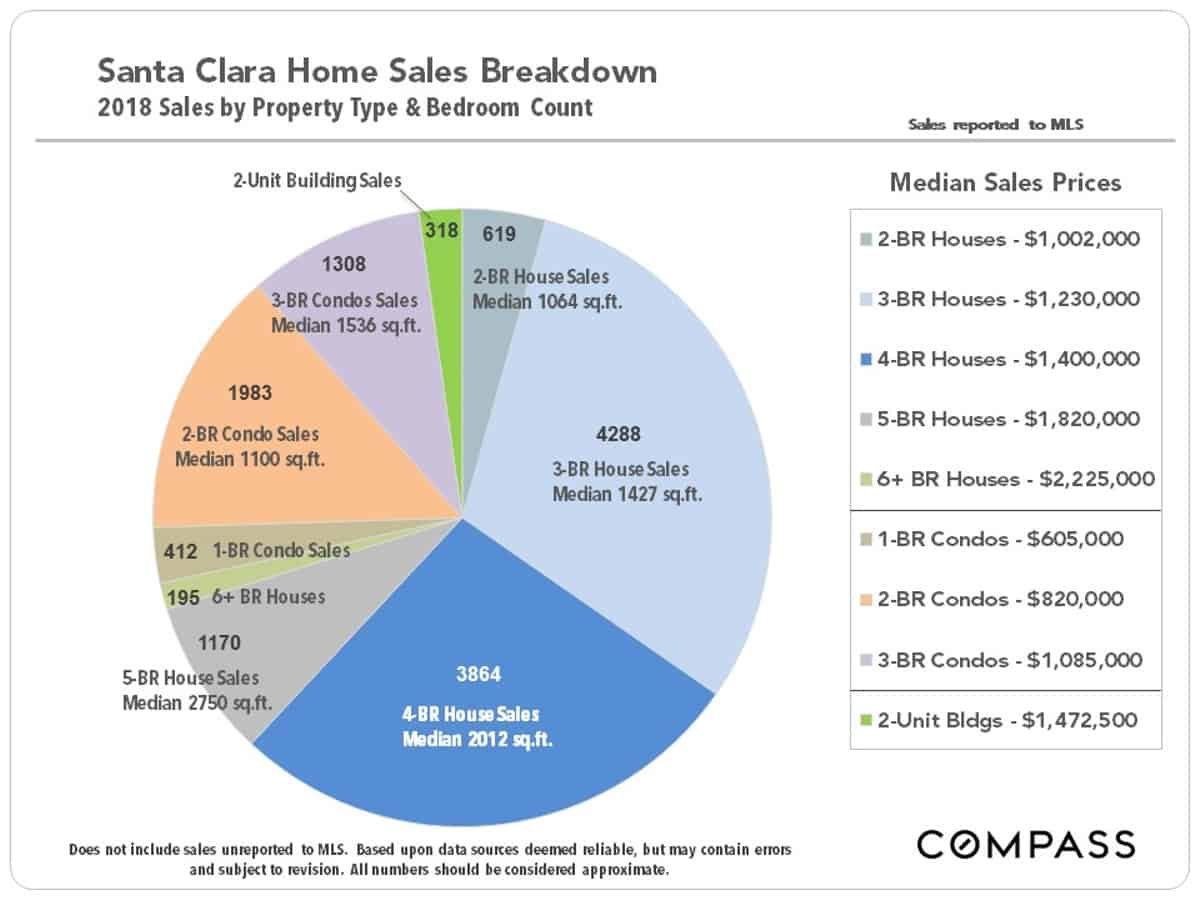
3 & 4 bedroom house sales dominate the Santa Clara County market. As an interesting point of context, in San Francisco, the most common sale is of a 2-bedroom condo.
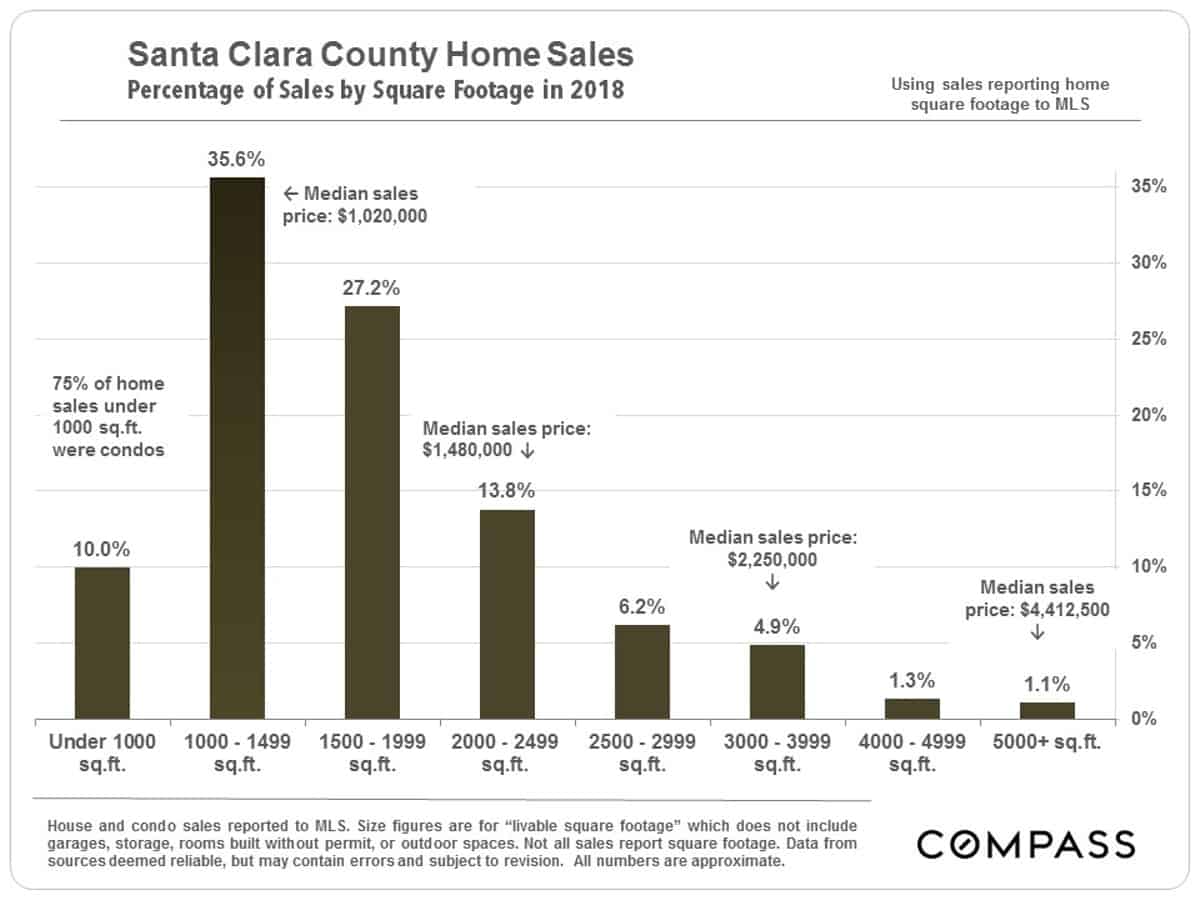
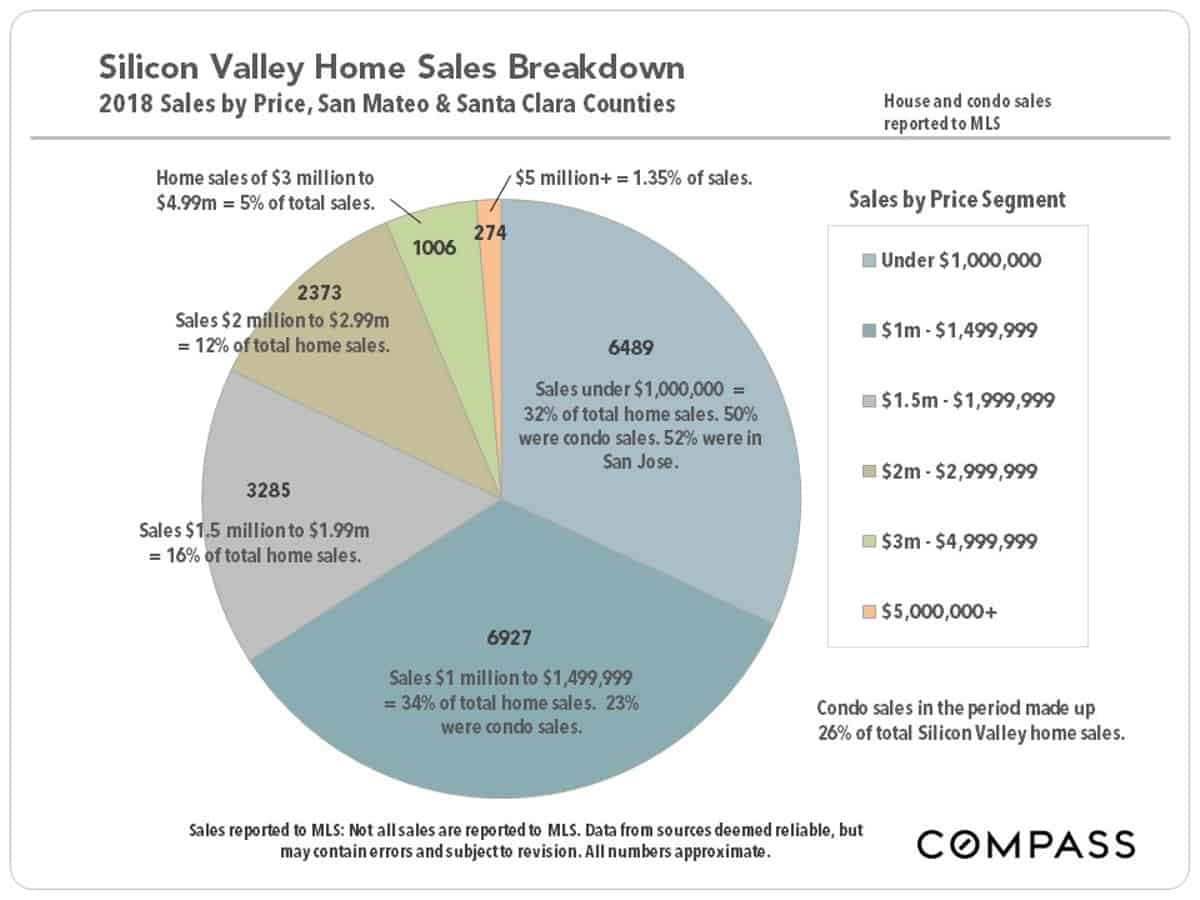
Since 2012, the percentage of home sales under $1 million have steadily dropped as prices have migrated higher. In sheer number of sales, Silicon Valley is dominated by the San Jose market – which also contains many of its more affordable neighborhoods.
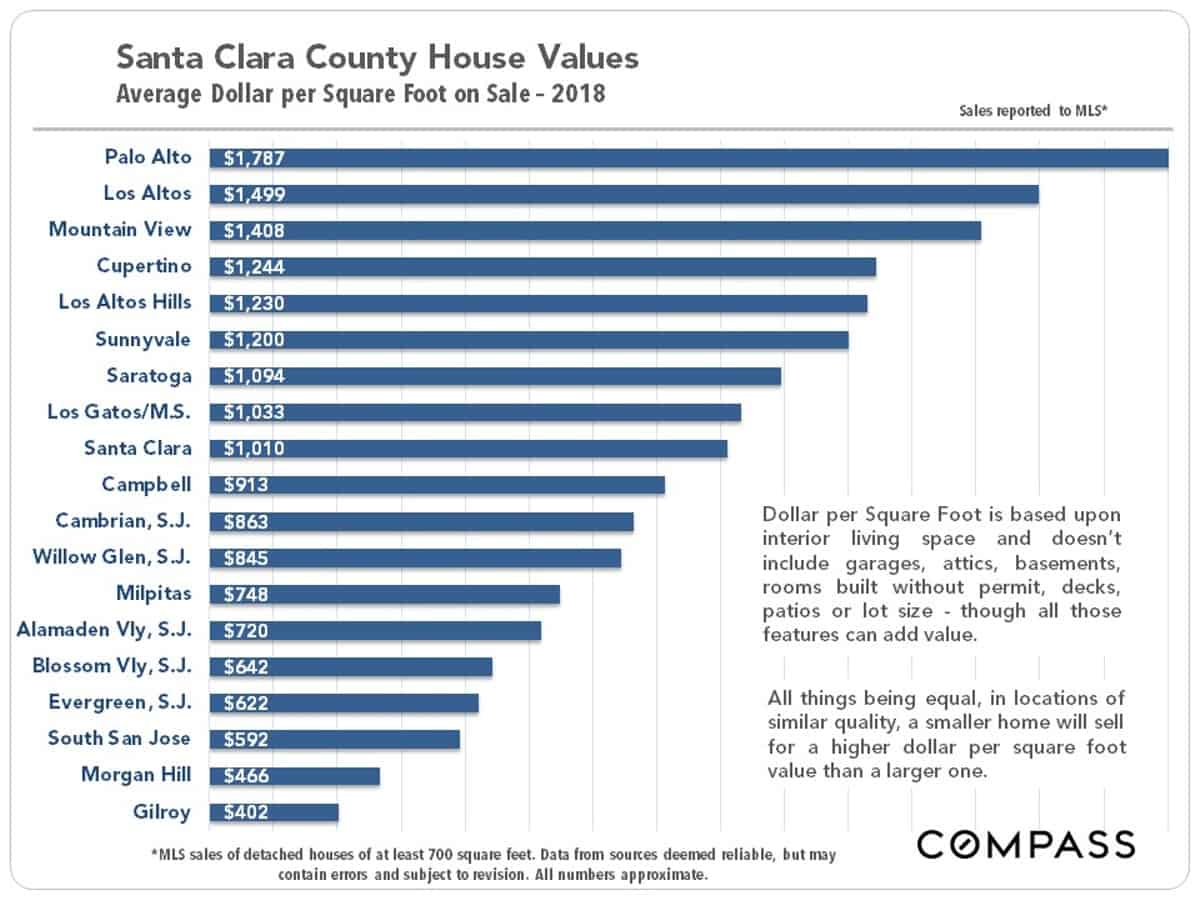
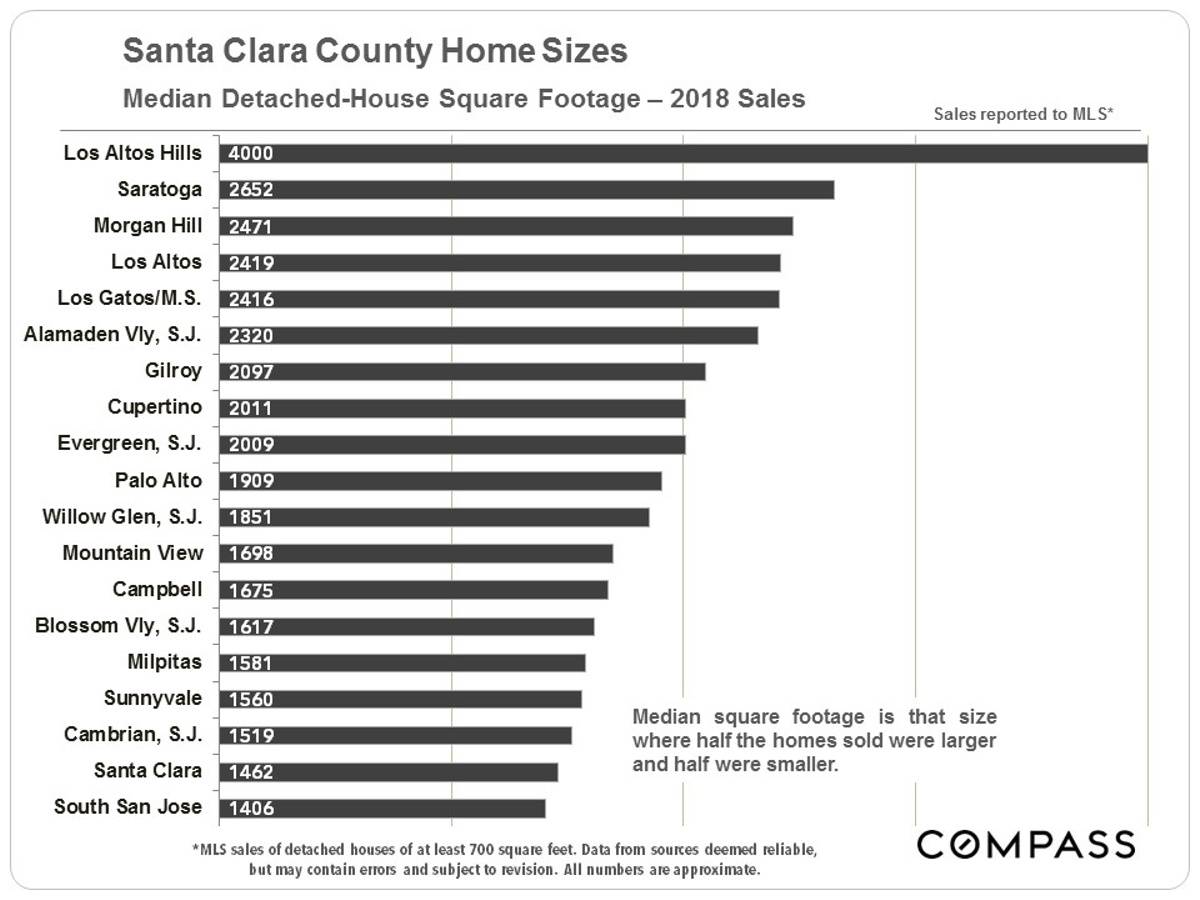
Median Price, Average Dollar per Square Foot & Median Size, by City
City values are influenced by many factors, including location, of course, but median home size is another basic consideration. And this varies widely between communities, as illustrated in the third chart below.

All things being equal – especially in general quality of location – a smaller home will sell for a lower price, naturally, but at a higher dollar per square foot value. This is one factor in the extremely high average $/sq.ft. values seen in Palo Alto – the highest of any city in the Bay Area.
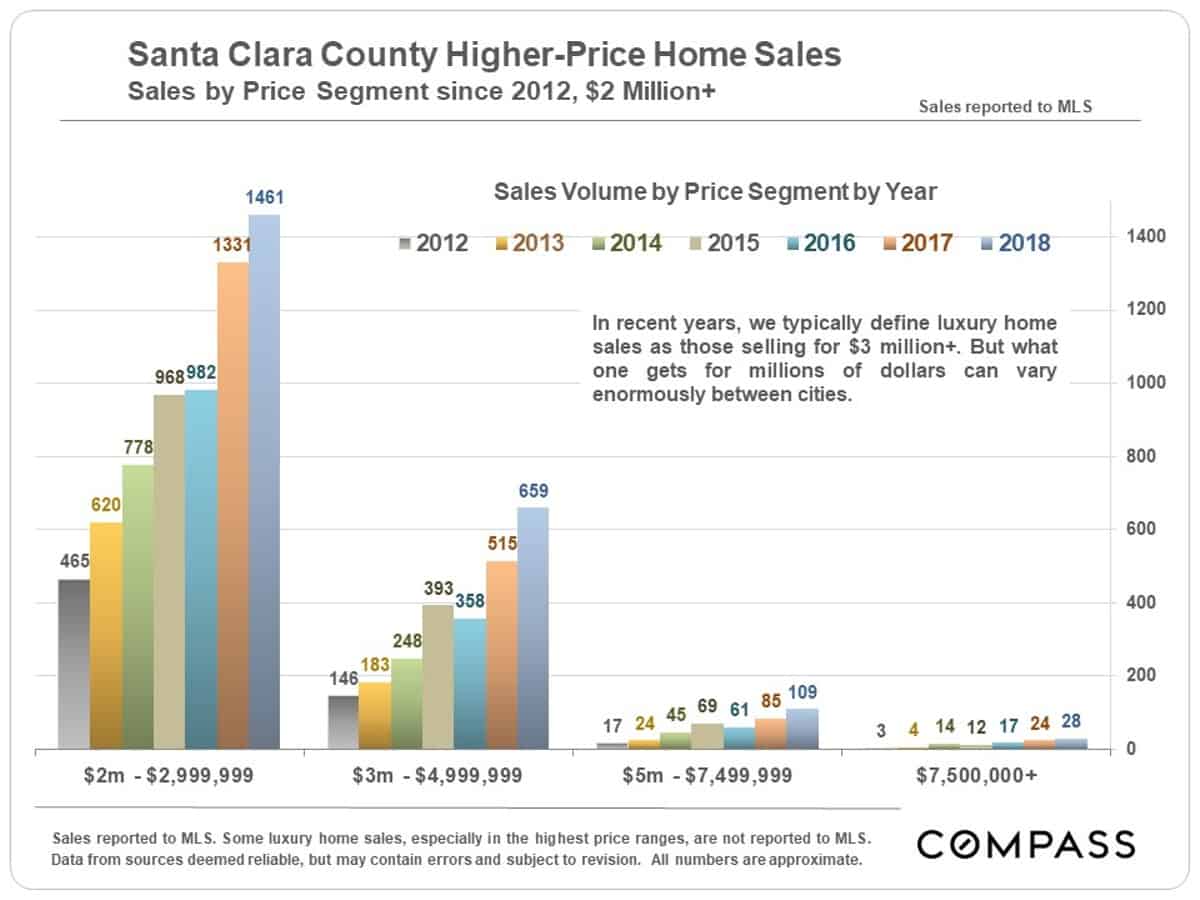
Higher Price Homes Sales since 2012
New highs in sales volume occurred across the spectrum of higher-priced homes in 2018, but it was caused by a huge spike in sales in Q2: Sales in Q3 and Q4 actually dropped on a year-over-year basis. The second quarter is usually the most active of the year for luxury sales, seeing the highest buyer demand and most competitive market conditions. The question now is: What will we see in spring 2019?
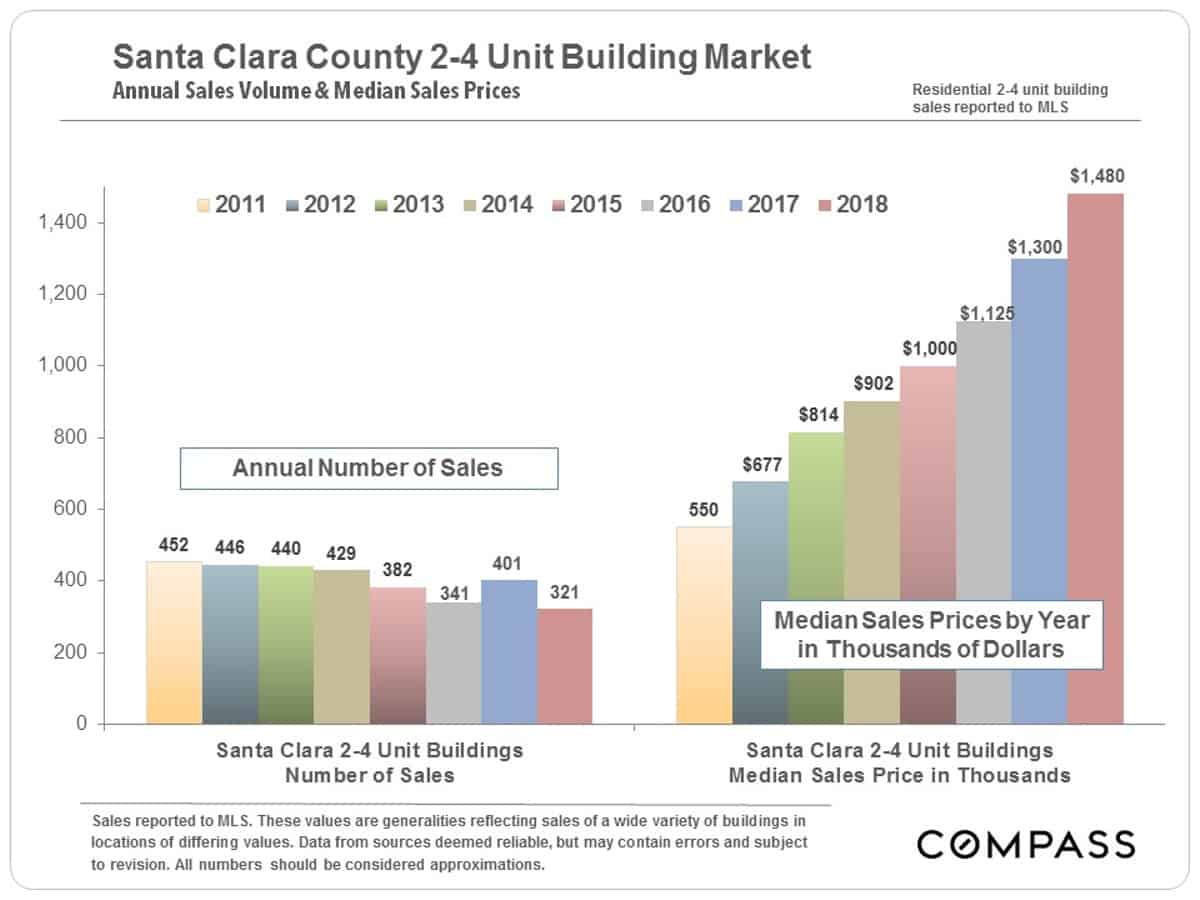
The 2-4 Unit Building Market
The residential investment market of 2-4 unit buildings has seen a similar appreciation trend as that of homes.
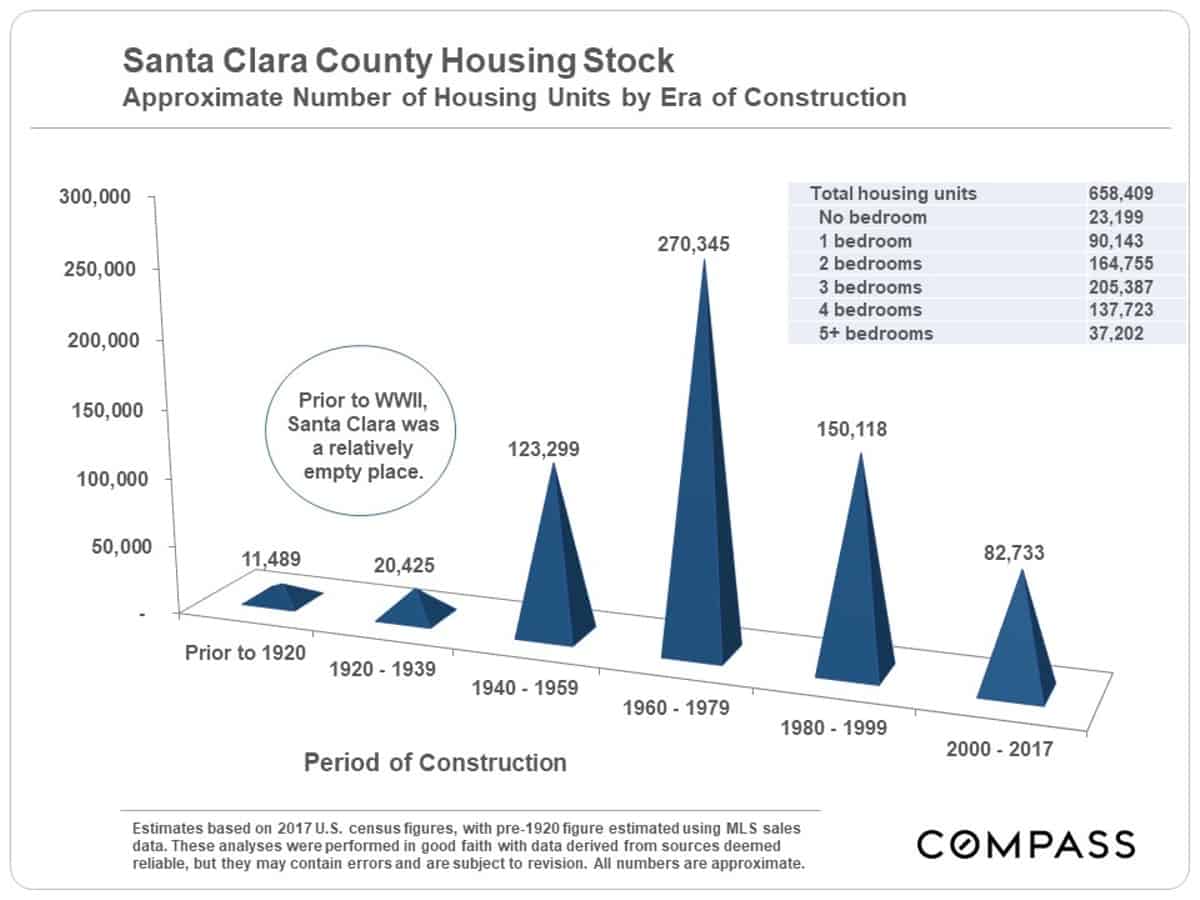
Era of Construction
In San Francisco, almost half of its housing units were built prior to WWII, while Santa Clara remained virtually empty. The biggest boom in construction here occurred between 1960 and 1979.
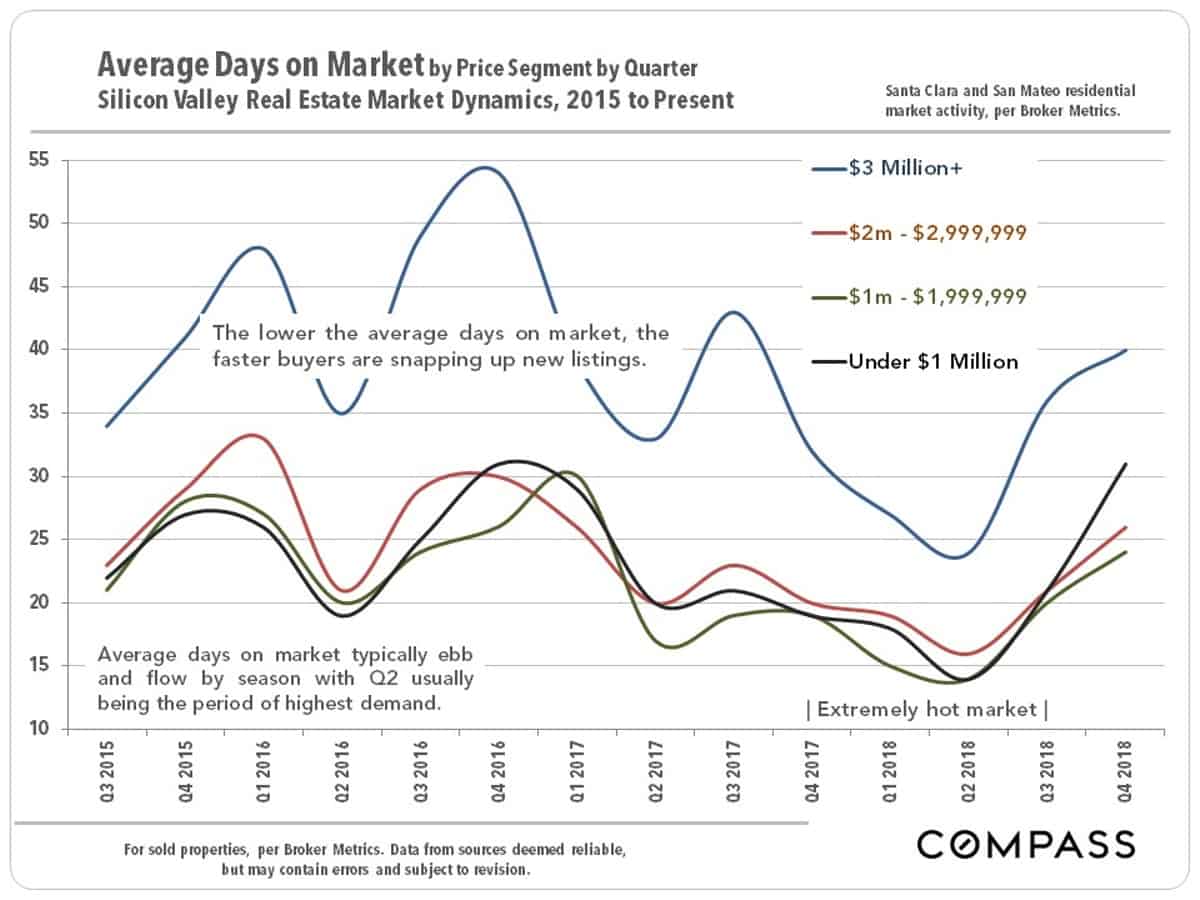
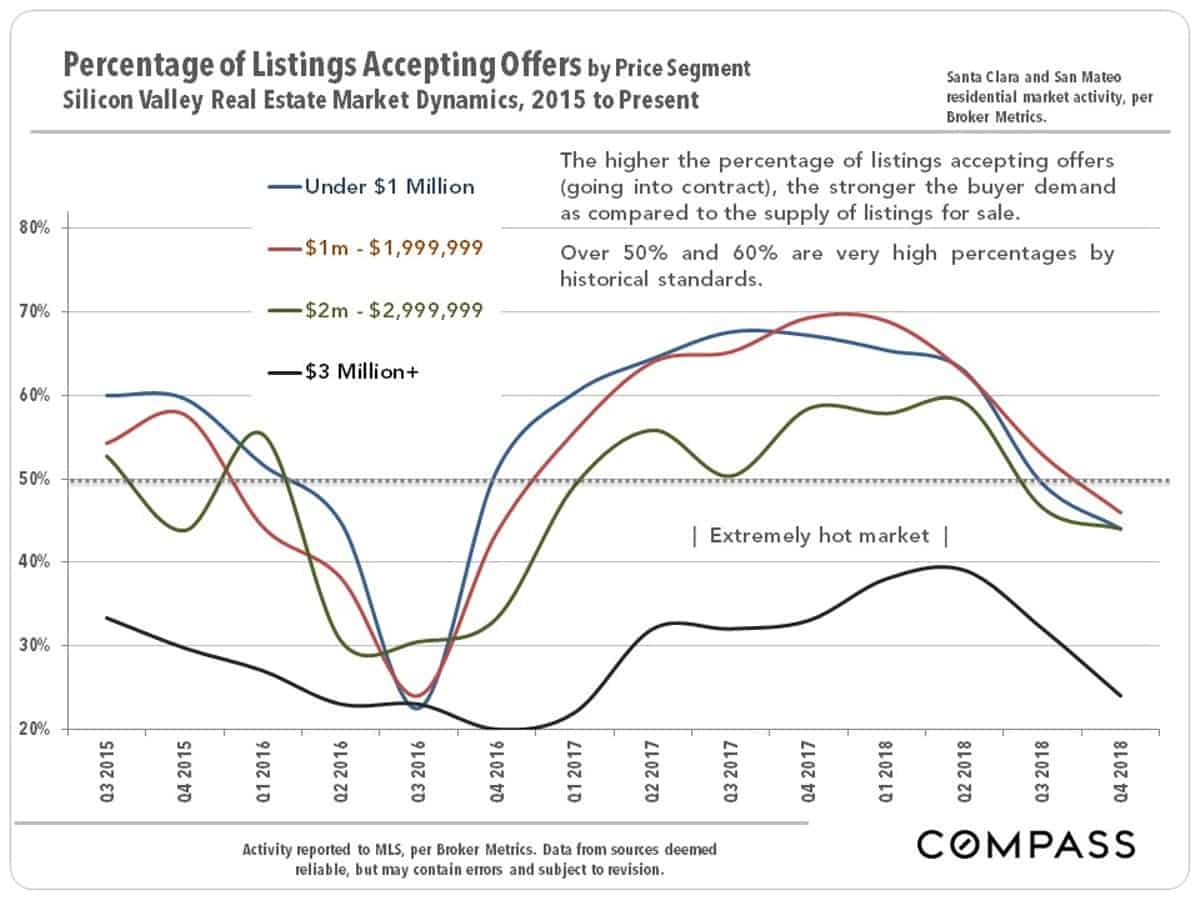
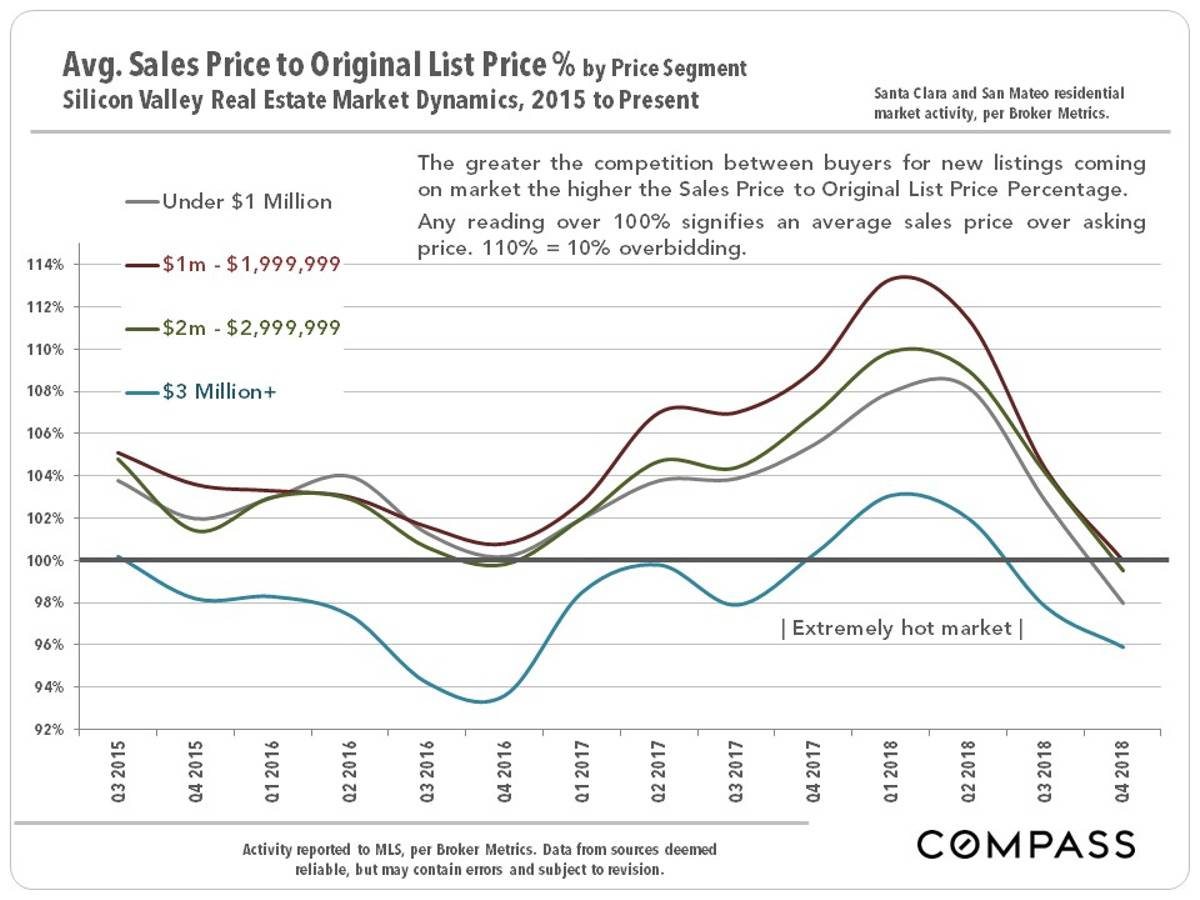
Market Indicators by Price Segment:
Santa Clara & San Mateo Counties
In recent years, market heat in Silicon Valley has divided to a large degree by price segment. As illustrated in the following 3 graphs, supply and demand dynamics have been similar for all price segments under $3 million, while the luxury home segment has been somewhat softer (which is not unusual). These charts also illustrate the extreme heat of the market at the end of 2017 through the first half of 2018, and the cooling that occurred in the second half. Q2 is typically the highest demand quarter of the year, which we will be entering soon.
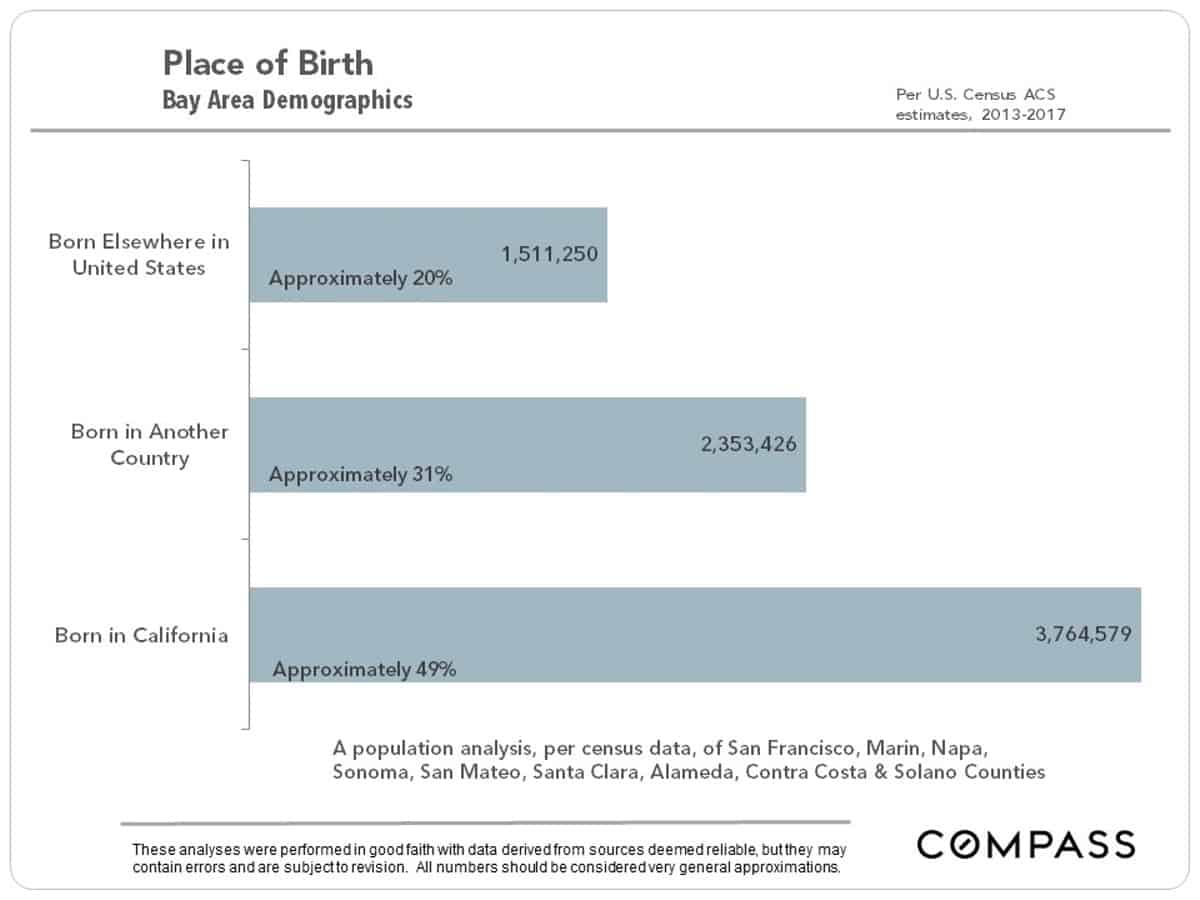
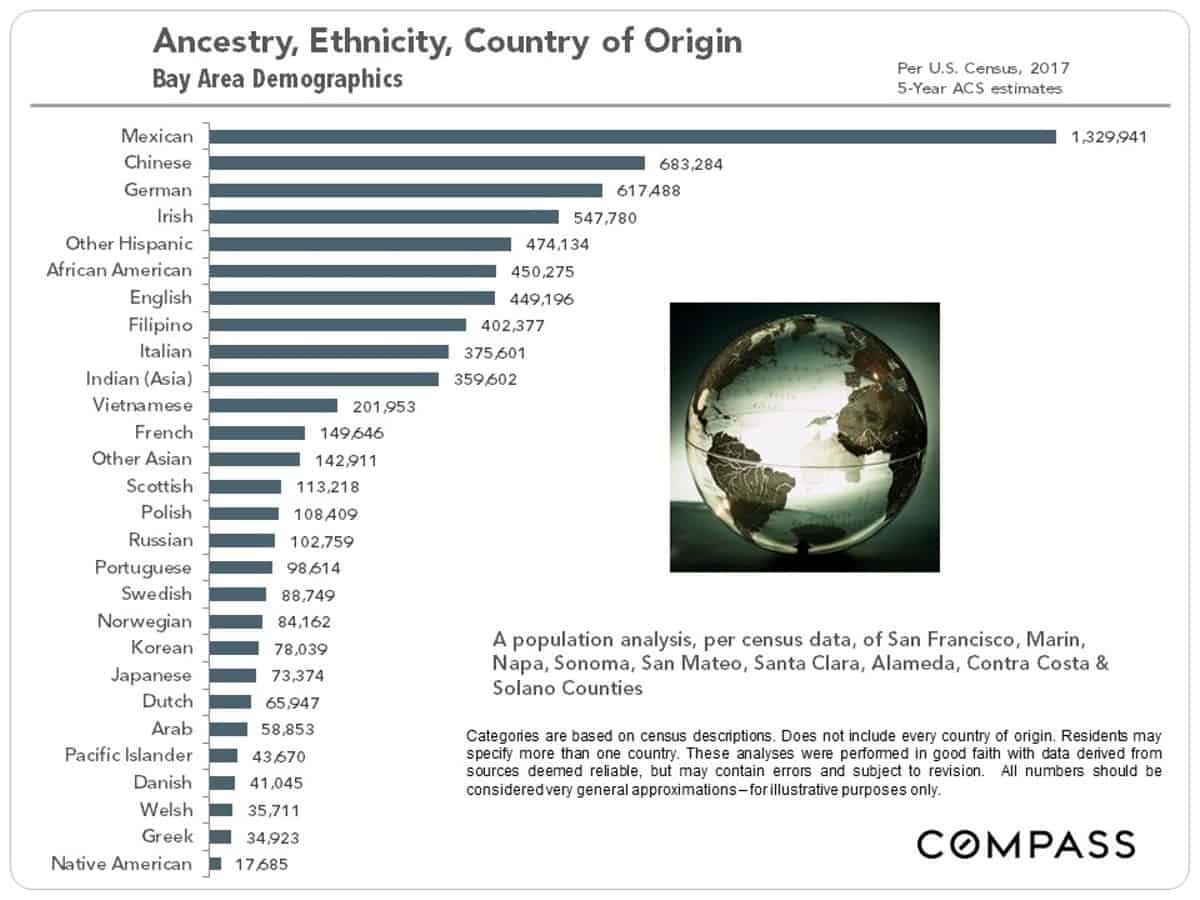
A Very Multi-Cultural Place –
Bay Area Demographics
Before looking at the charts below, here is the demographics quiz question for today: What 4 nationalities account for the origin of the highest numbers of Bay Area residents?
Stock Prices & Interest Rates
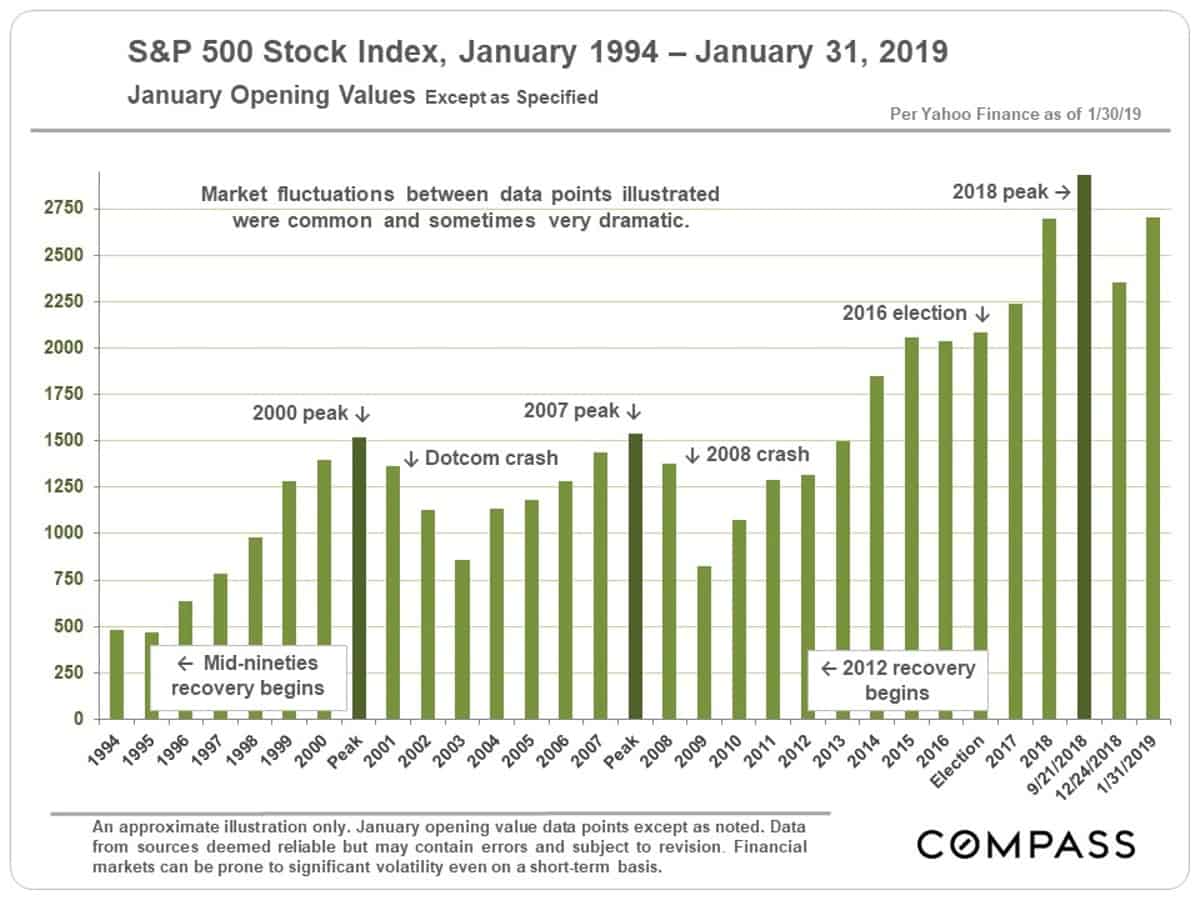
As seen in the next chart, the changes in the S&P 500 Index have been very dramatic since the 2016 election, seeing an enormous jump to its most recent peak in September 2018 before entering a period of substantial volatility. Ups and downs and major volatility in financial markets – and their effects on household wealth – can play a large role in local real estate markets, especially in the higher price segments.
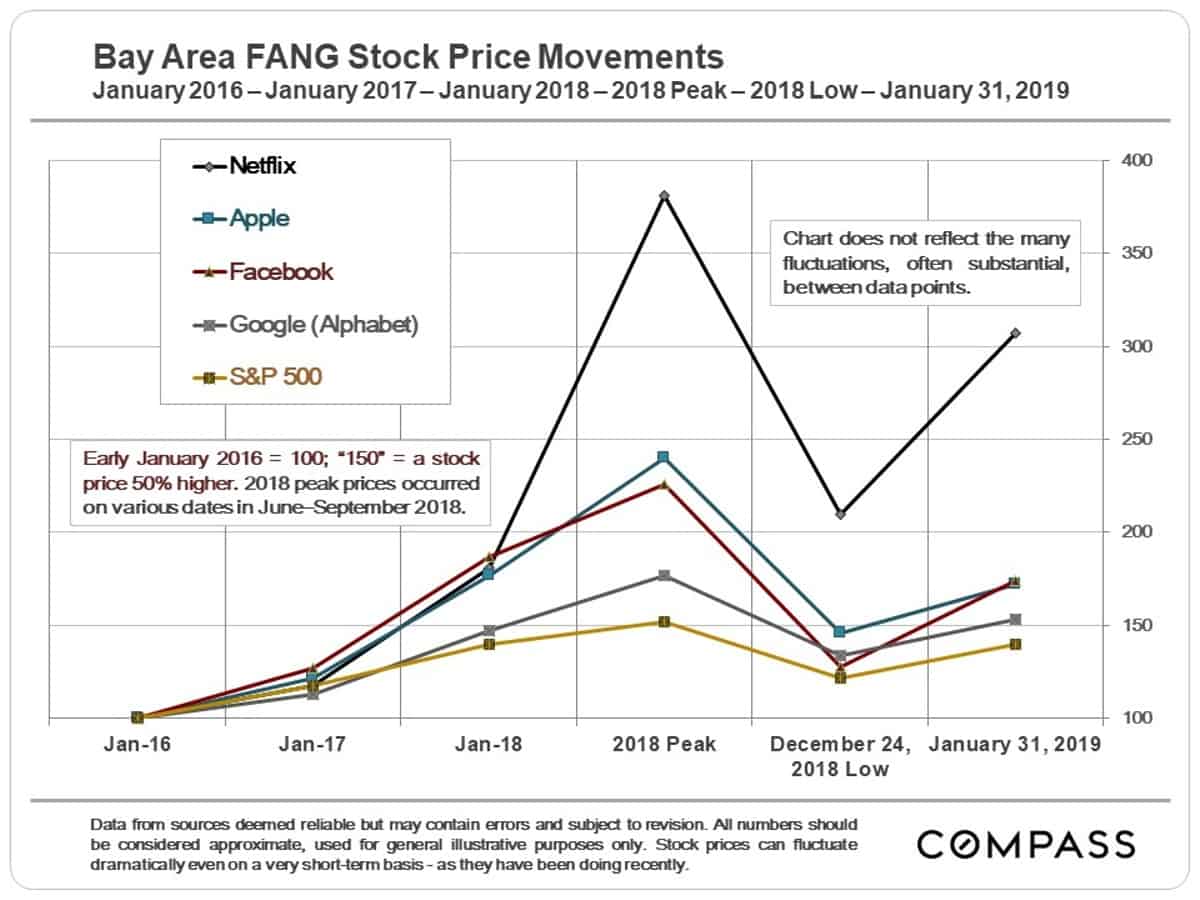
As illustrated below, the movements in the S&P 500 look distinctly modest compared to the stock price changes of some of our local high-tech giants. It has been has been a wild, queasy ride for investors and stock-owning employees – and for many home buyers.
If the big, Bay Area unicorn IPOs go forward as expected, and the market greets them enthusiastically, that could play a substantial role in demand as thousands of employees suddenly feel considerably more affluent.
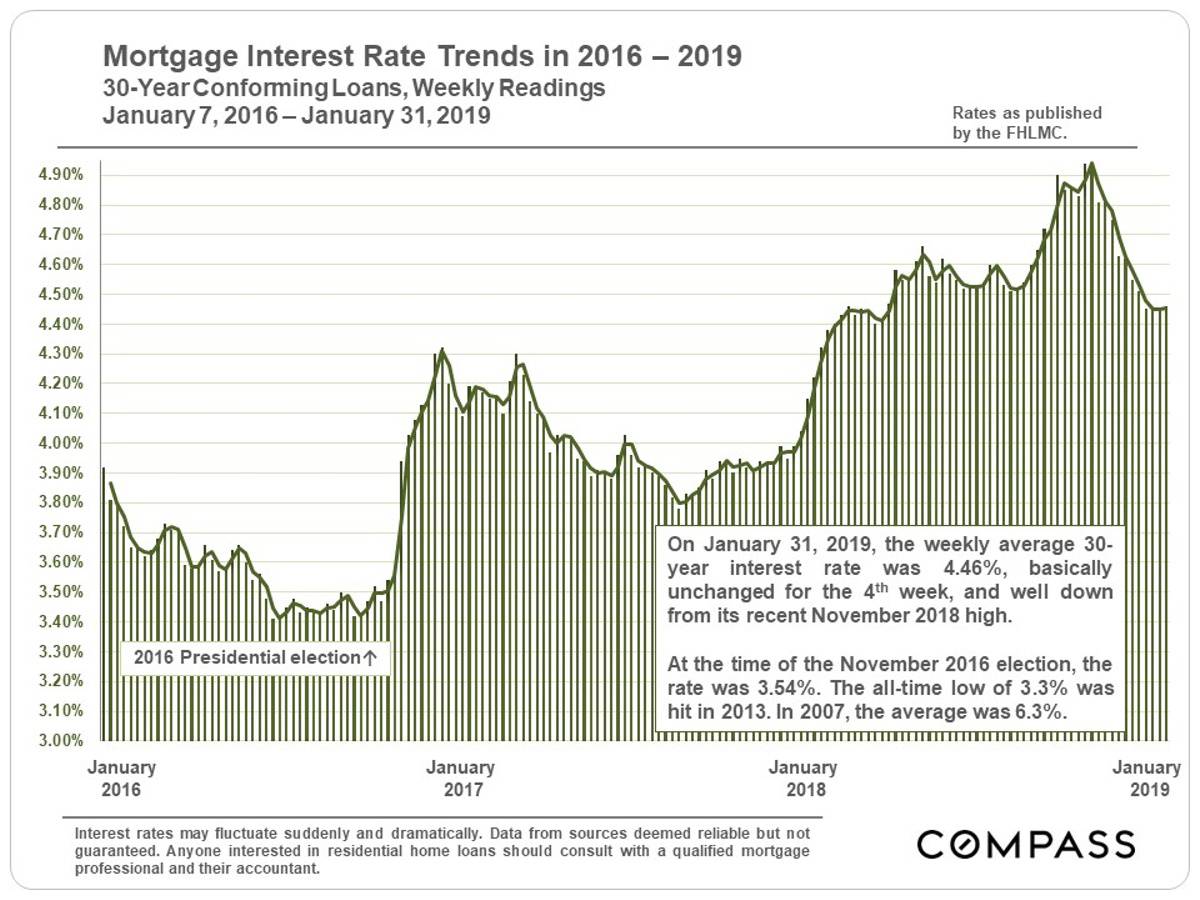
Interest rates are a major factor in housing costs and the ability to qualify for home loans. After hitting its most recent high in November, rates have dropped off considerably. Such declines sometimes spark renewed buyer motivation to move forward quickly. It is famously difficult to predict interest rate movements with any accuracy.