Santa Clara County April Real Estate Market Report

Santa Clara County Real Estate
Home Prices, Sales & Statistics; Stock Markets; Interest Rates and Unicorns
April 2019, Q1 Report
A substantial portion of Q1 statistics reflect new listings and accepted offers occurring during the mid-winter market doldrums (Thanksgiving to mid-January). In November and December 2018, the stock market plunged drastically from its all-time high in September, and interest rates hit their highest point in years: These factors negatively affected buyer demand. Then both turned in dramatically positive directions in early 2019. So, Q1 statistics reflect economic conditions in both Q4 2018 (very negative) and Q1 2019 (very positive). It is also the quarter with the lowest sales volume.
The spring selling season – whose data starts to show up in March, but is mostly reflected in Q2 – is the most active of the year. As always, there are many economic factors at play impacting Bay Area markets, some of which are discussed below.
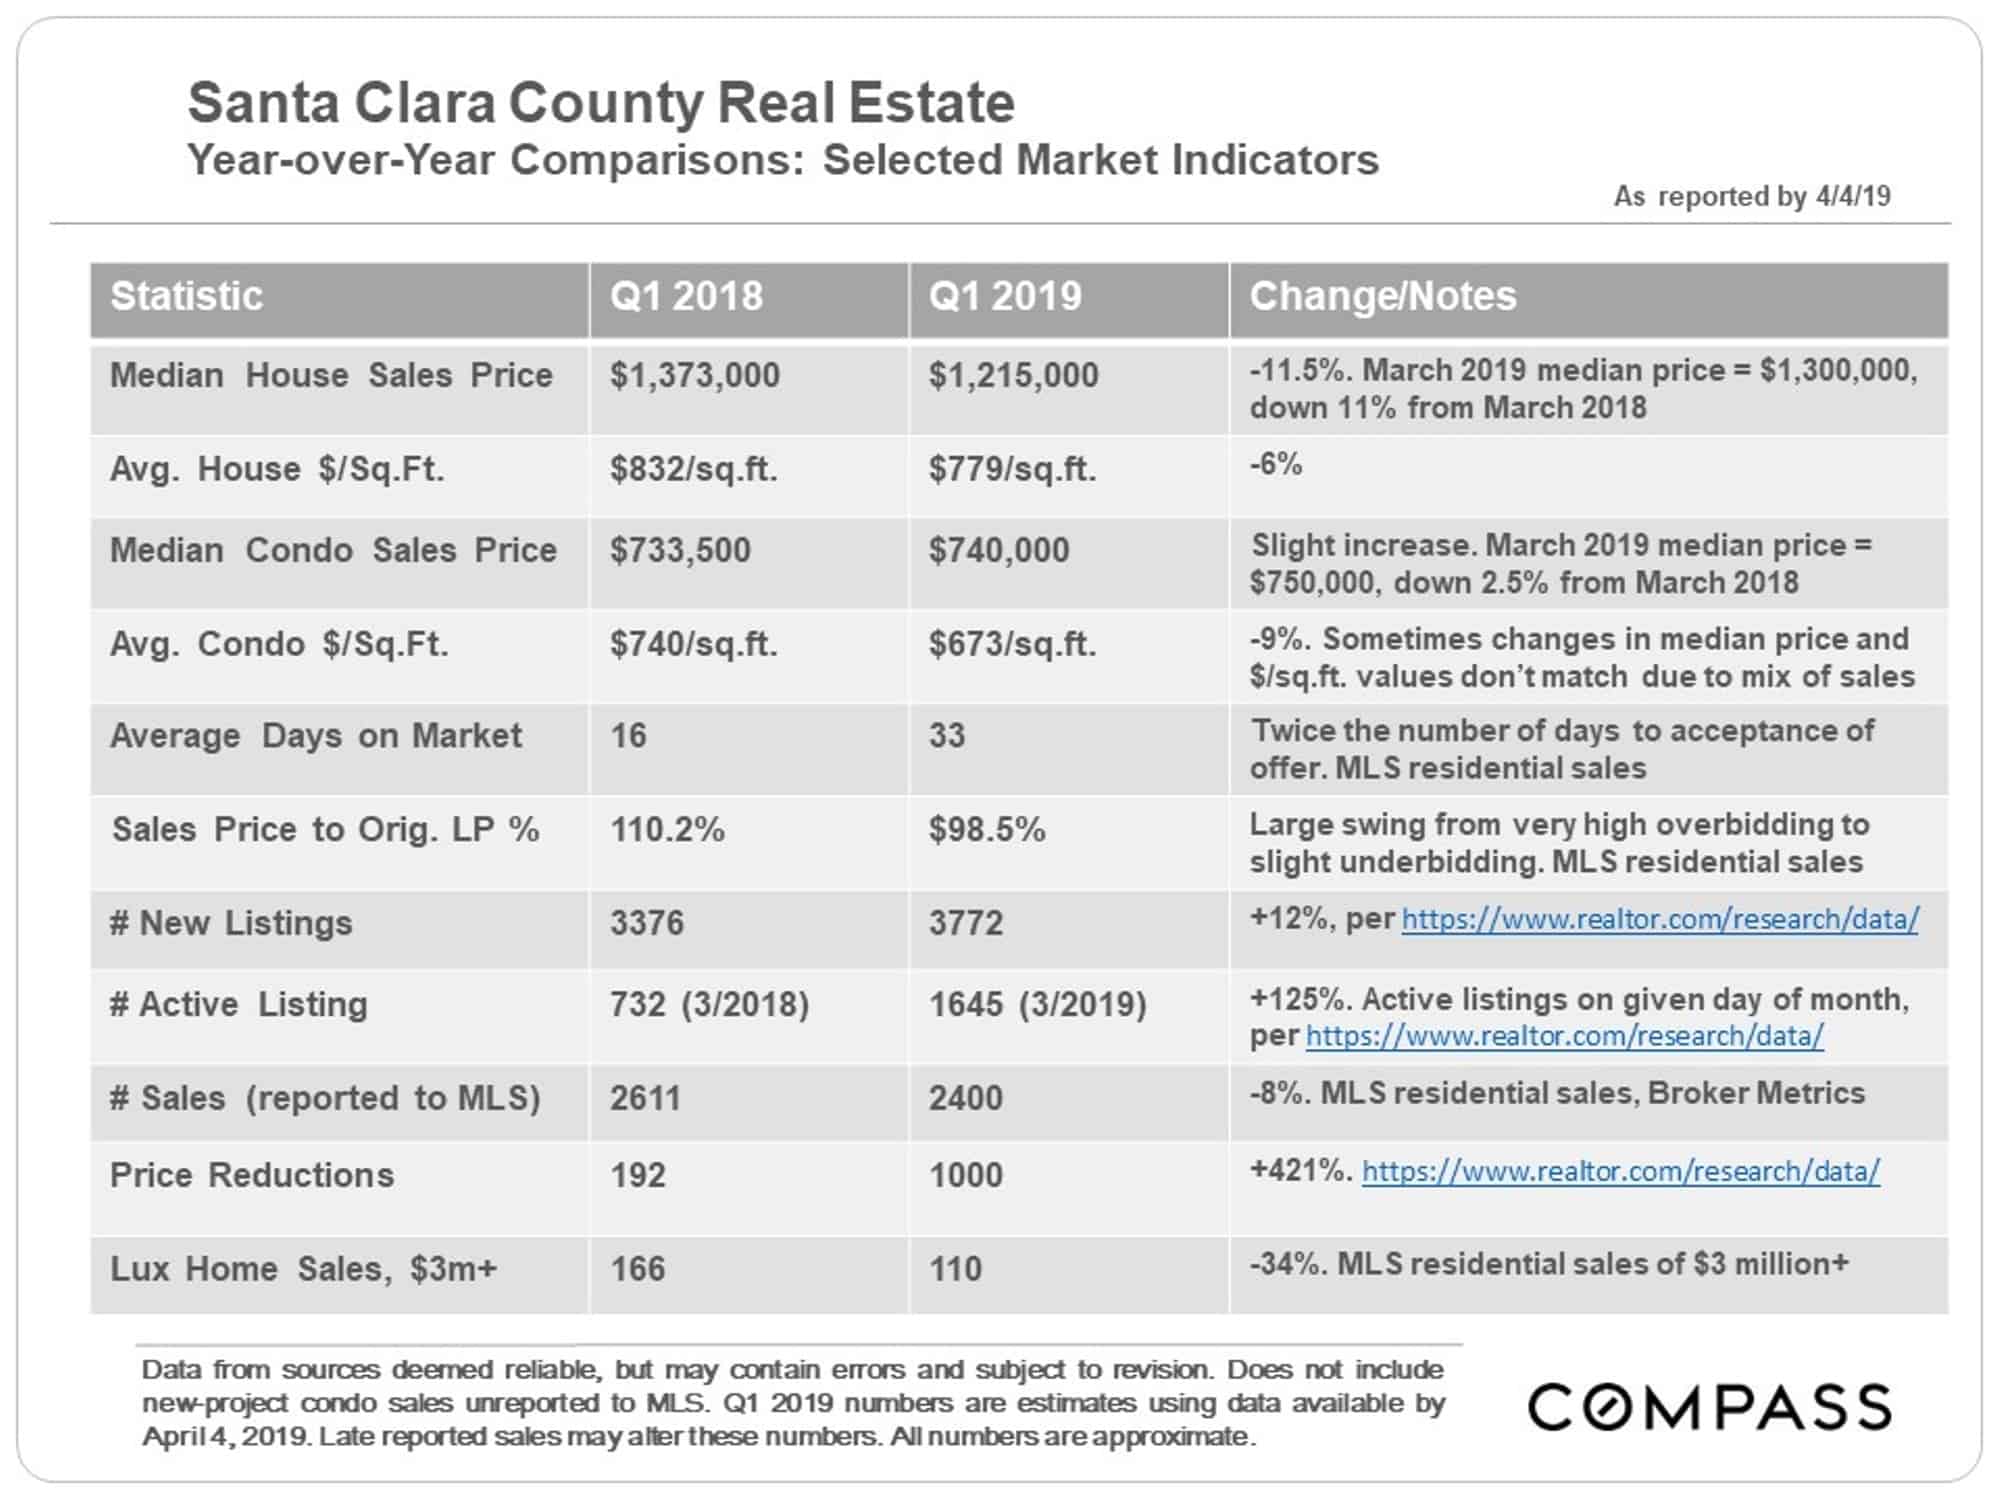
Year-over-Year & Long-Term Trends
Santa Clara County may have been the hottest major market in the country from the second half of 2017 through the first half of 2018. However, since then, its market has cooled the most of all the Bay Area counties.
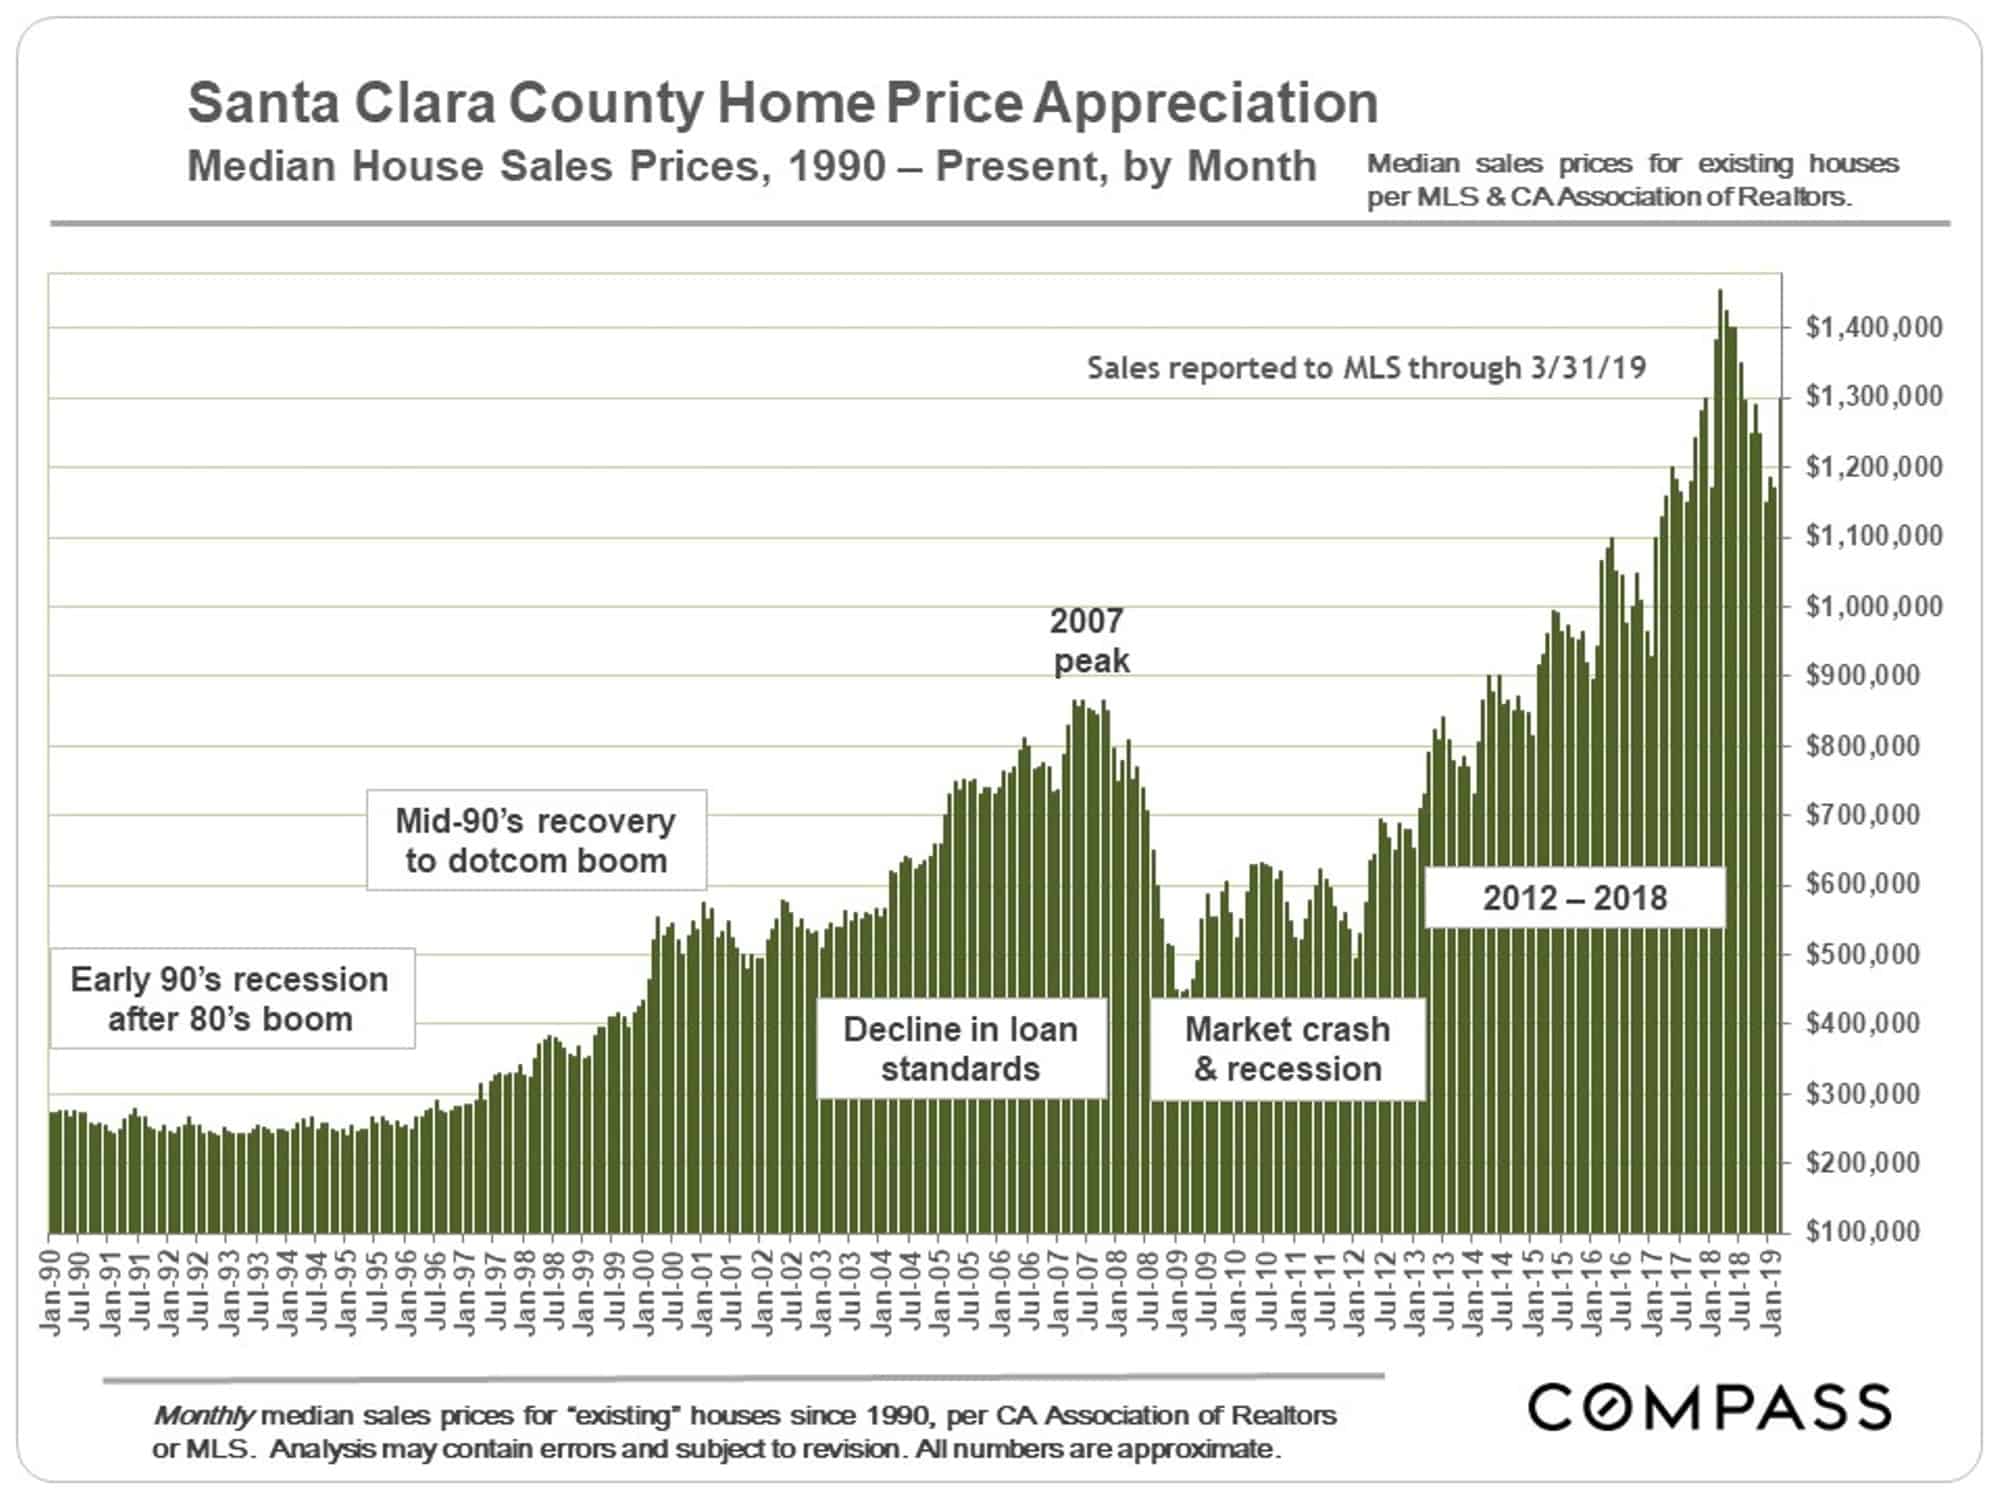
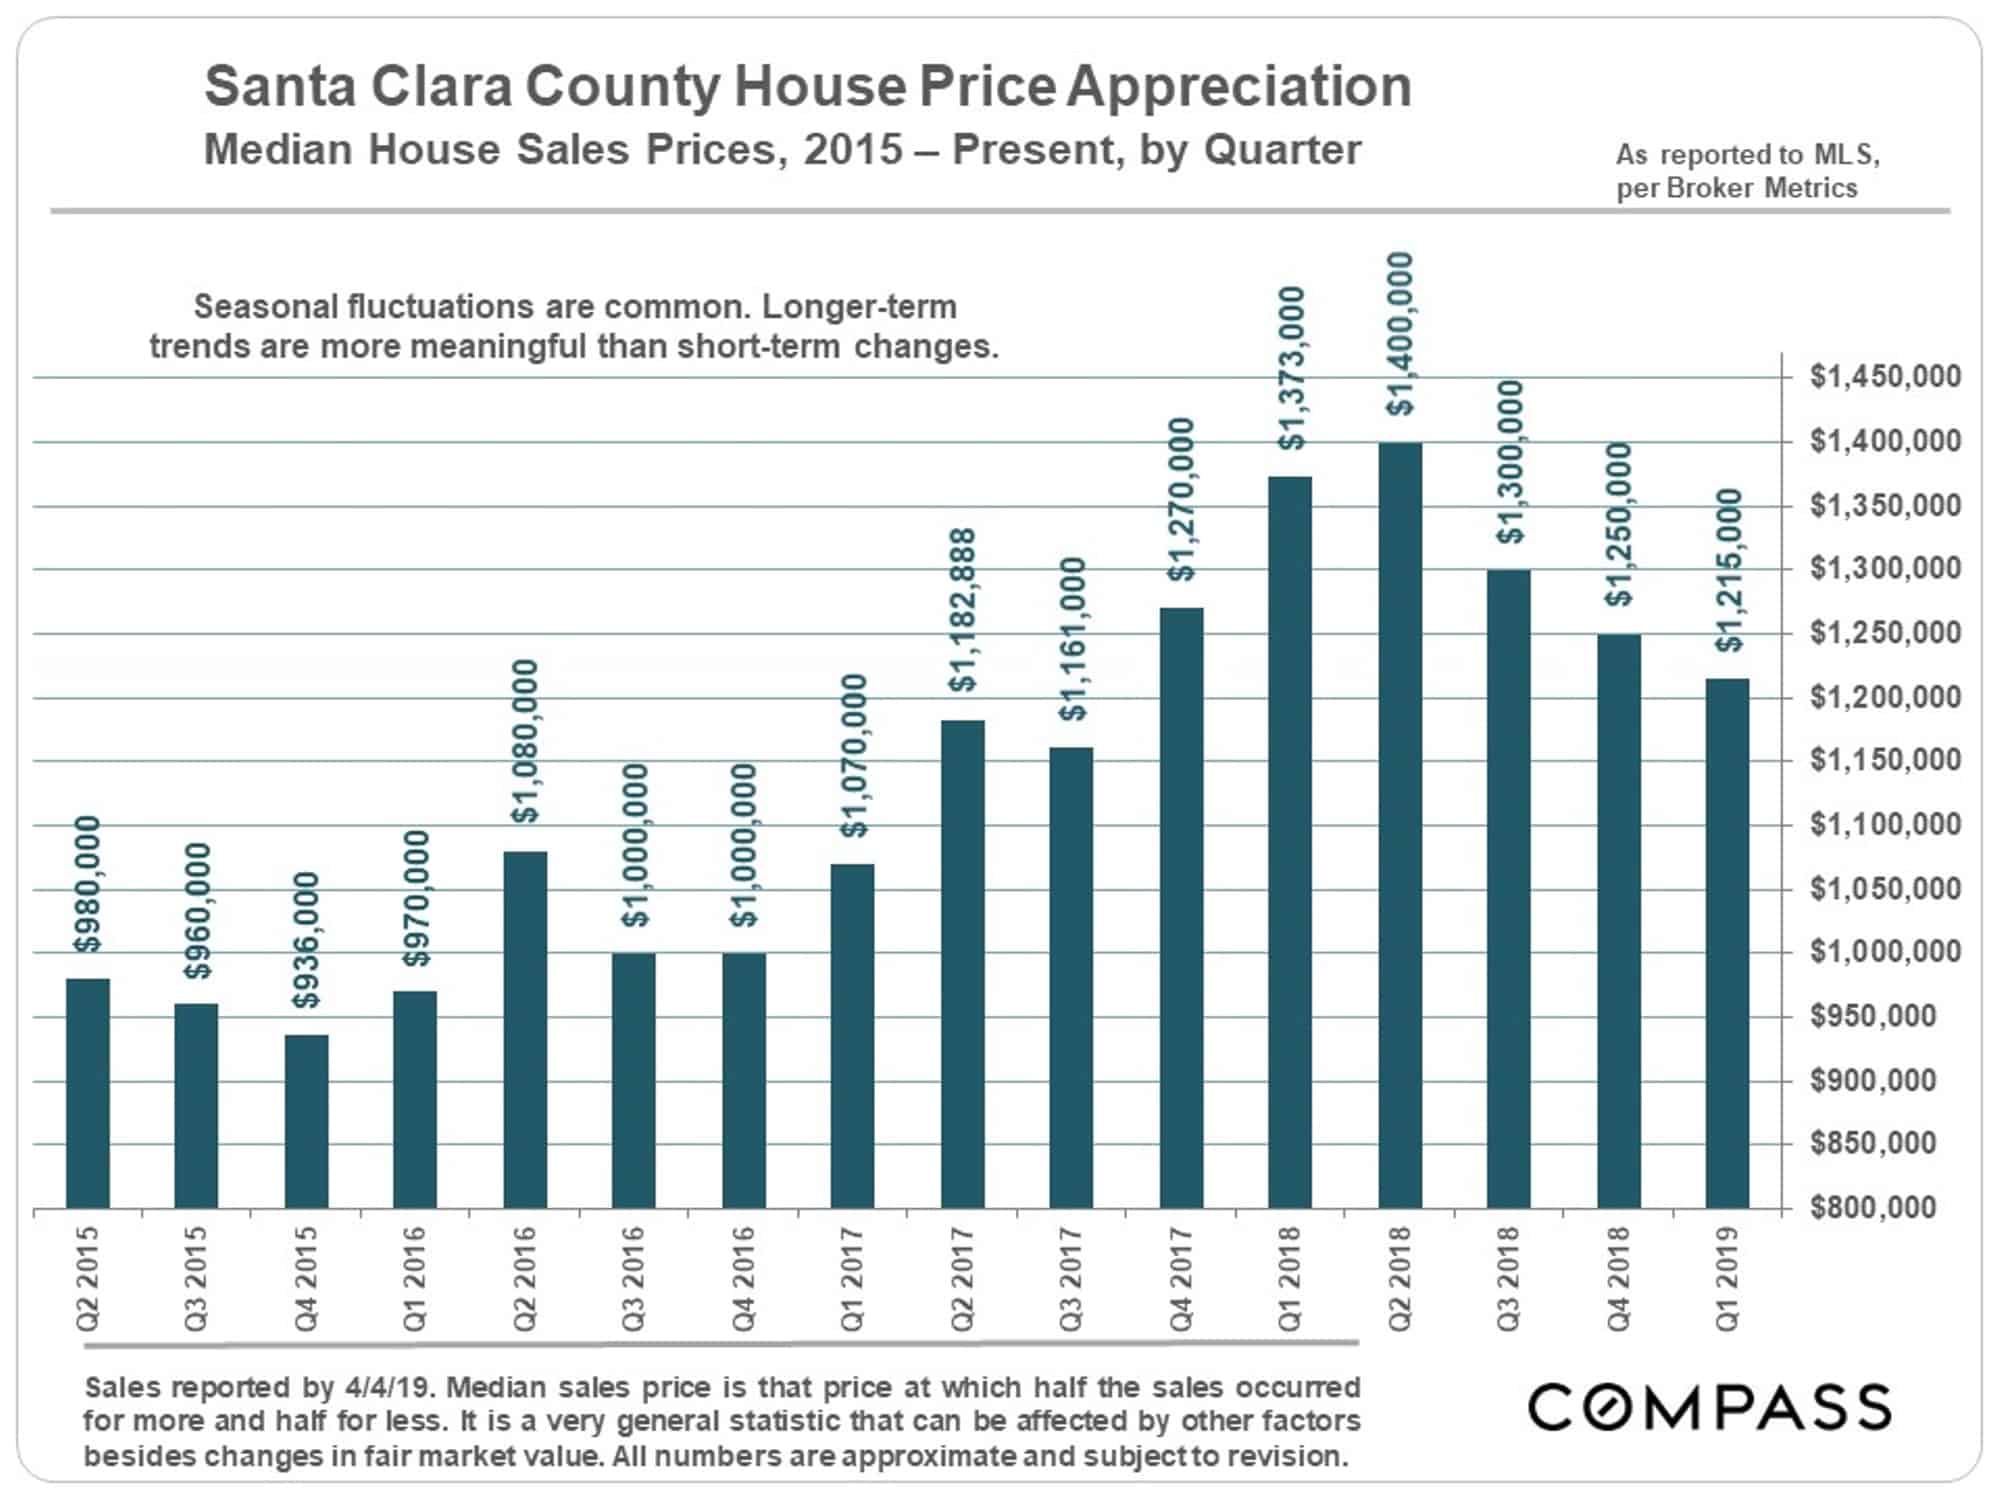
Median Sales Price Trends
Long-Term Trend by Month
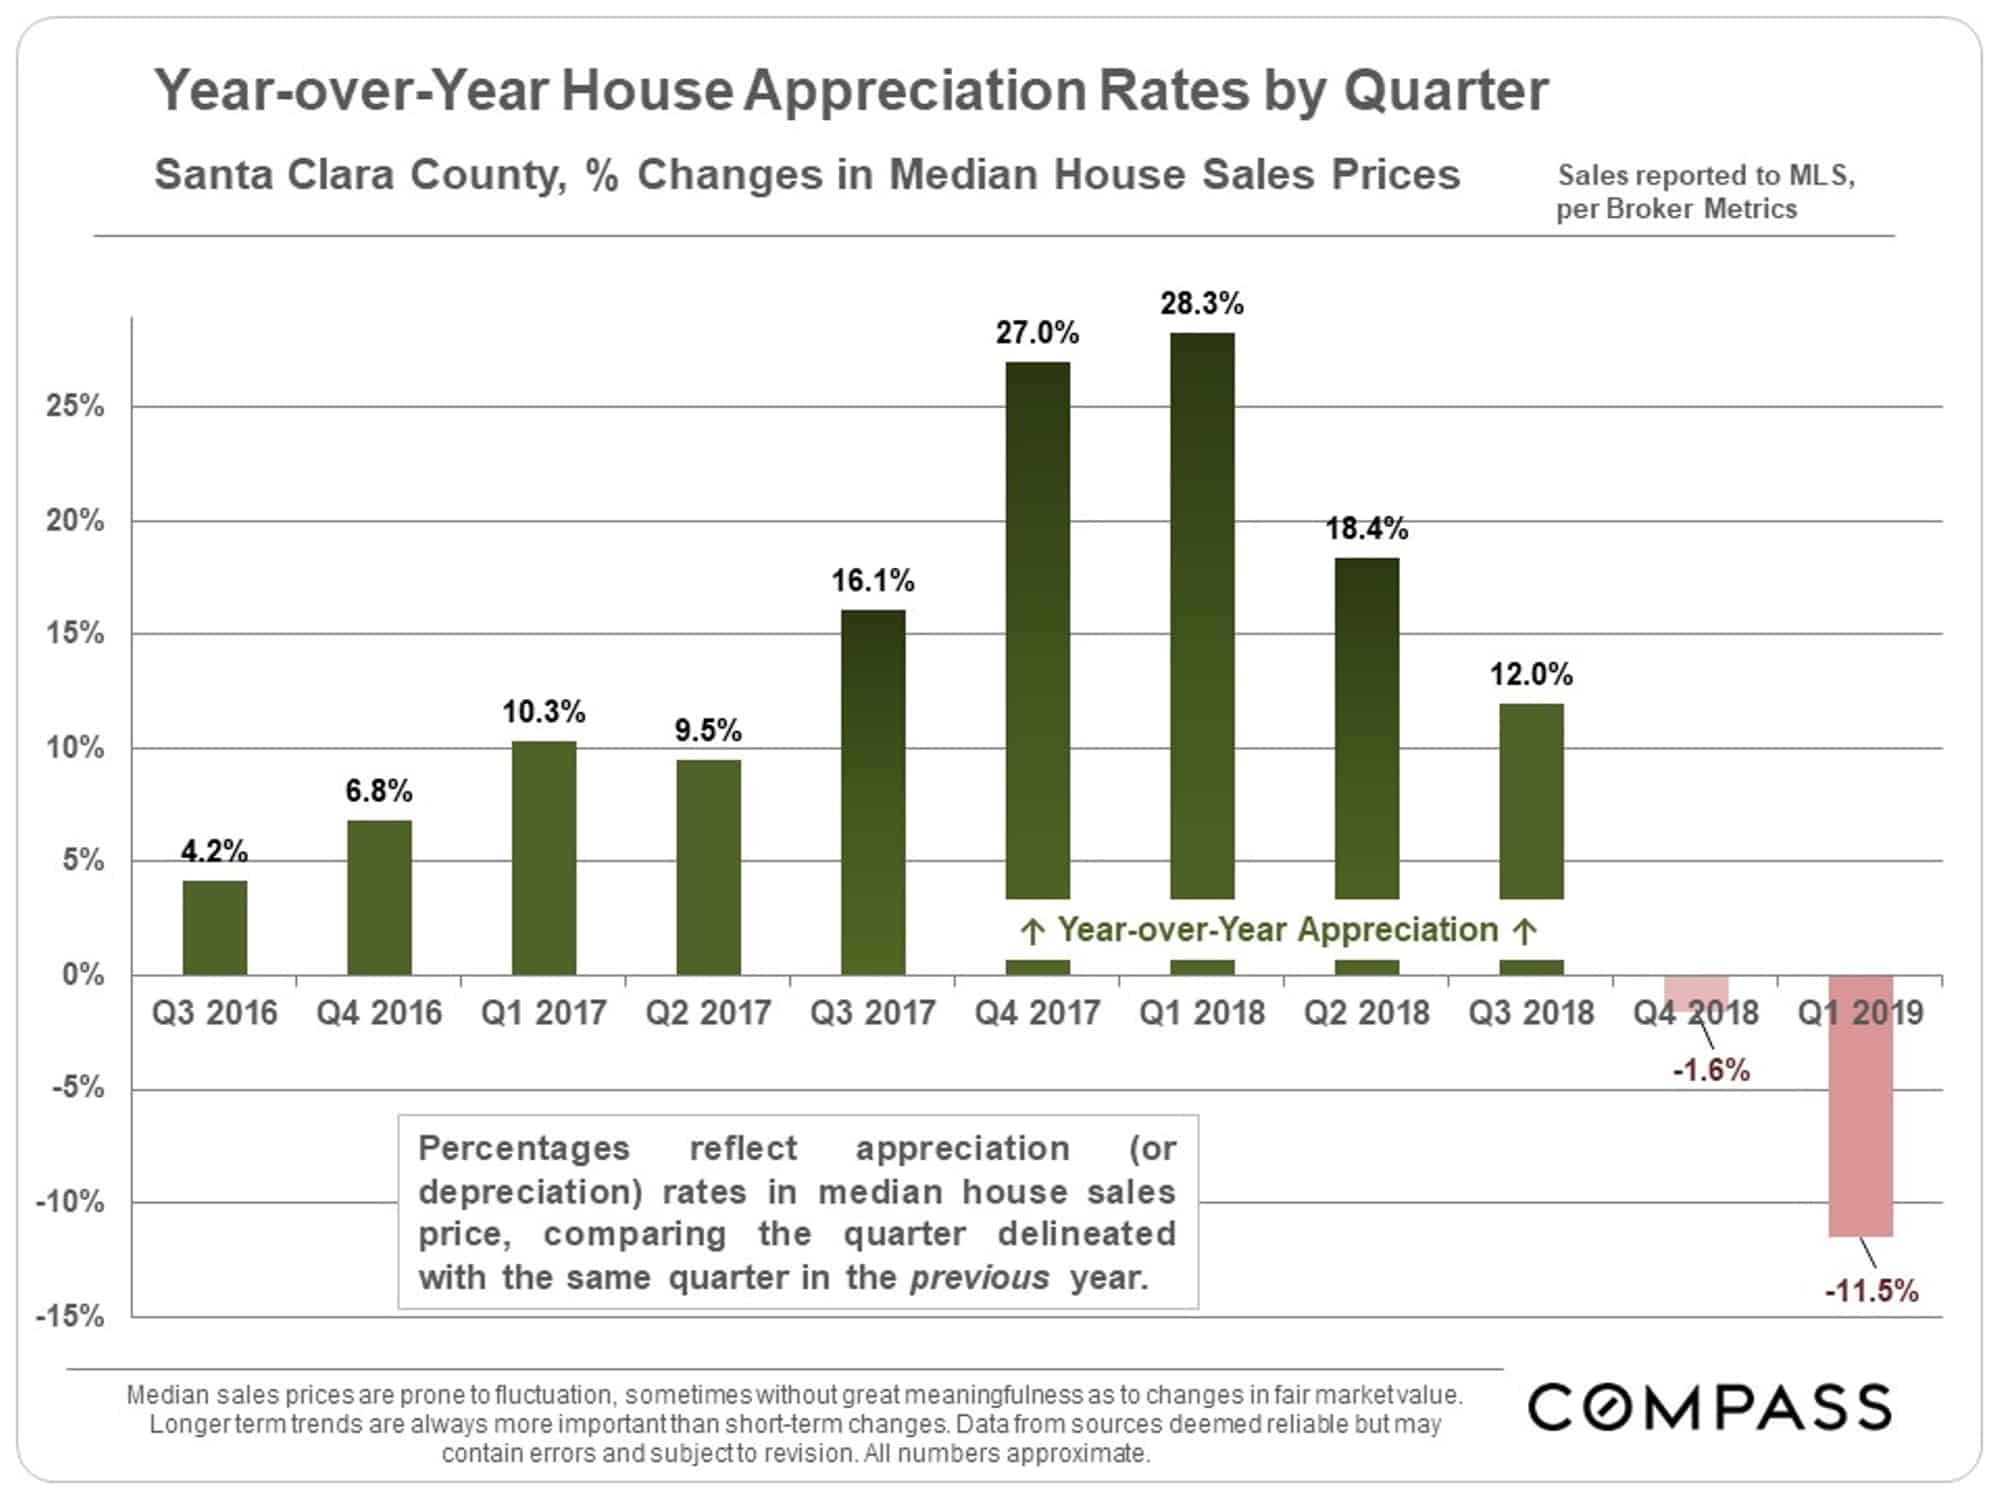
Shorter-Term Trend by Quarter
Quarterly year-over-year median house sales price appreciation rates went from 28.3% in Q1 2018 (over Q1 2017) – an incredibly high rate – to a negative, 11.5% decline in Q1 2019 (compared to Q1 2018). What occurs in Q2, just started and usually the most active selling season of the year, will be critical as to market direction.
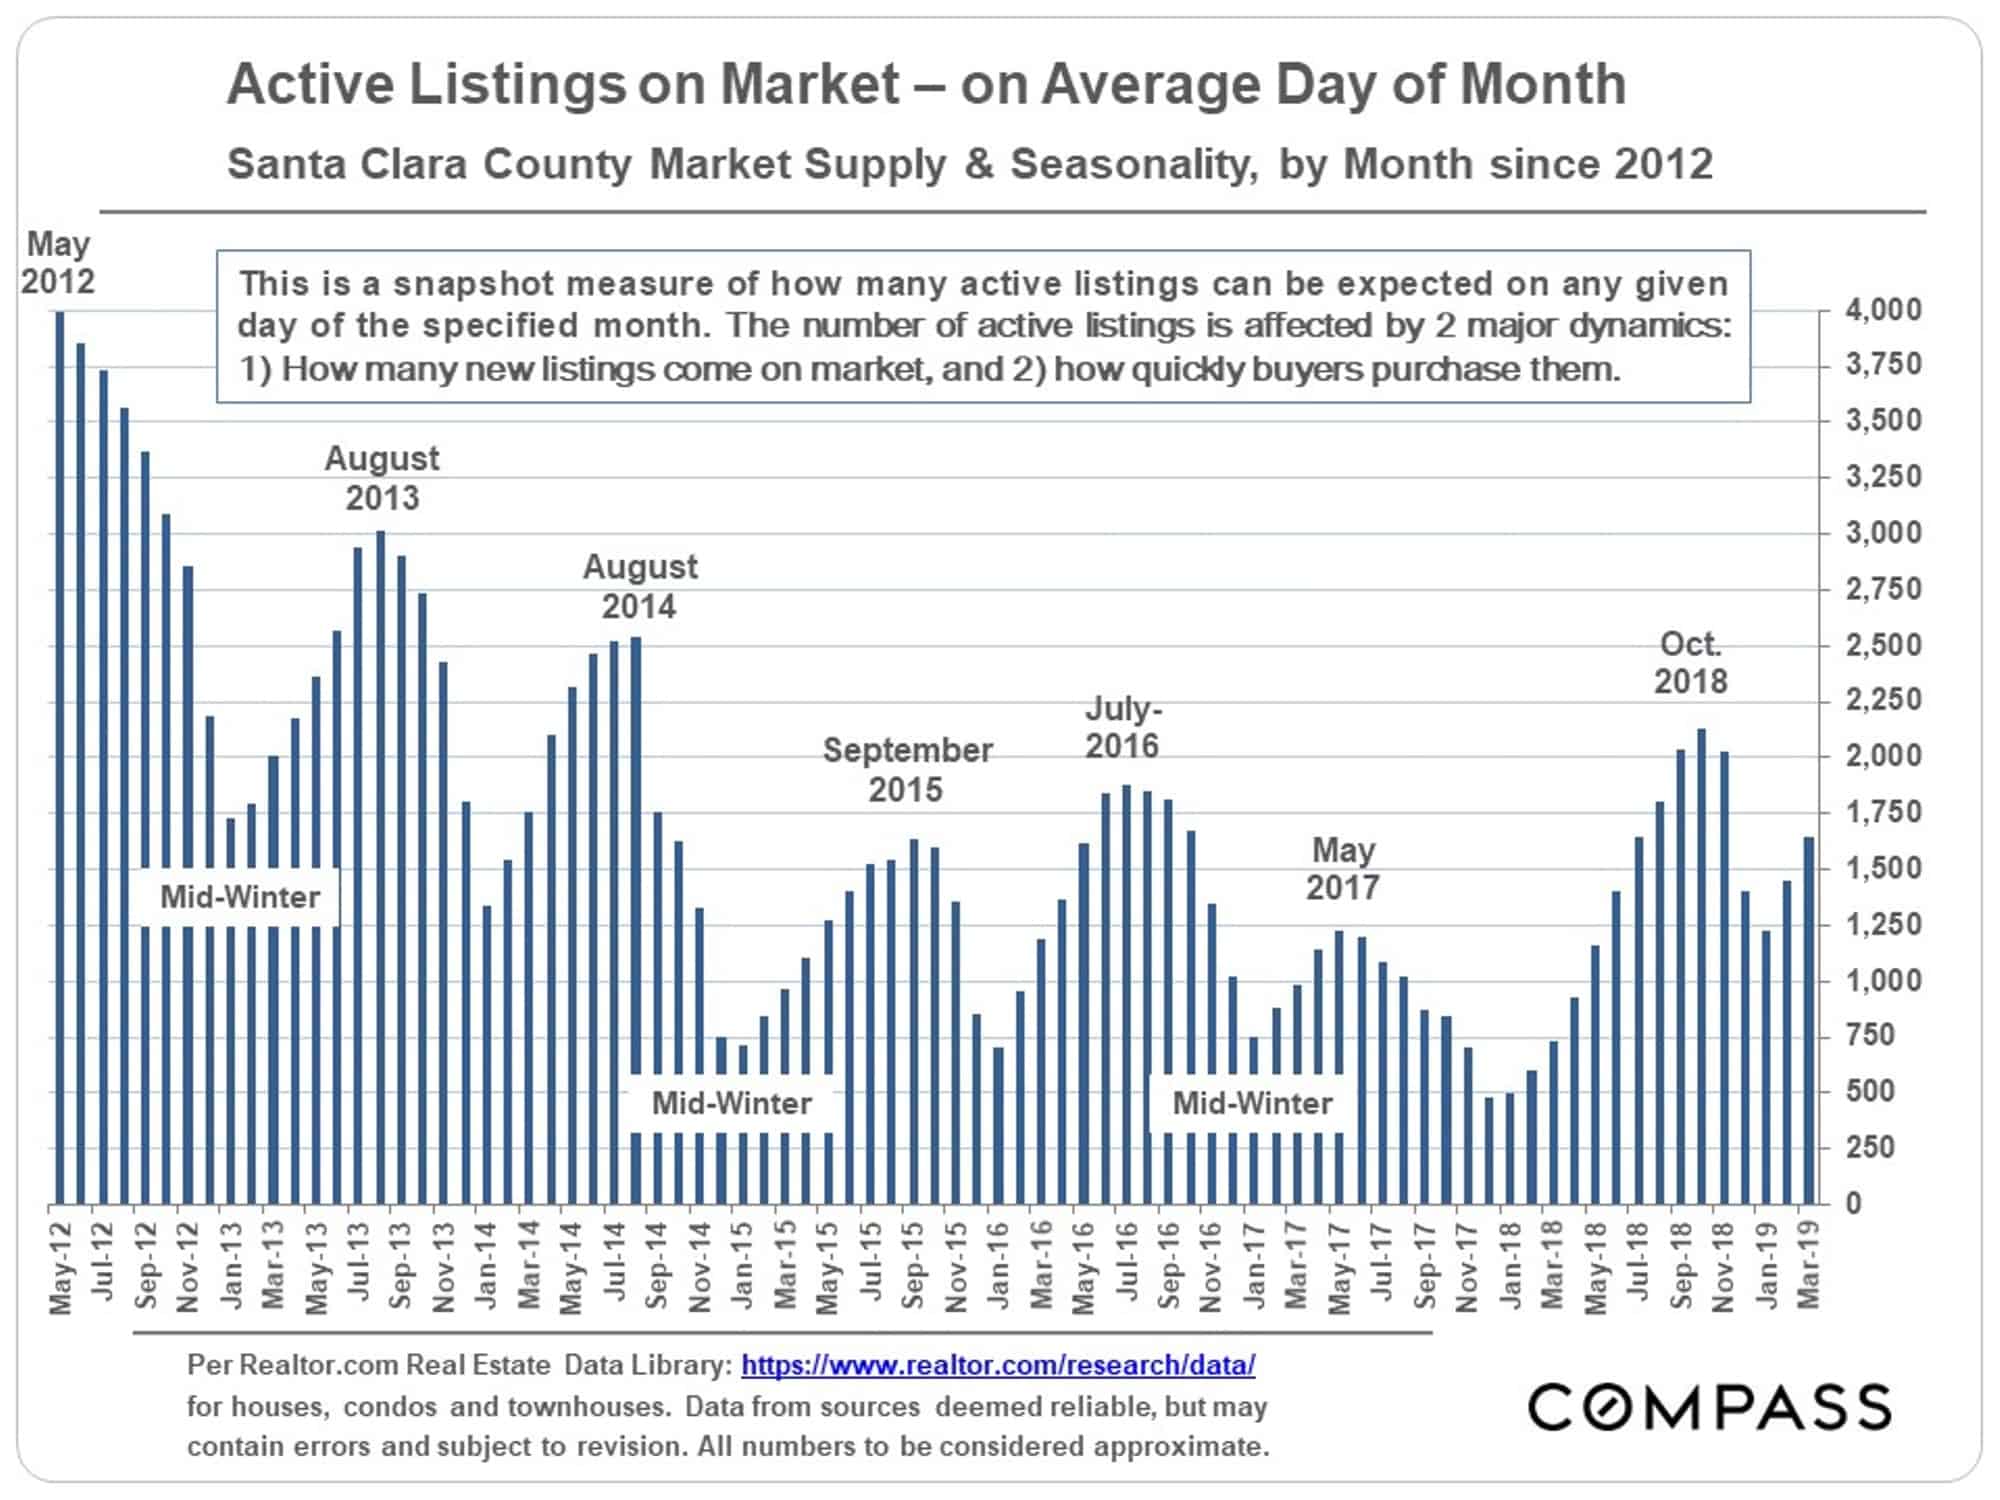
Active Listings on the Market
This chart gives greater context to the increase of listings on the market than the simple year-over-year comparison. Inventory last year was extremely low and has jumped dramatically since then. But, historically speaking, the number of active listings is not wildly high.
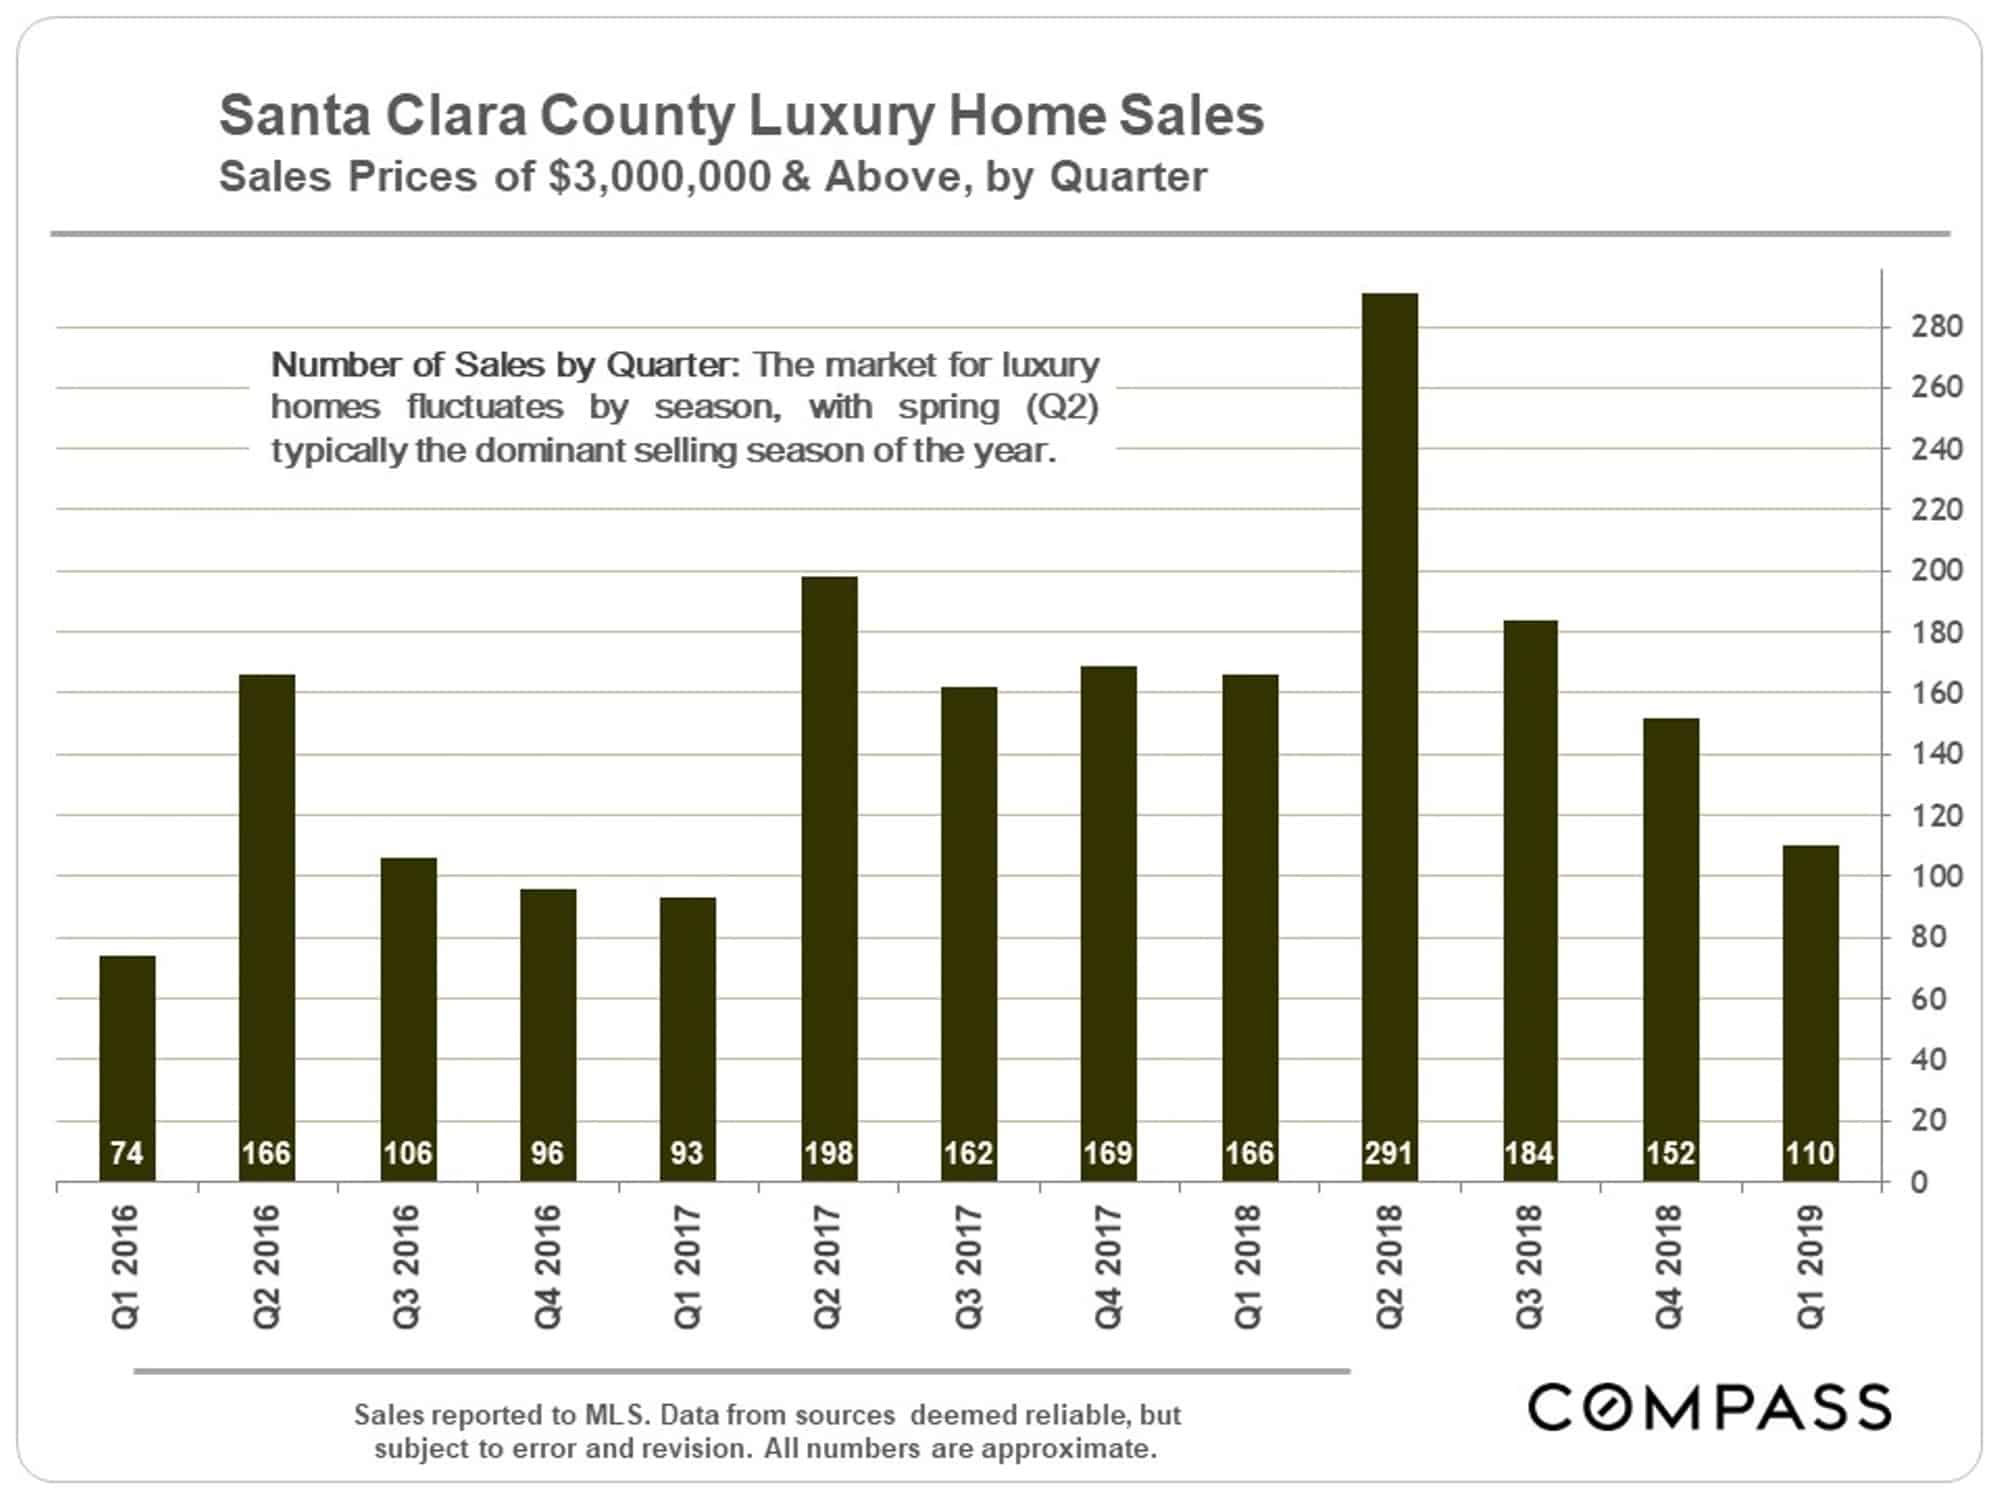
Luxury Home Sales
Sales of homes of $3 million and above have dropped considerably, but part of that may be due to the financial market volatility in Q4 2018. Last year, Q2 saw a very large burst in sales.
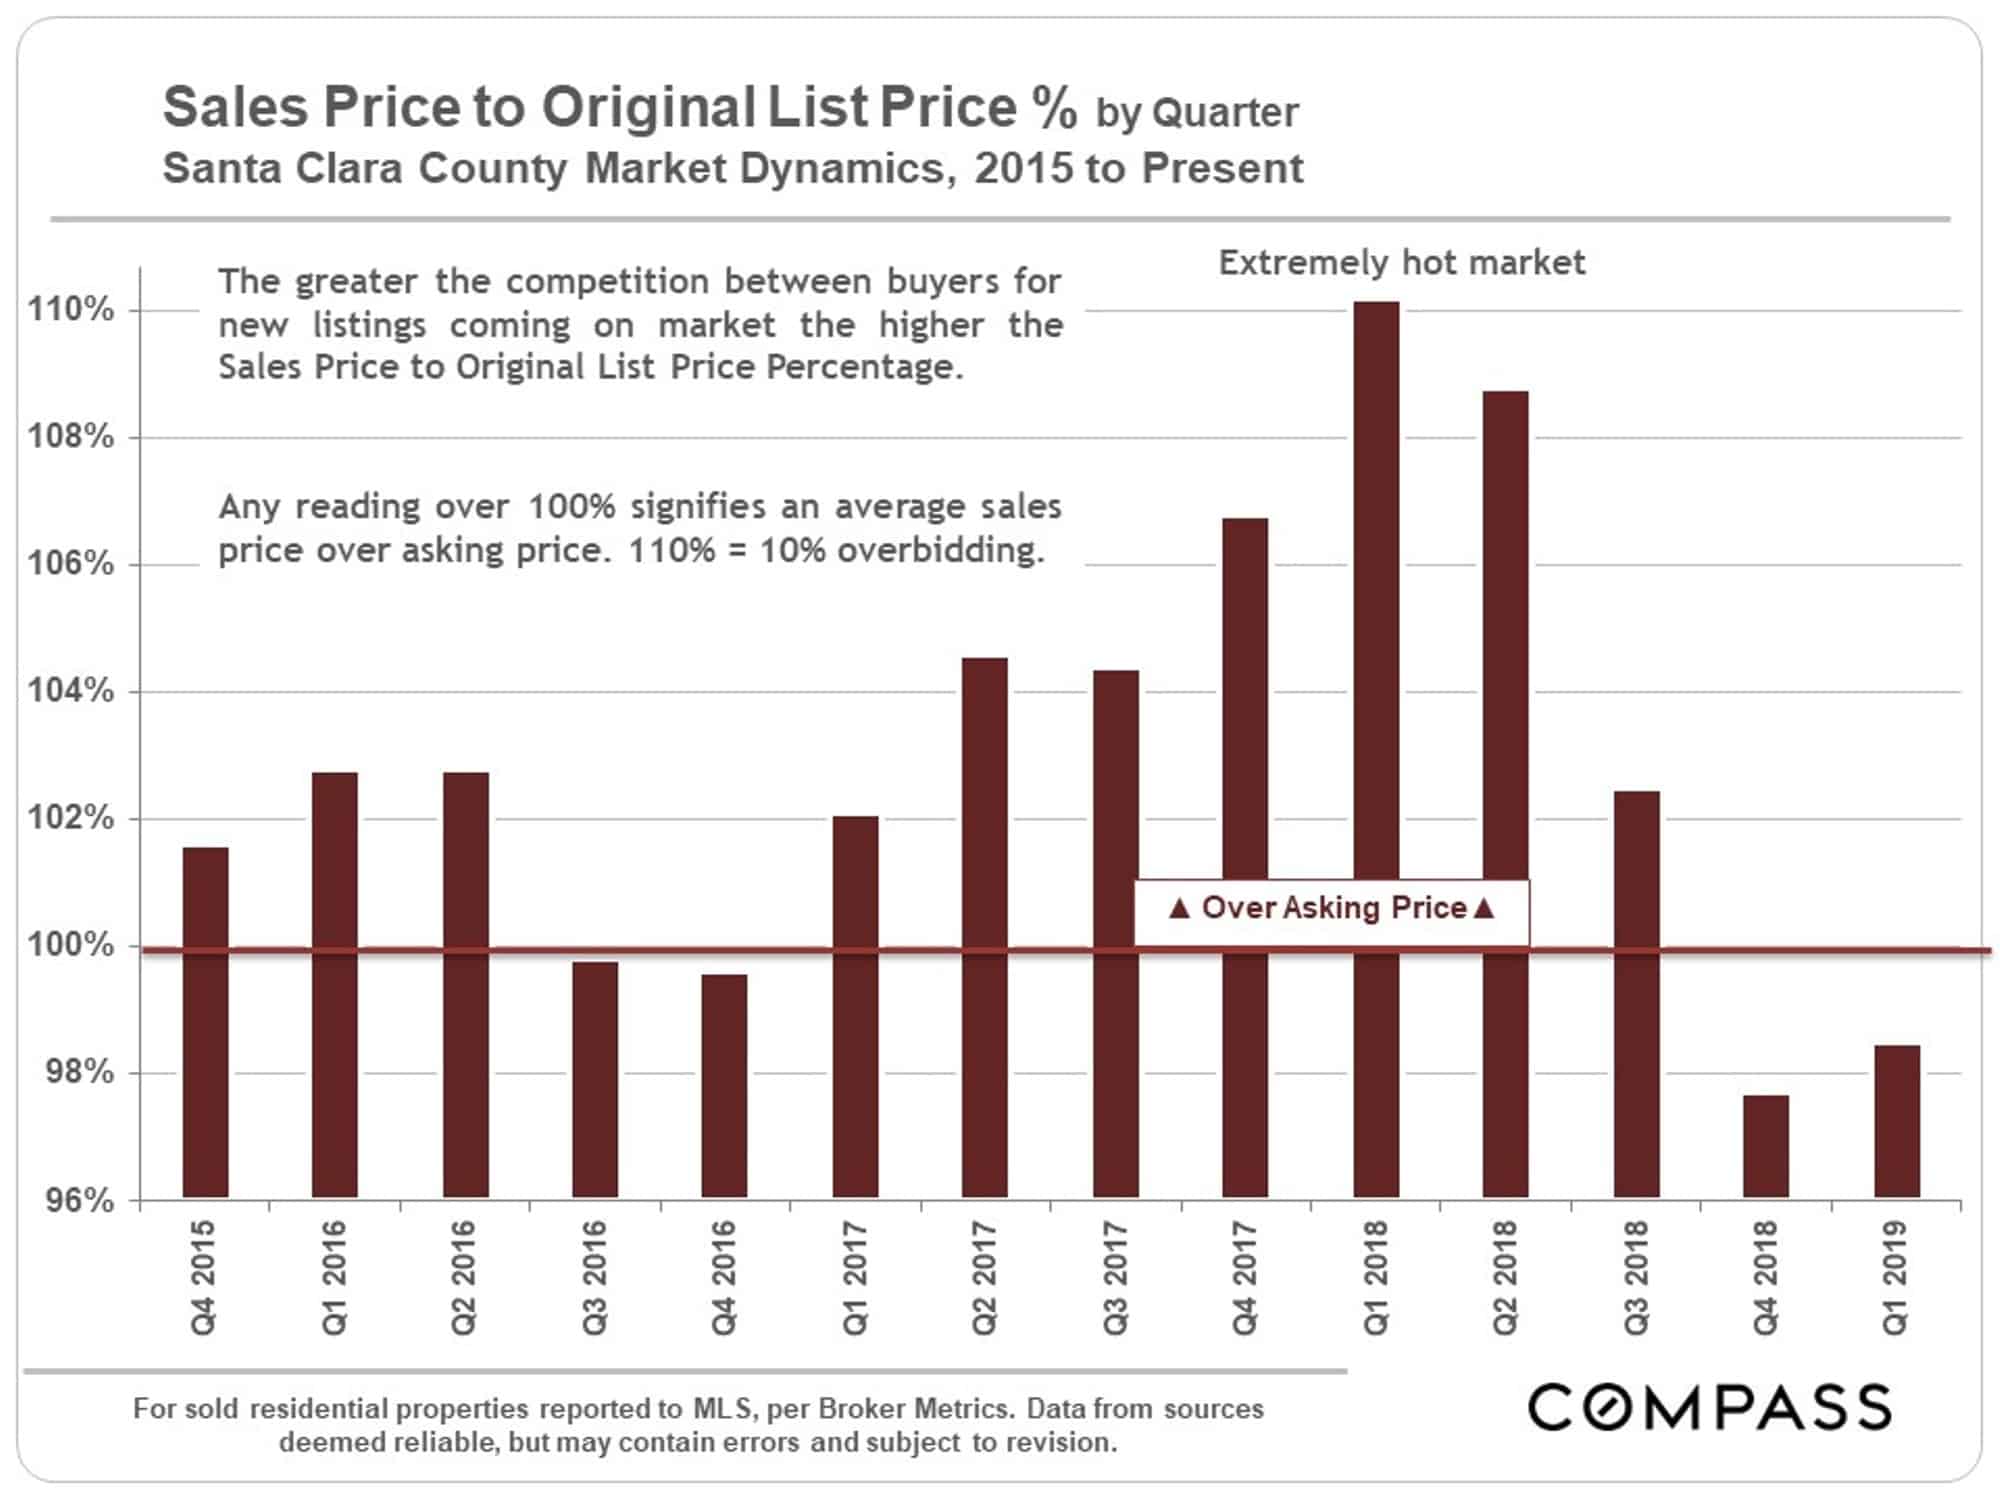
Sales Price to Original List Price Percentage
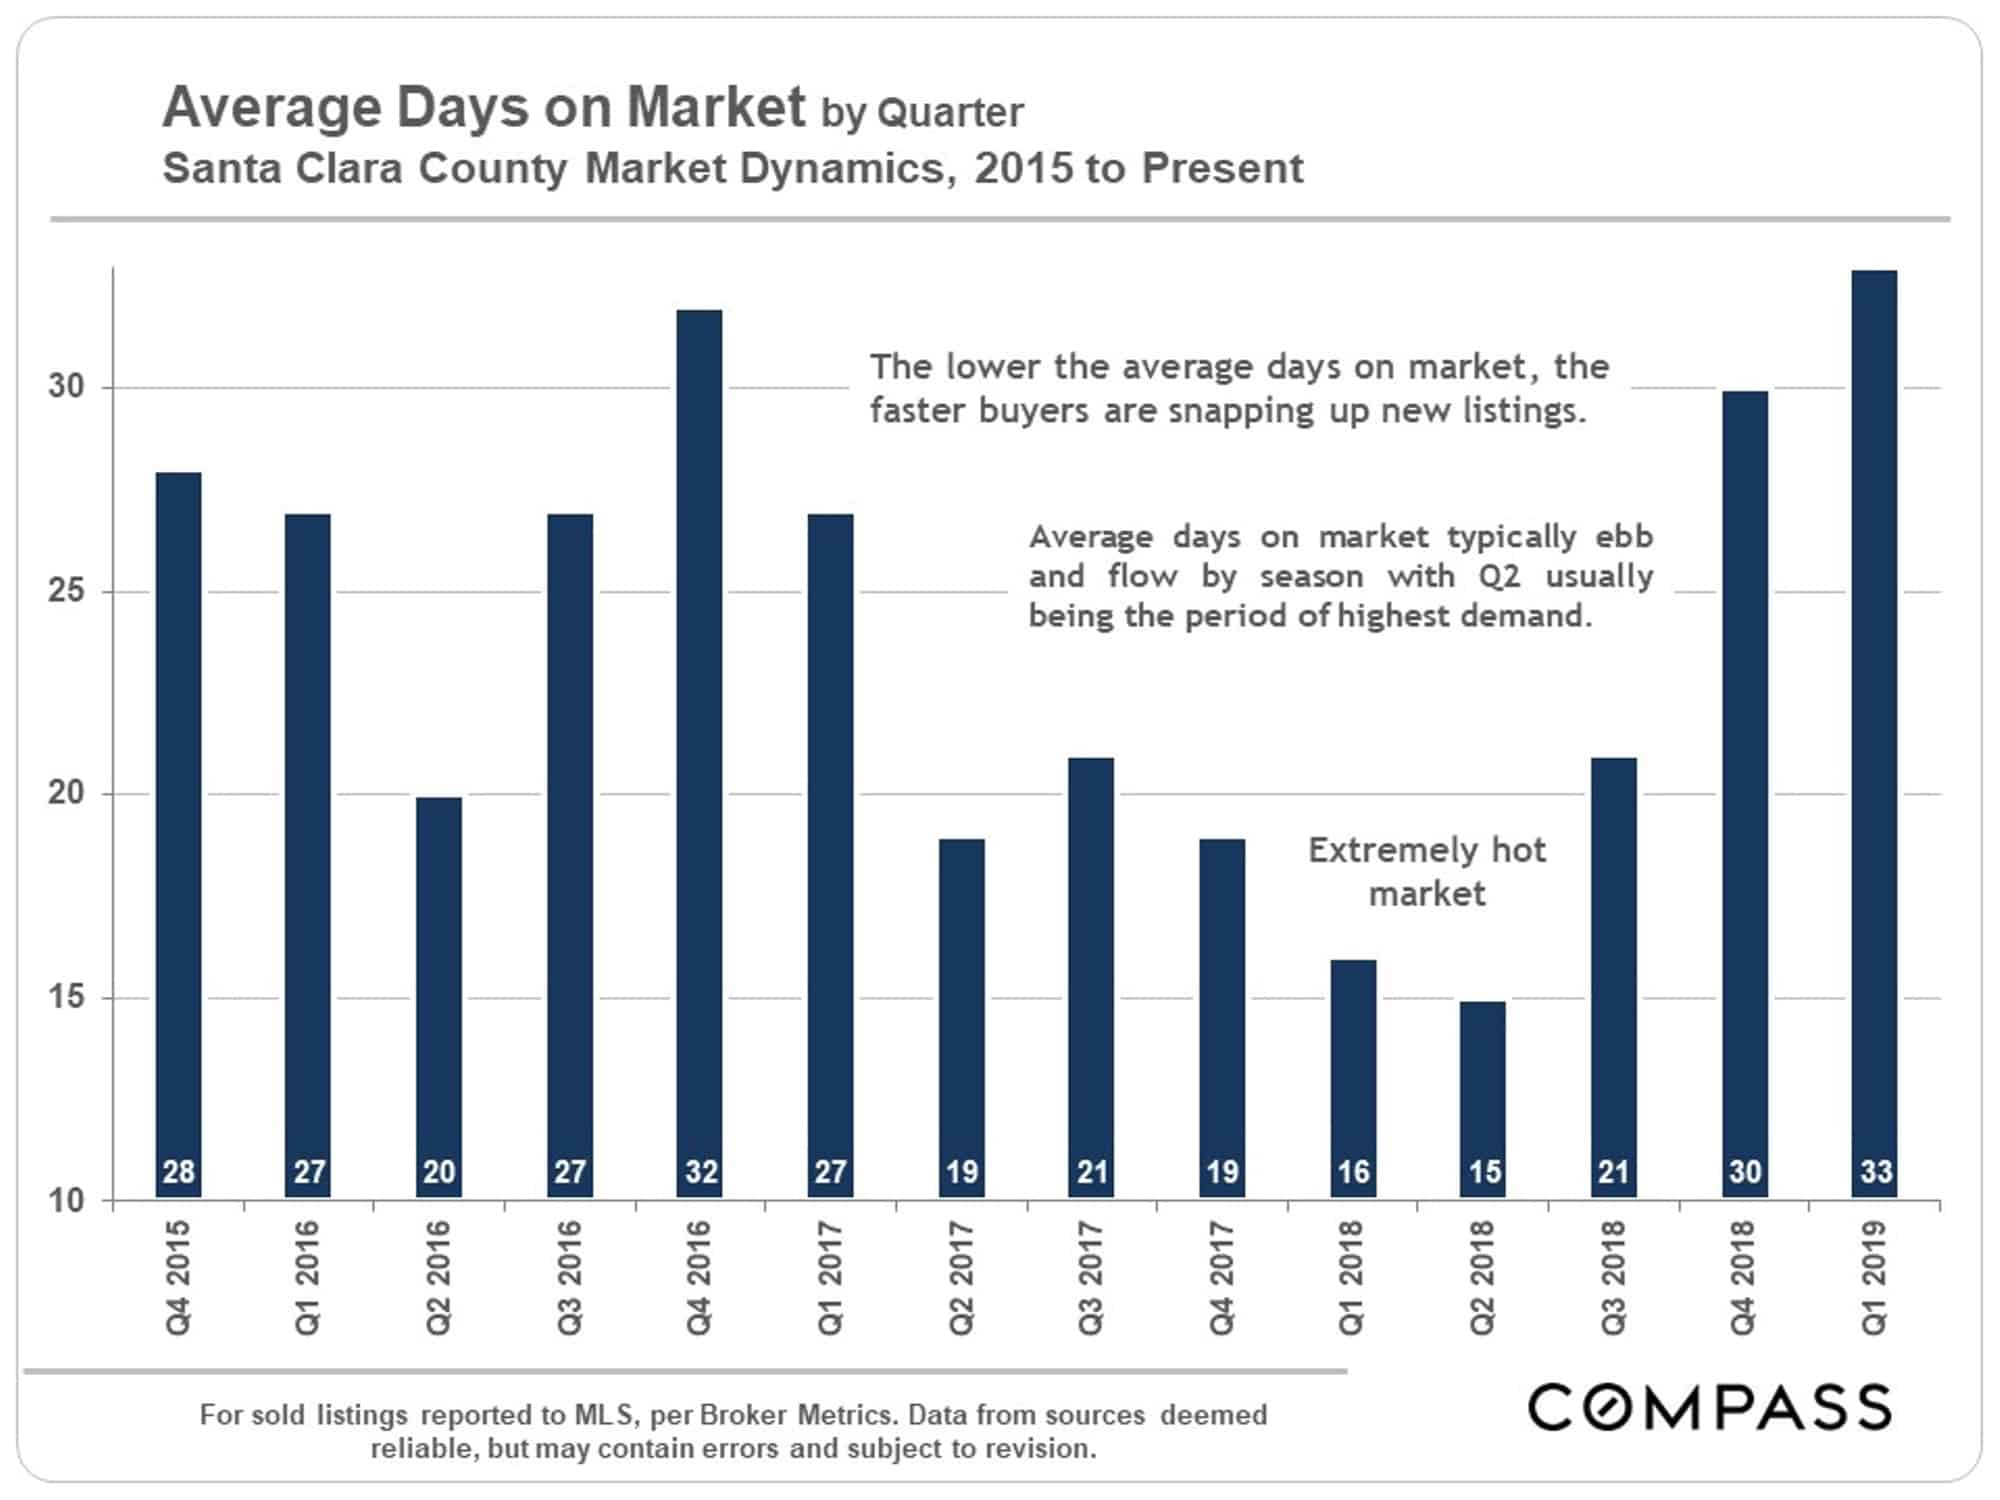
Average Days on Market
Selected Economic Factors
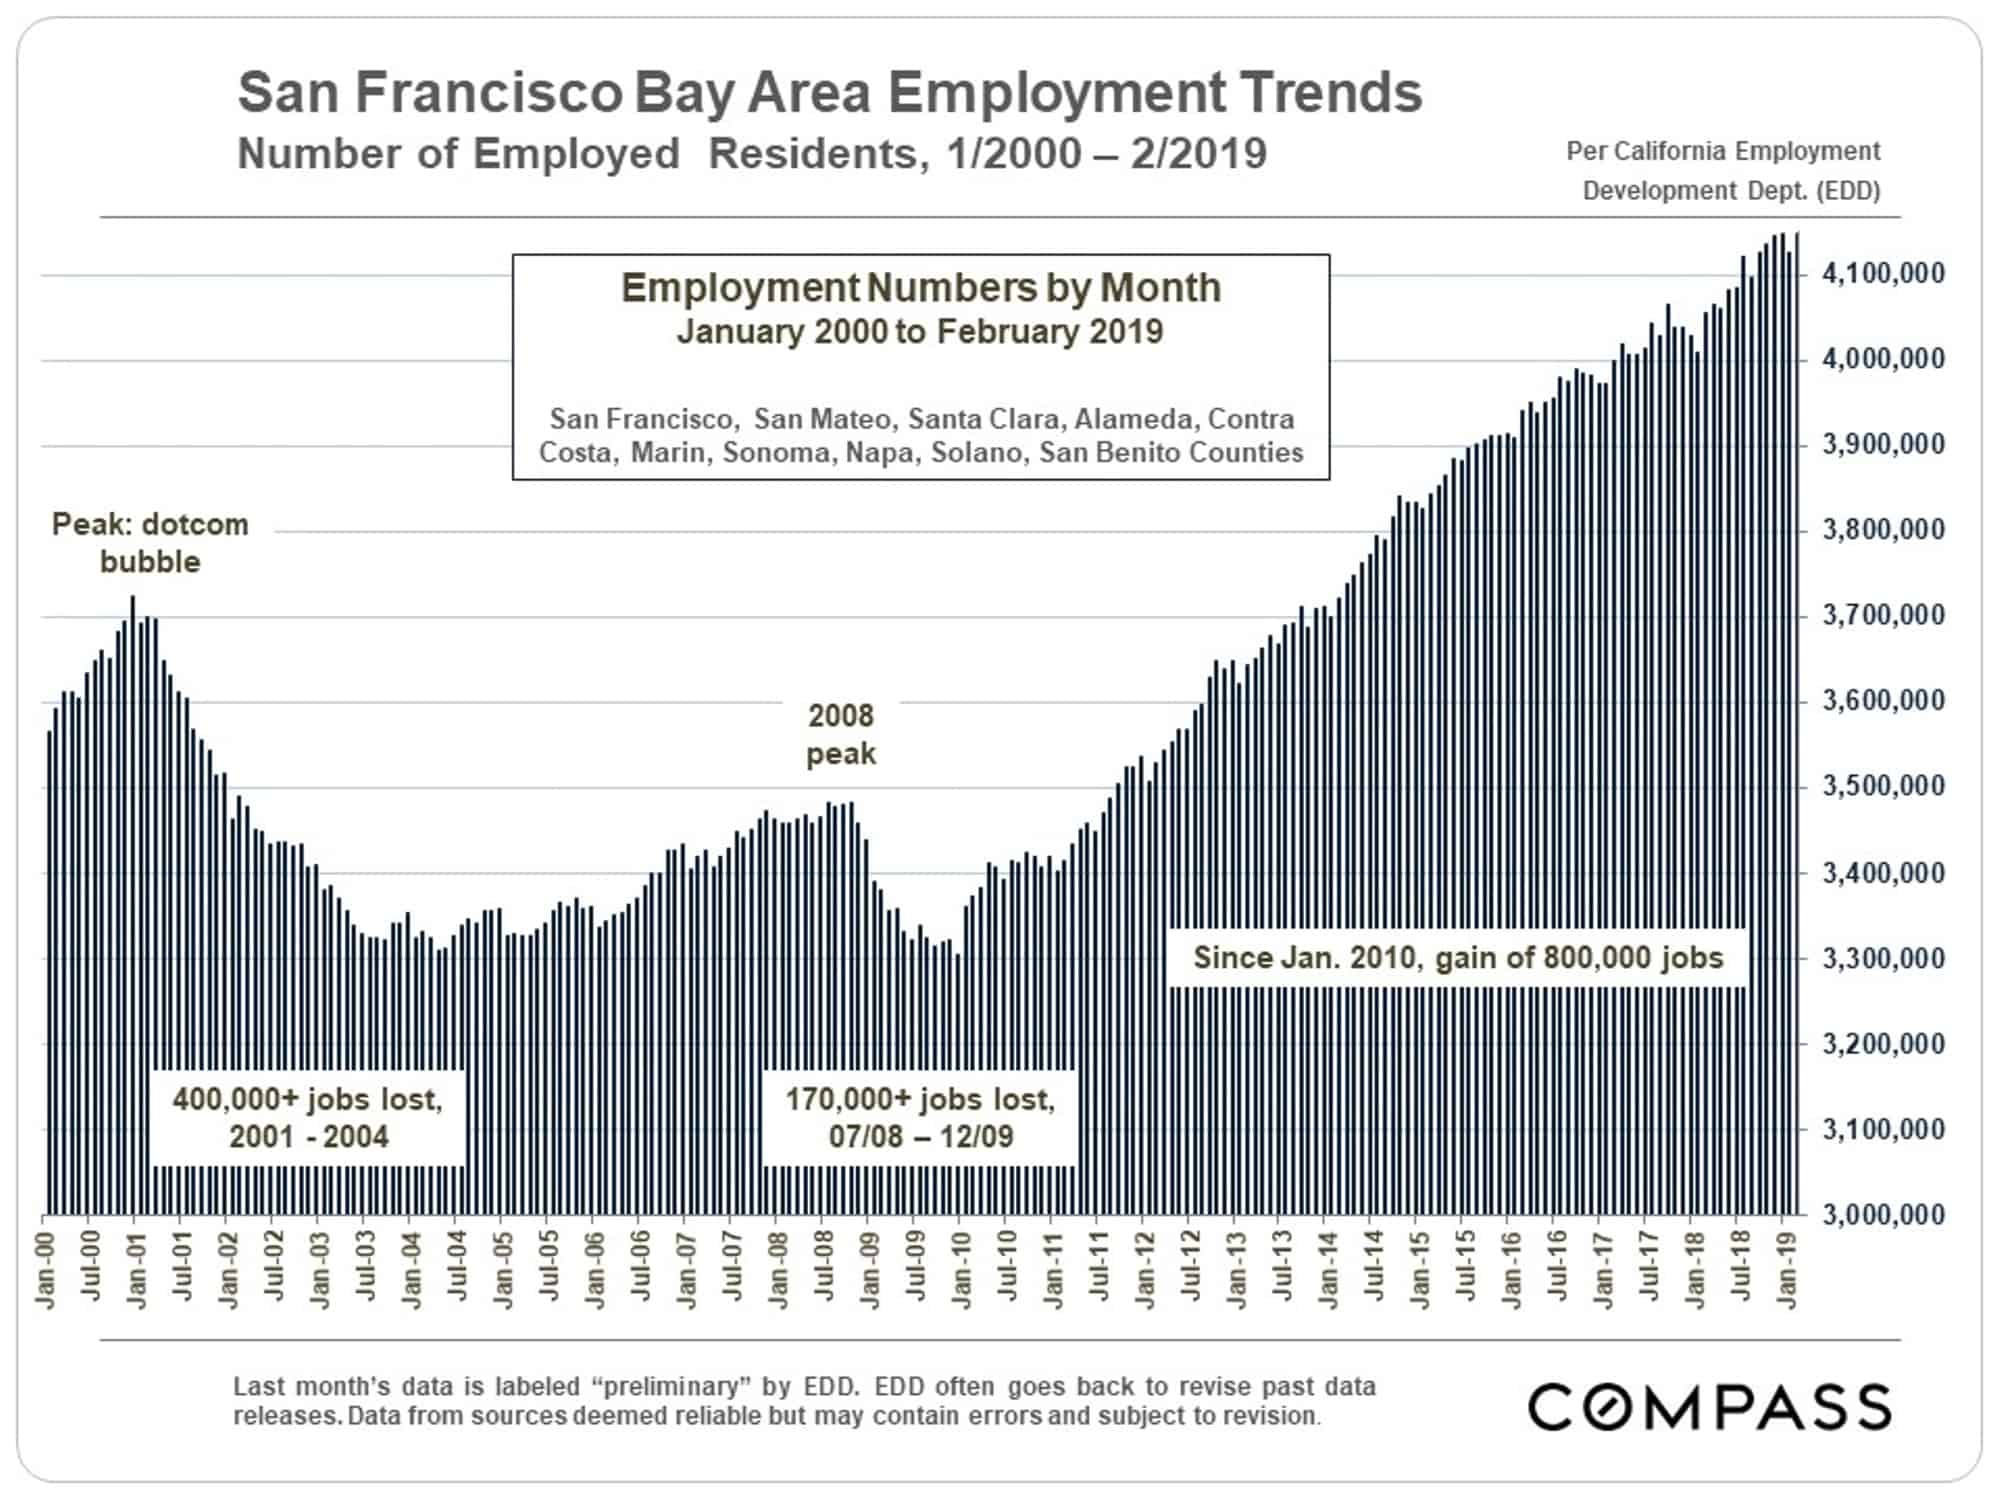
A gigantic factor underlying Bay Area housing markets has been the staggering increase in employed residents since 2010. Outward-bound migration trends of residents and businesses – often citing housing costs as one major motivator – have been an increasing concern in recent years, but for the time being, employment numbers have continued to grow.
A wild ride in stock prices, particularly in high-tech: Prices soared to new peaks in summer-early autumn 2018, plunged drastically in Q4 2018, and then saw the biggest Q1 jump in 20 years. Huge amounts of wealth appearing, disappearing and reappearing – another major influence on consumer confidence and home-buyer demand.
A new surge of large, high-tech unicorn IPOs – mostly of firms headquartered in SF – has just started to roll out. IPOs have historically created vast quantities of new wealth in the Bay Area, though the magnitude of effect of this new wave on our local housing market may be minimal due to our distance from SF. (Though there have been suggestions that Palantir in Palo Alto may go public in 2019.)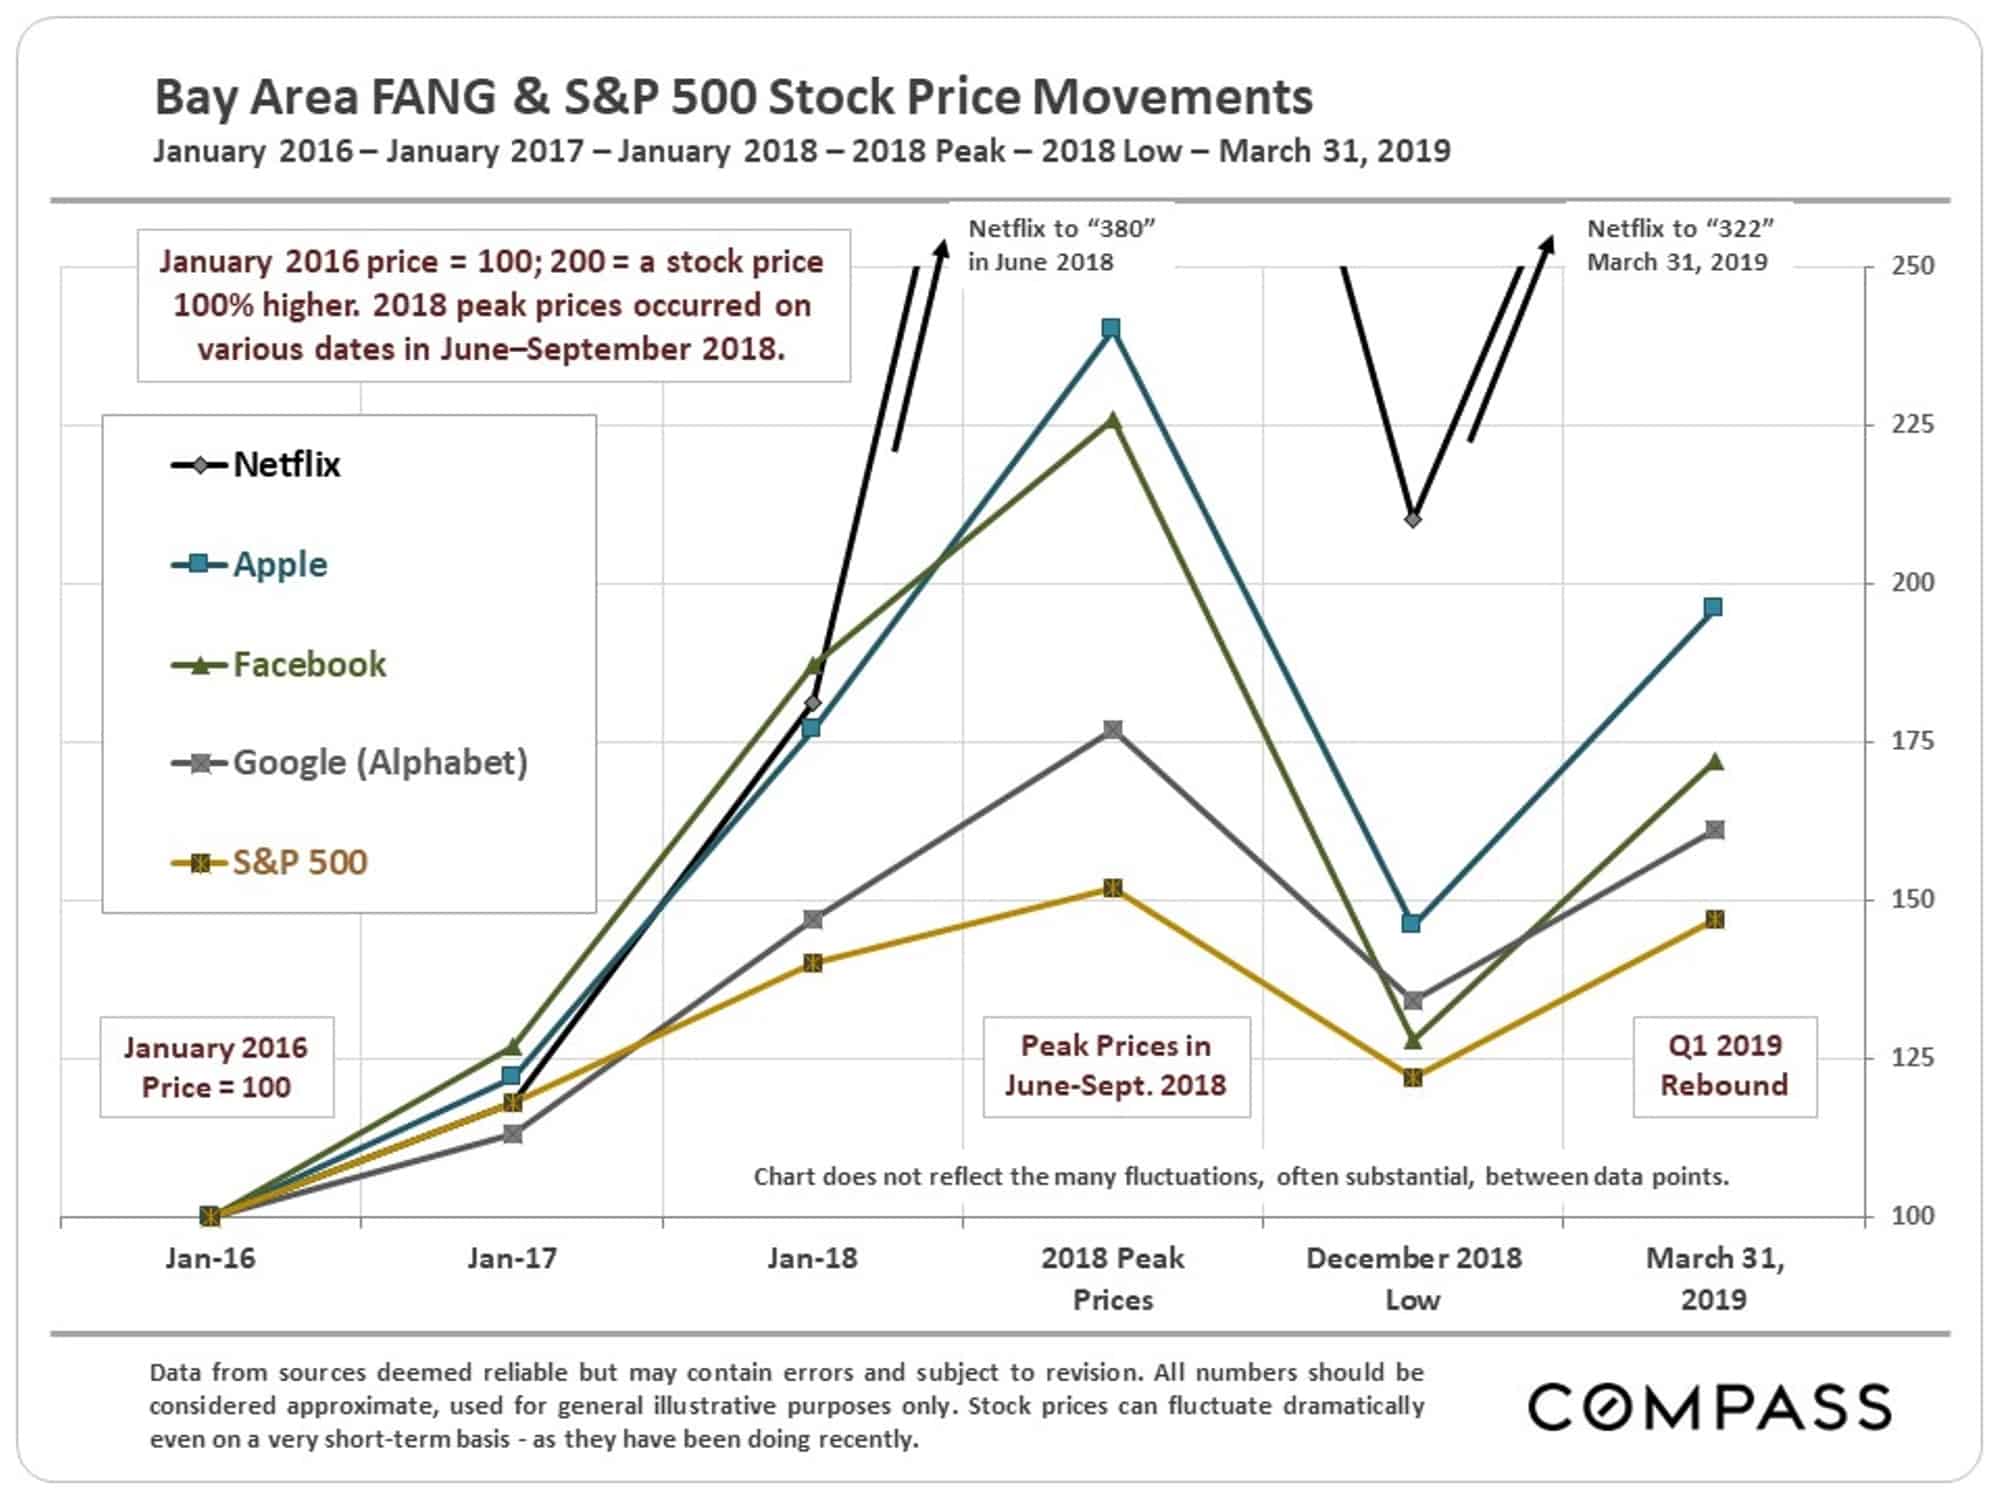
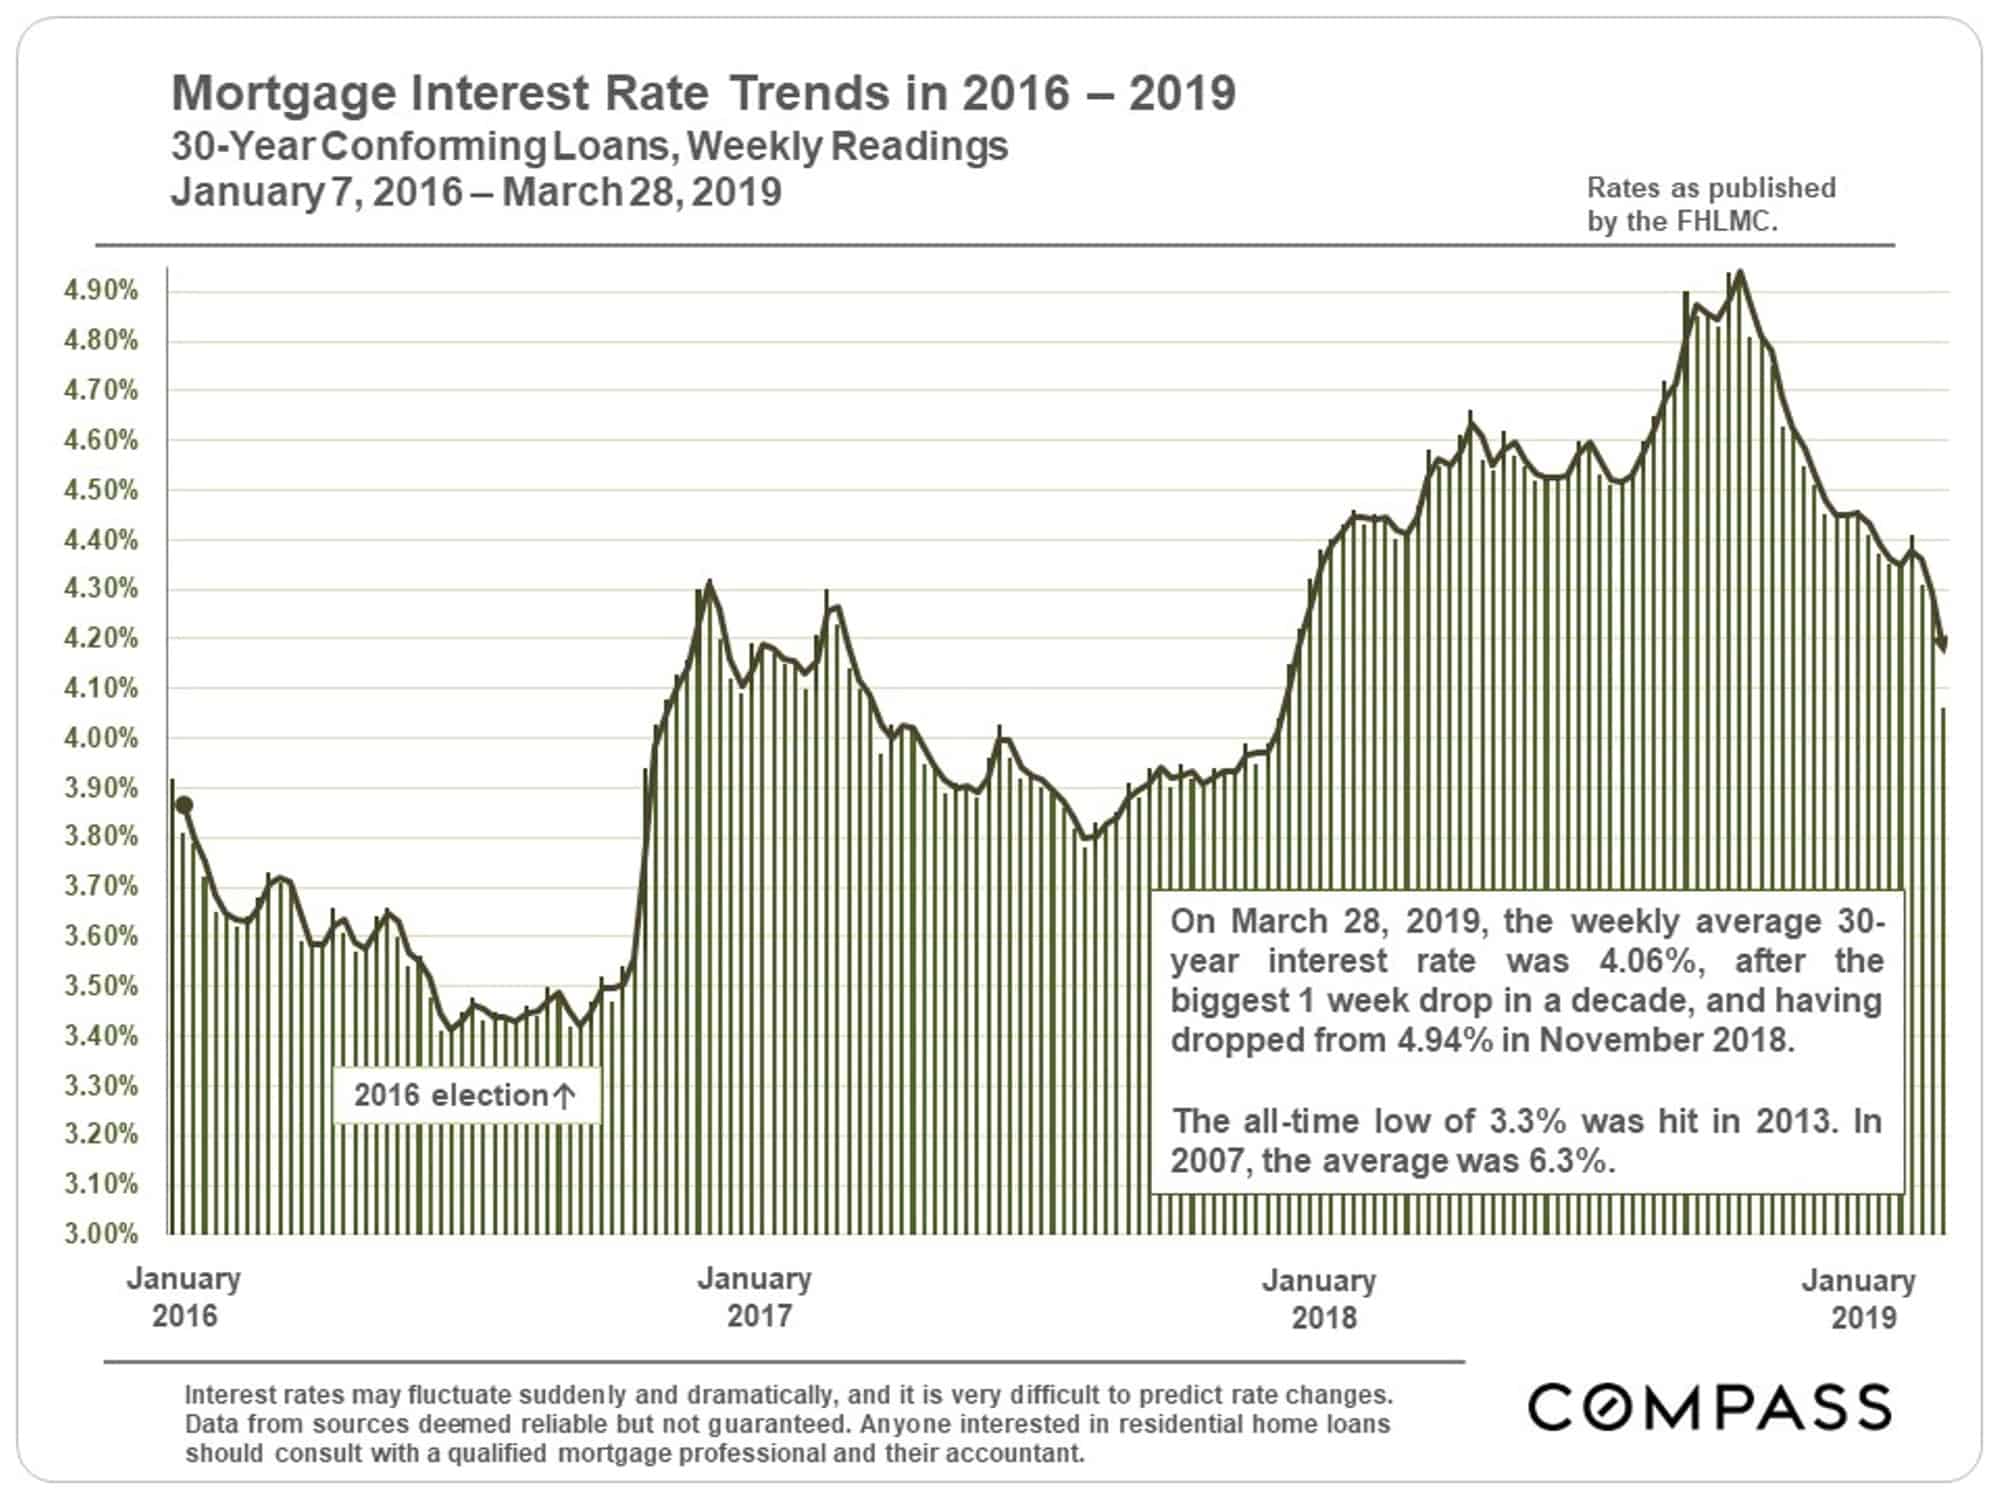
There has been a stunning decline in mortgage interest rates from mid-November 2018 through the end of March, from 4.94% to 4.06% – to the enormous advantage to buyers. Big drops such as this have helped to recharge buyer demand in the past.
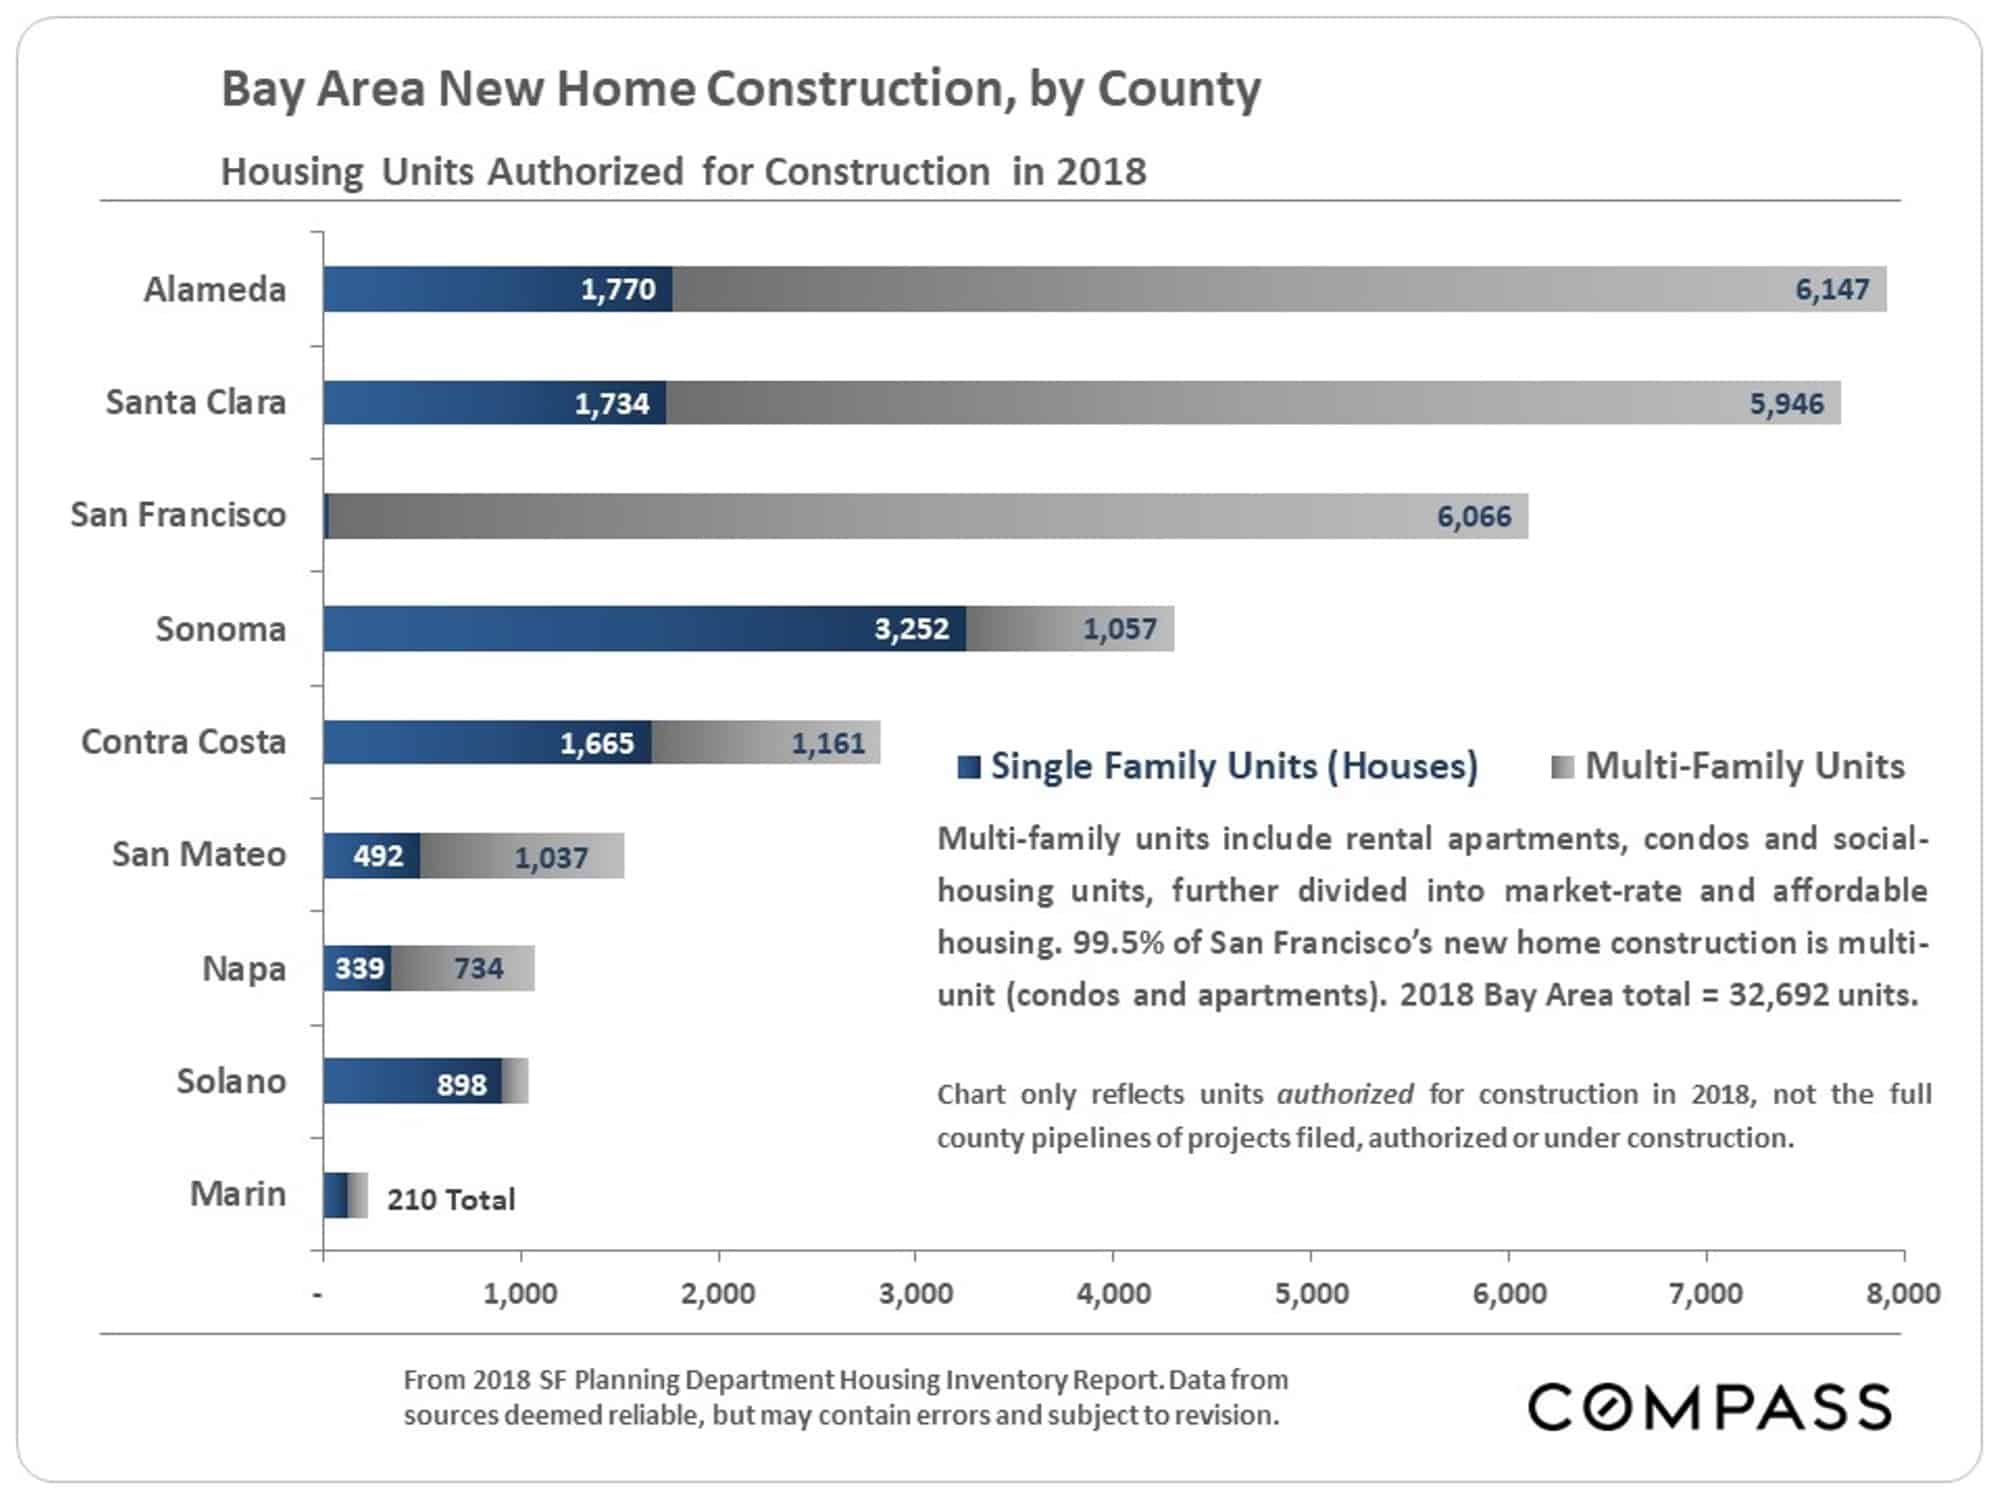
Home construction is declining in San Francisco, mostly due to cost and political issues, and increasing in counties where land and construction costs are lower. Of course, there is huge unmet demand for new housing, an especially big issue in Silicon Valley.
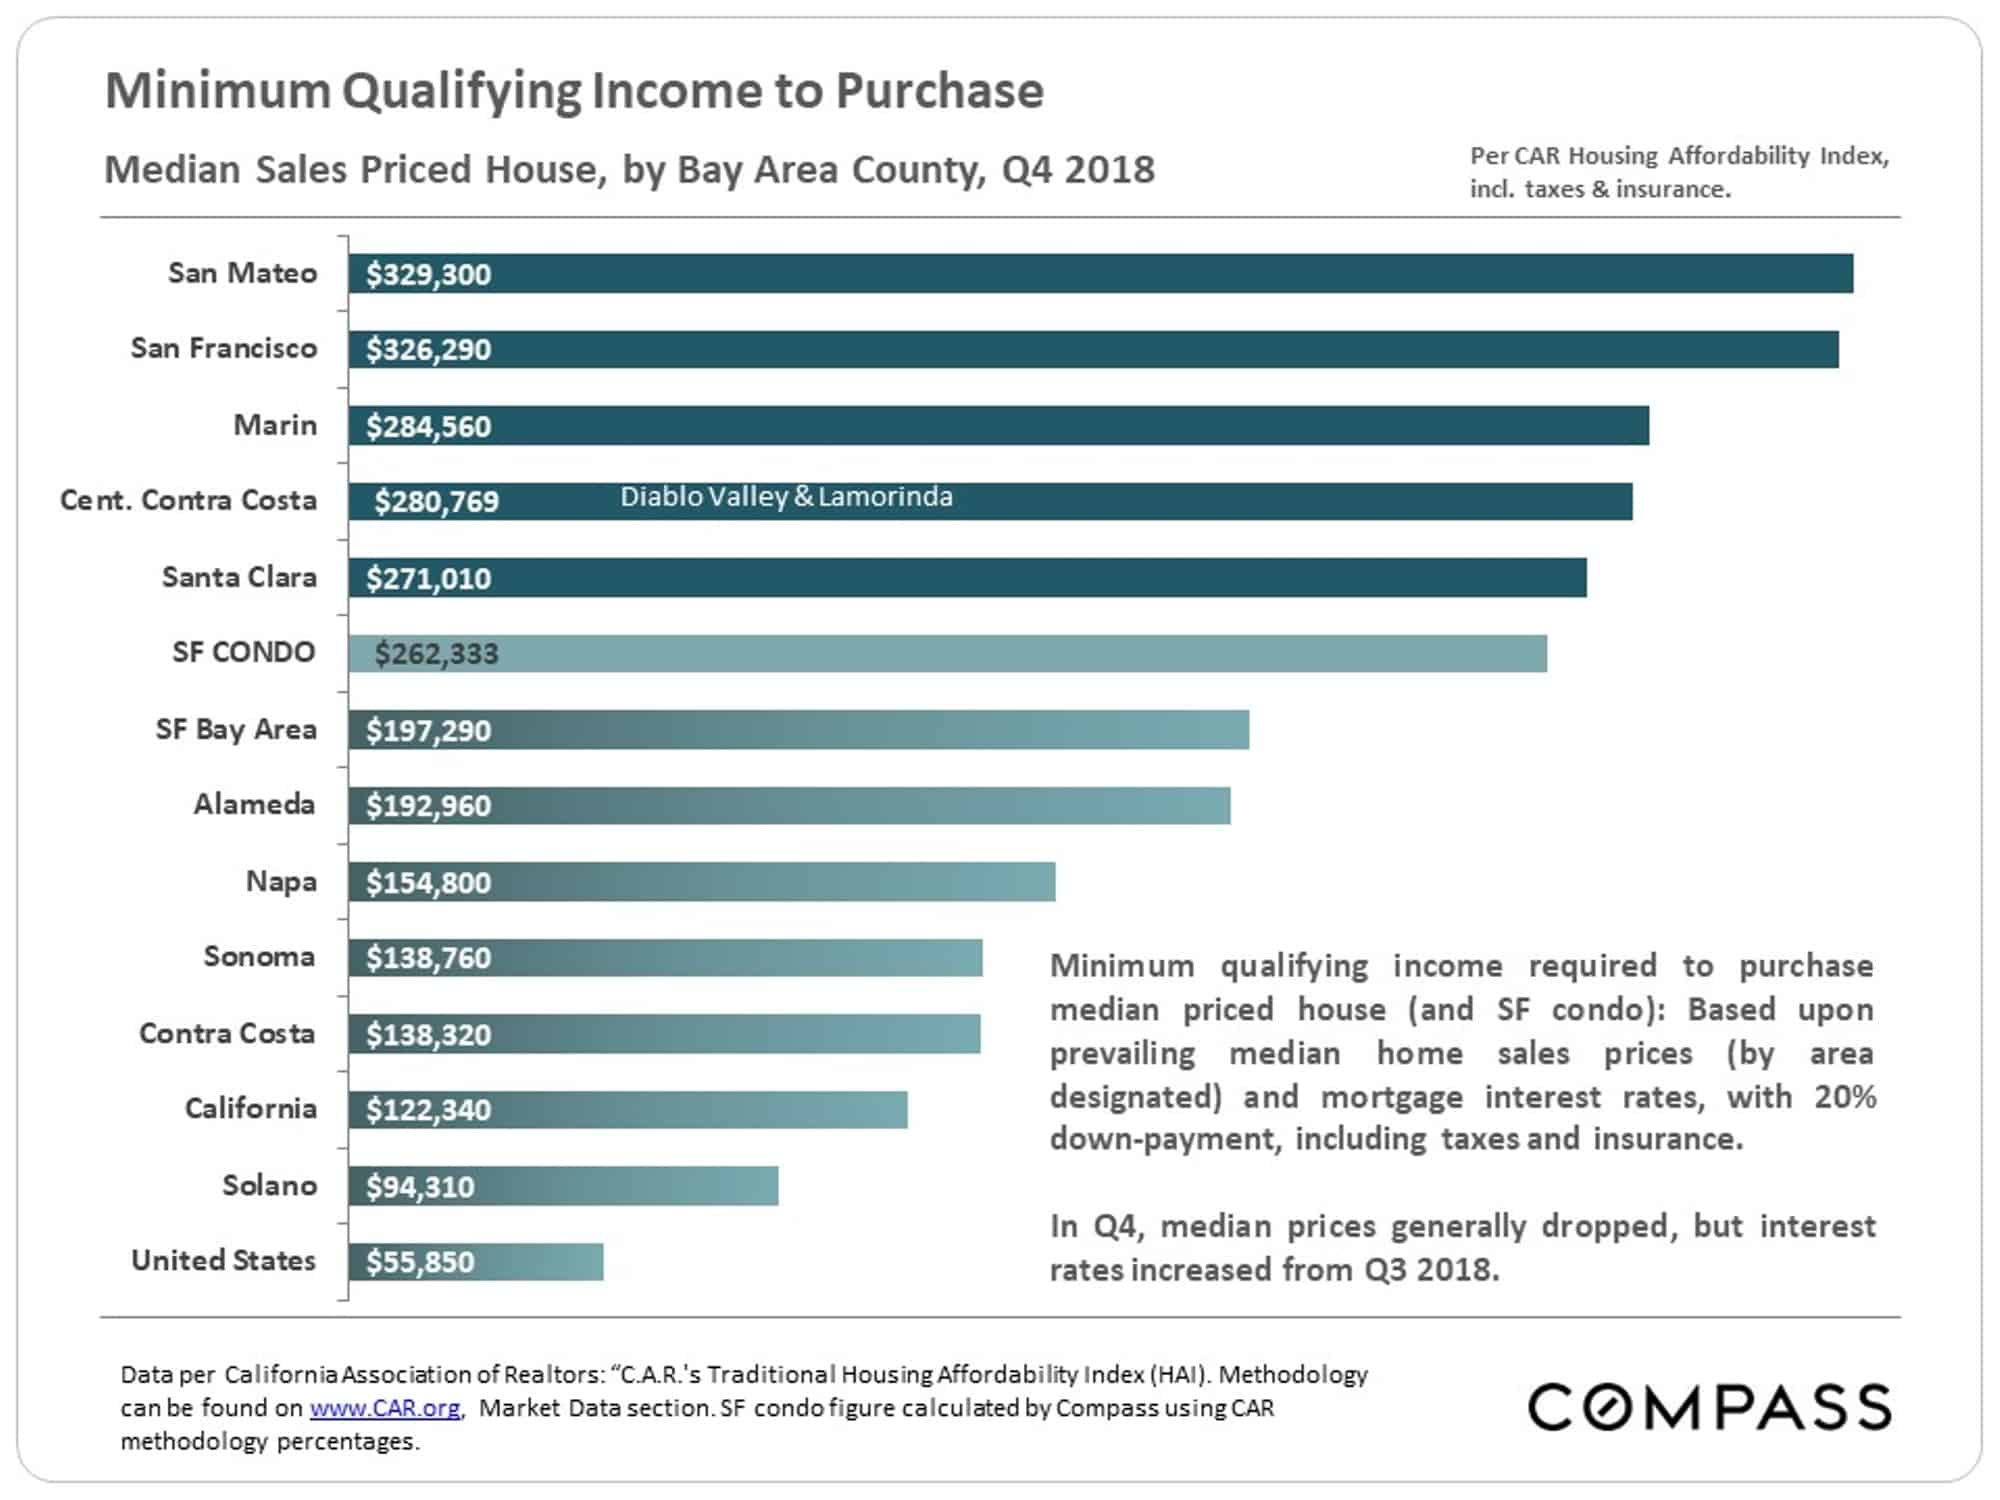
Housing Affordability & Household Incomes
This chart calculates the income required to buy a median-price house in Q4 2018. Median condo prices are substantially less in every county and would require lower incomes.
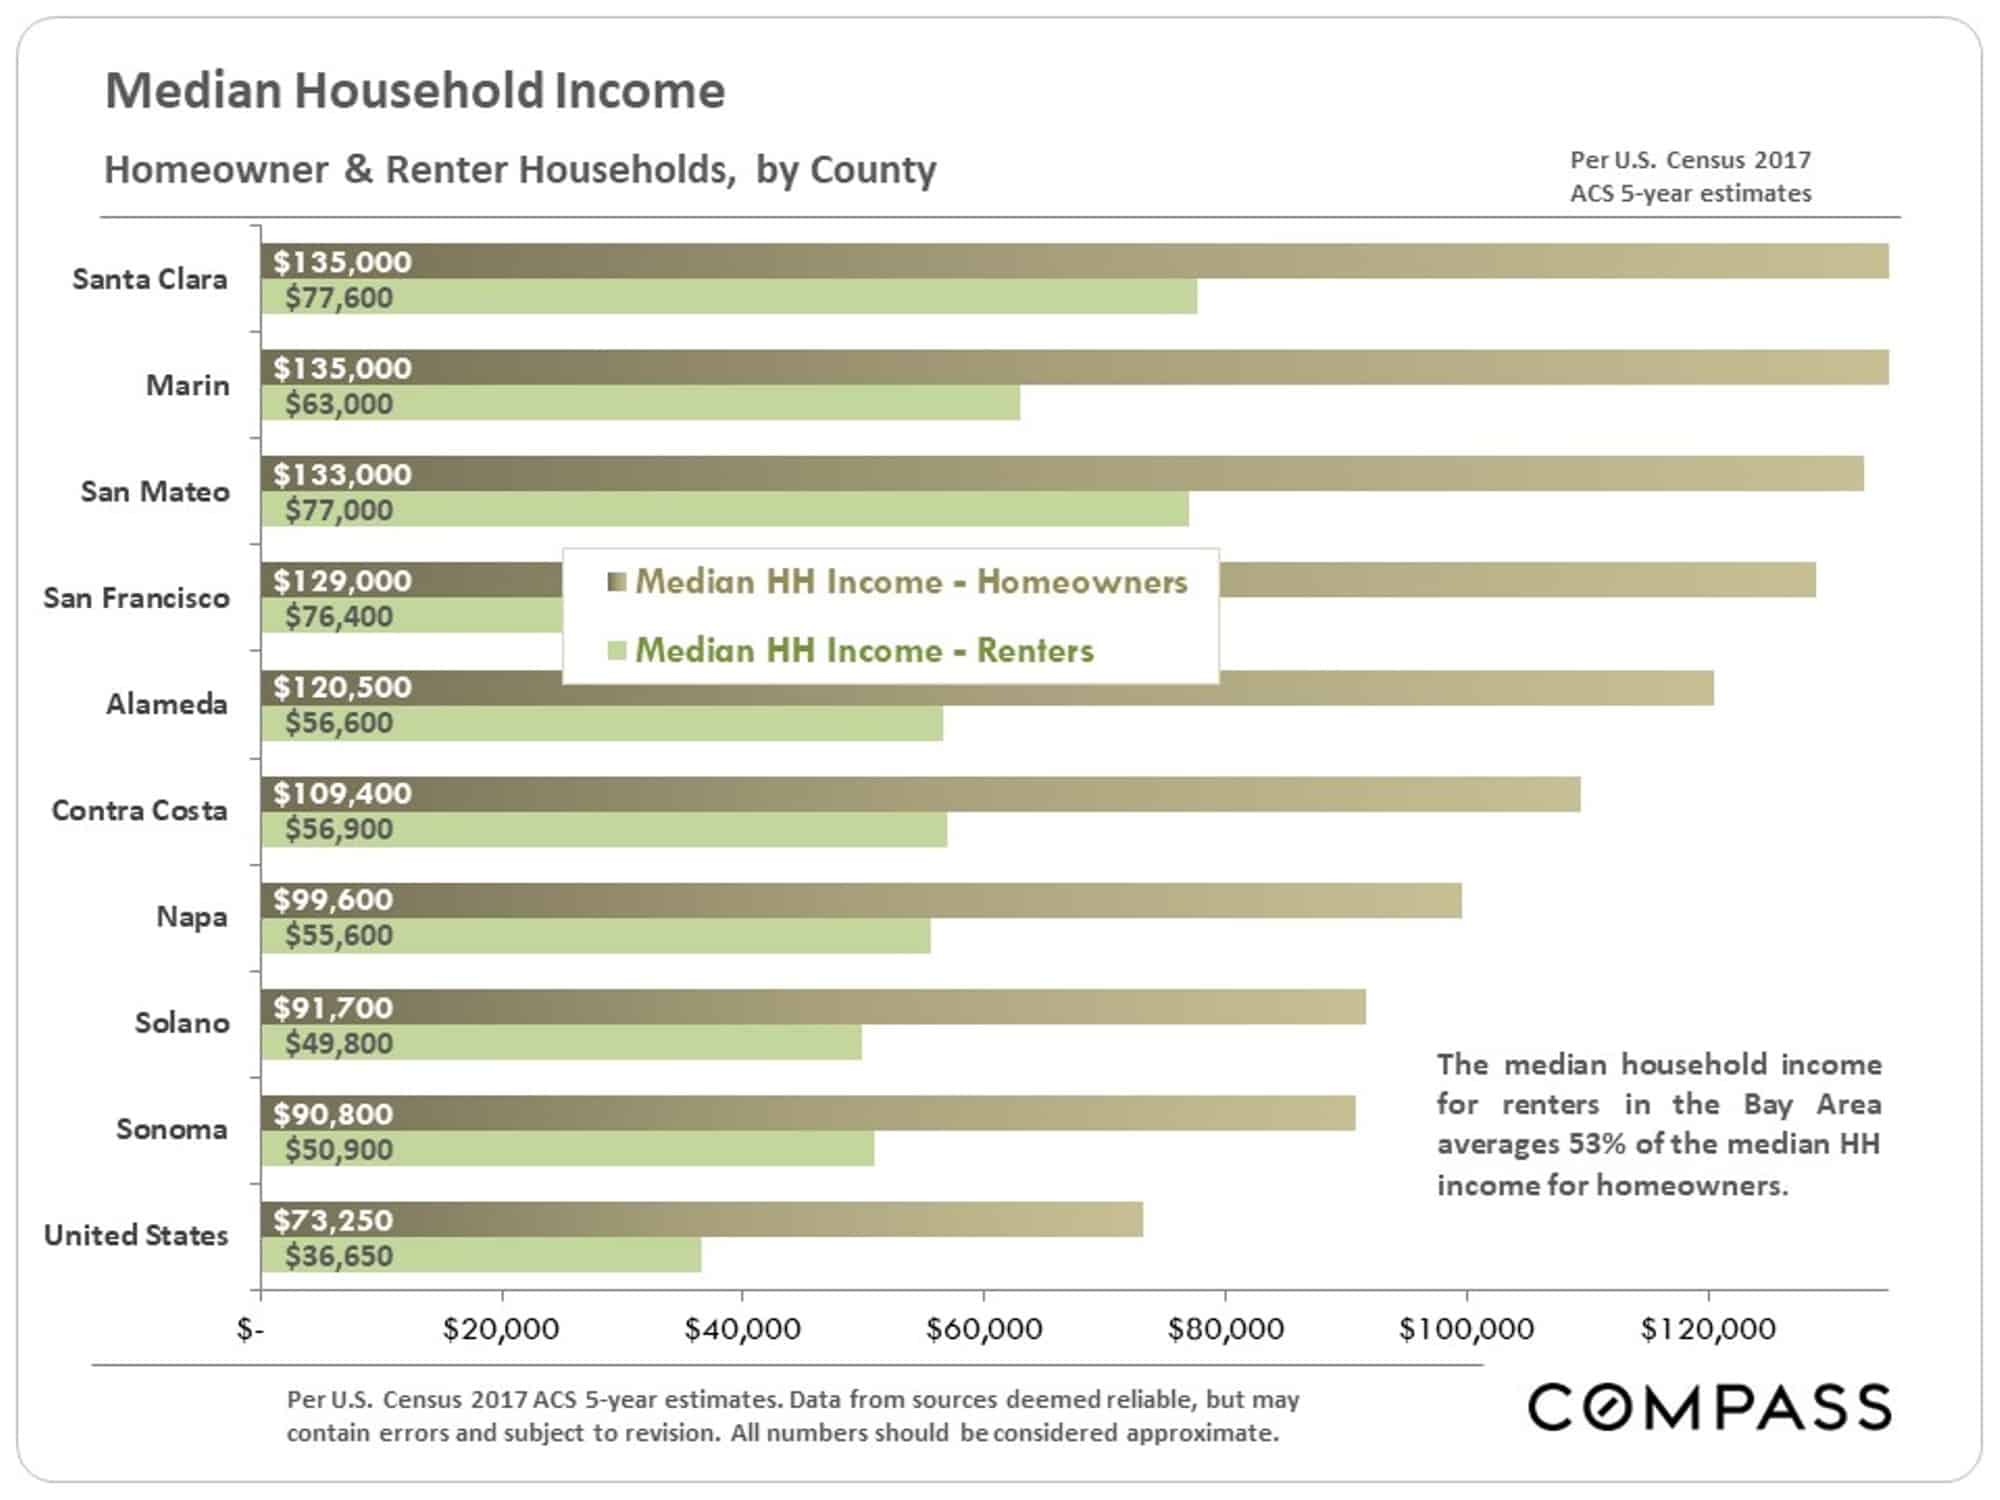
County median household incomes are broken out below for homeowners and tenants – Santa Clara County has the highest in the Bay Area. However, comparing the chart below to the one above illustrates the disparity between prevailing incomes and the incomes required to purchase in the Bay Area.
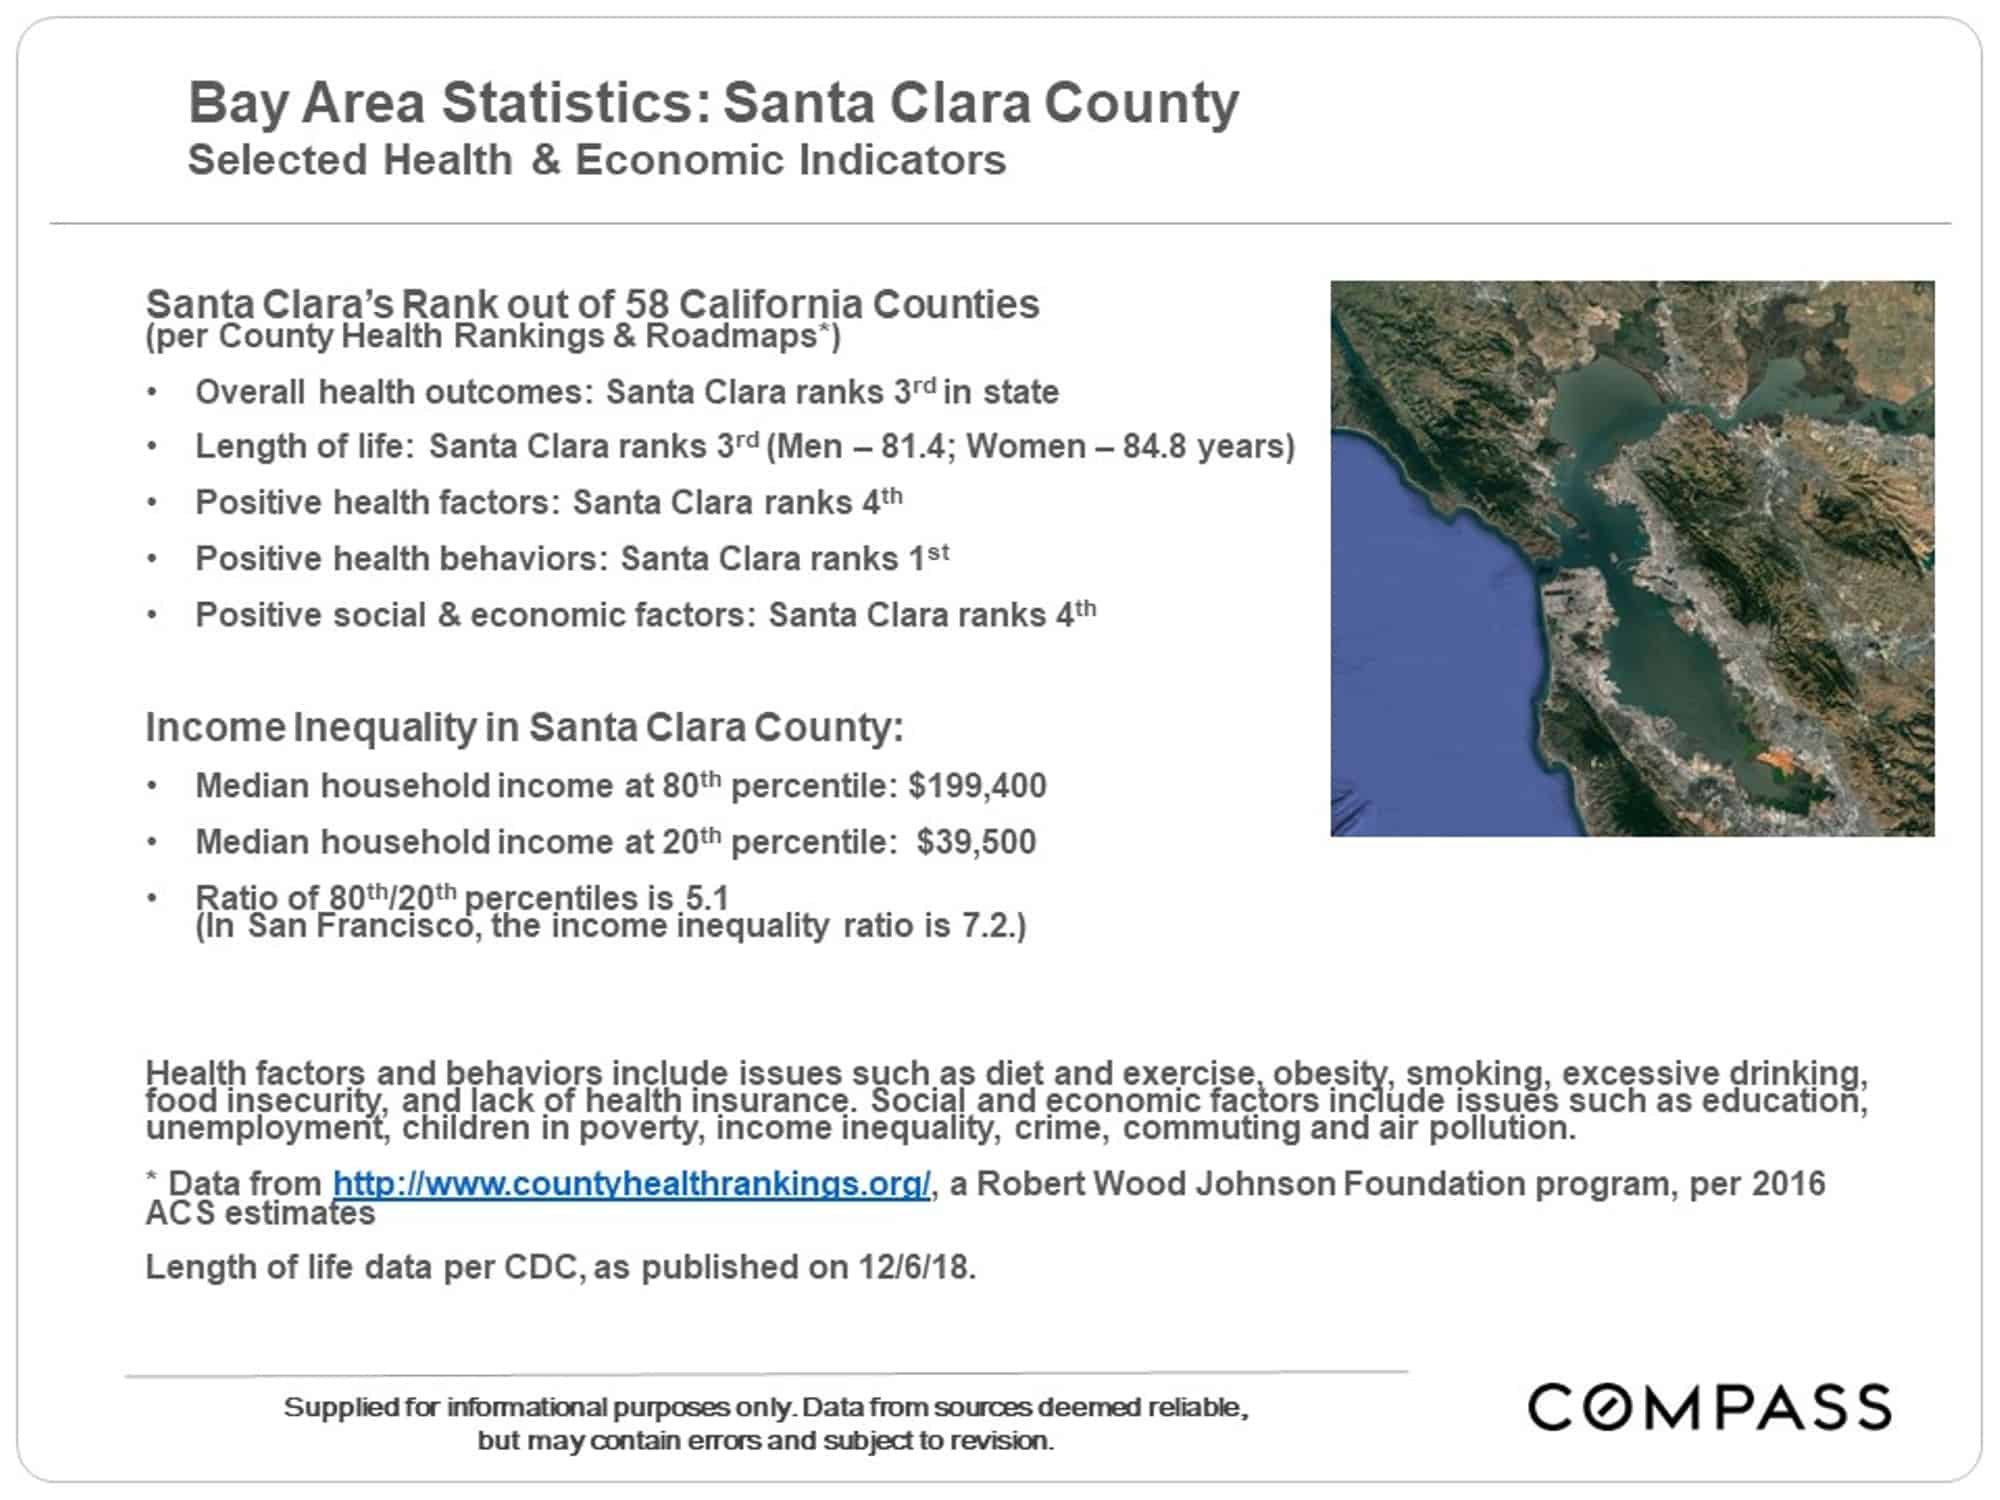
Health & Economic Indicators
According to CountyHealthRankings.org, Bay Area counties are at the top of the list within CA for Overall Health Outcomes: Marin, San Mateo and Santa Clara rank 1, 2 & 3 respectively. Santa Clara ranks first for positive health behaviors.