San Mateo February 2021 Real Estate Market Report

San Mateo County Real Estate
Sales Climb Rapidly to End 2020 &
a Strong Start to the 2021 Market.
February 2021 Report
Our January report focused mostly on 2020’s annual statistics. This report will put most of its attention on quarterly and monthly indicators, which better illustrate changes occurring as 2020 progressed and 2021 began.
In January, new listing activity started to pick up quickly after the typical annual low hit in December. The numbers of listings going into contract and of listings closing sale in January were both up approximately 37% from January 2020 – very significant increases.
As is the norm, new listing activity began to pick up in January, after hitting the usual, annual low point in December. The number of new listings coming on market in January was up about 34% over January 2020.
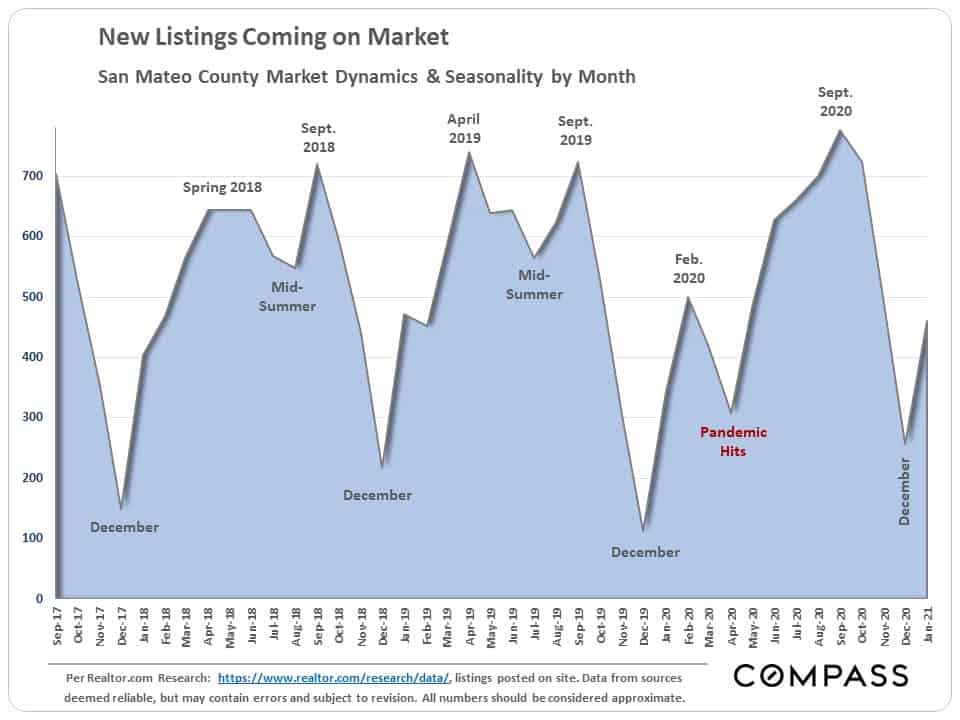
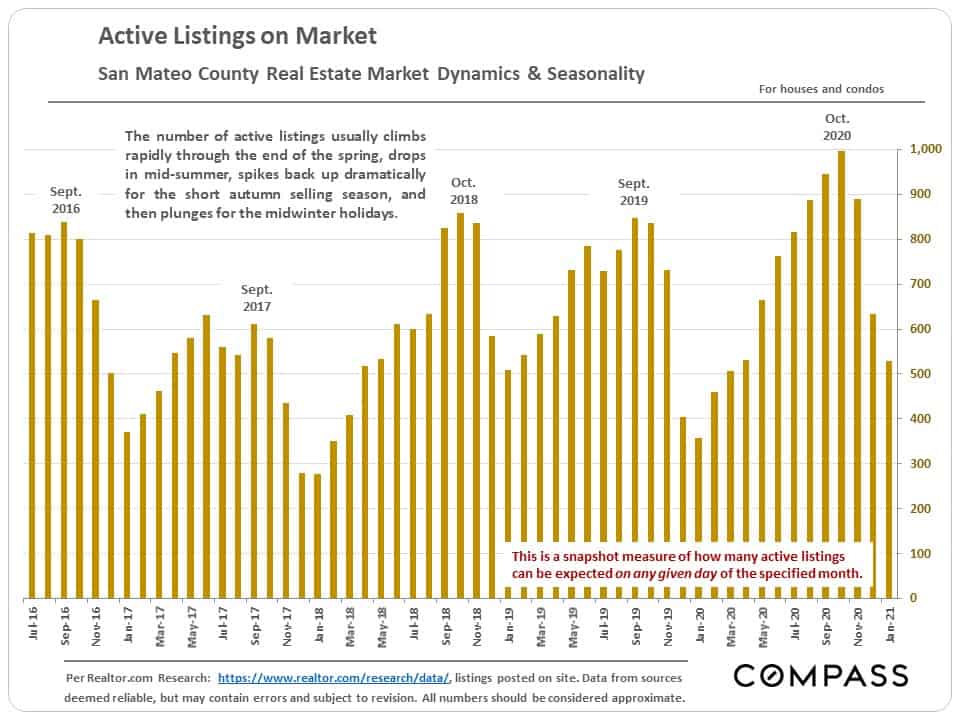
The number of active listings on the market typically climbs rapidly through spring. In January, inventory was running about 48% higher than in January 2020.
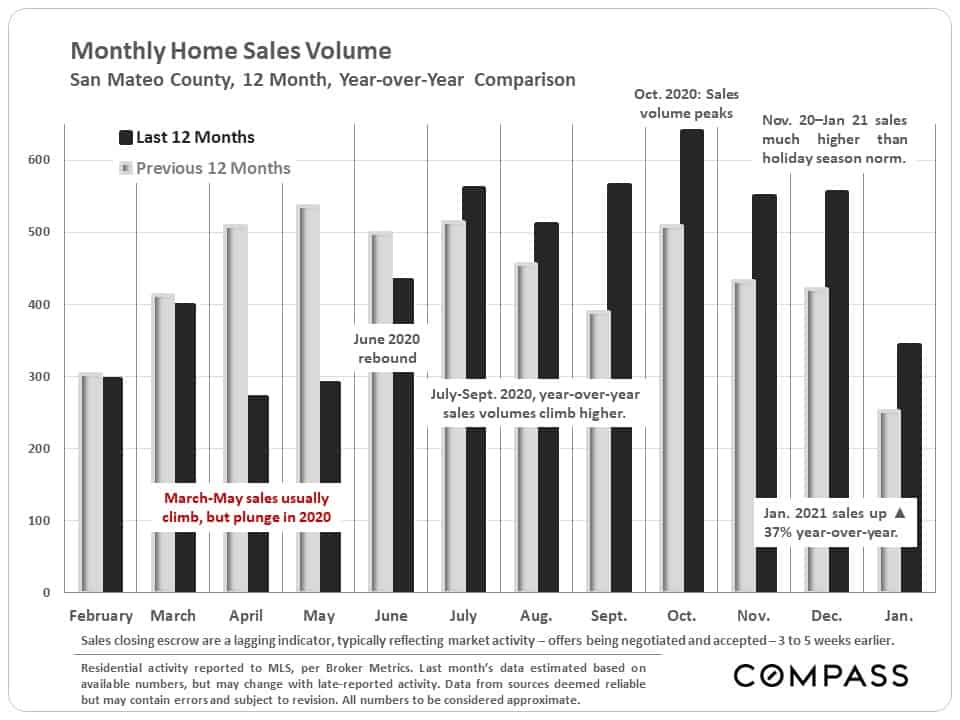
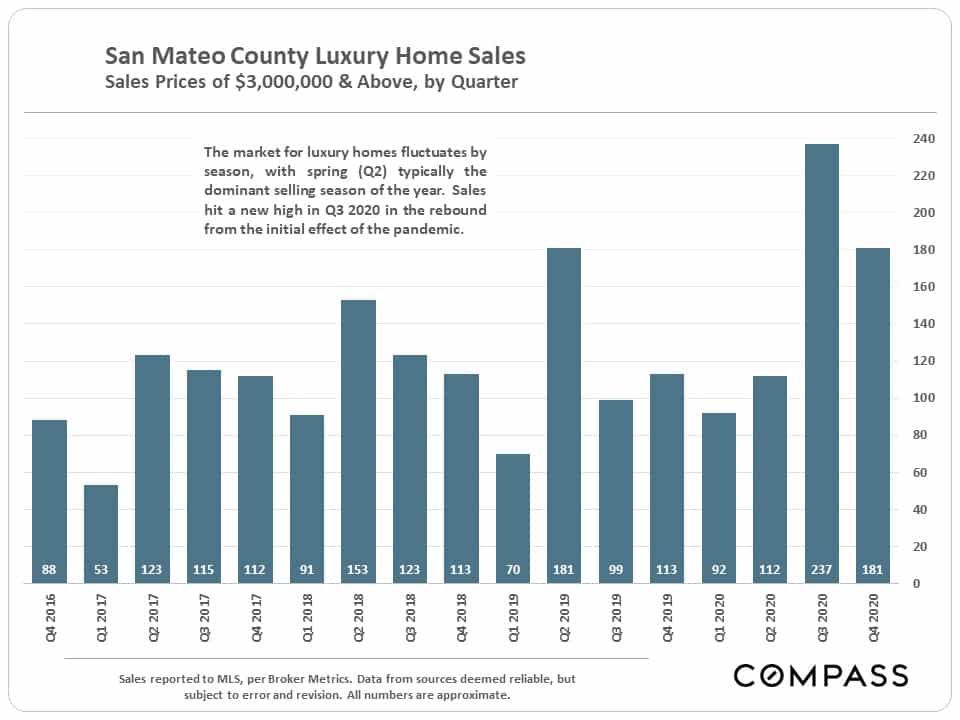
Month by month, year-over-year comparison of home sales volumes – illustrating the initial pandemic crash in activity followed by the market rebound that saw monthly sales volumes climb well above the levels of the previous year.
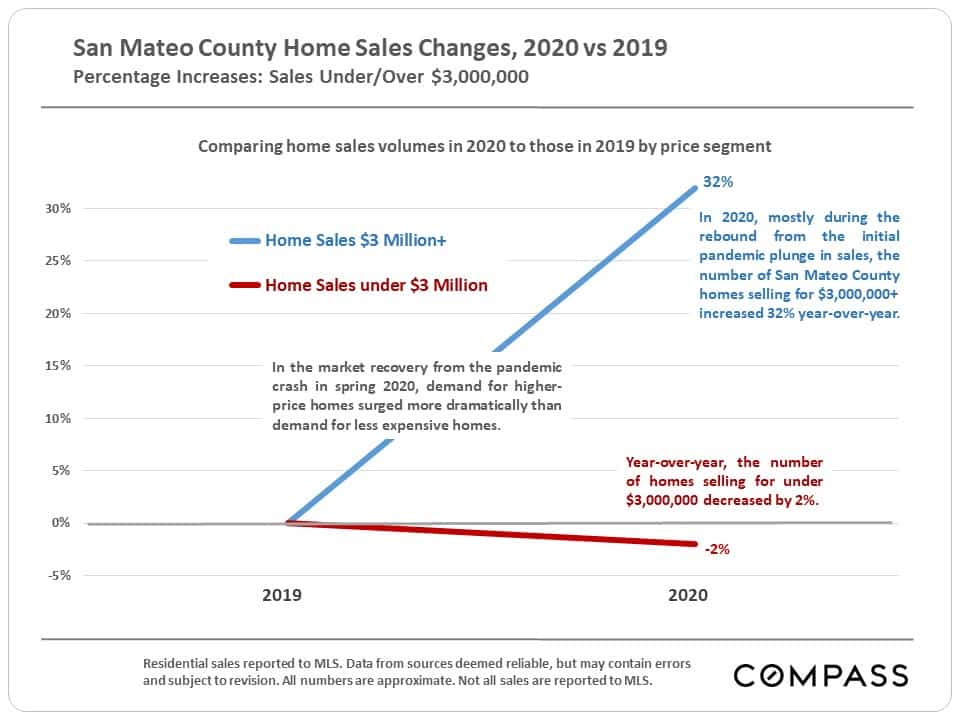
In 2020, year-over-year sales of homes $3 million and above saw a significant increase, while the sales volume of homes below that threshold actually declined a little. However, neither statistic does justice to the rapid acceleration in market activity occurring in the second half of the year.
Big jumps in high-price home sales were common around most of the Bay Area last year after the pandemic hit.
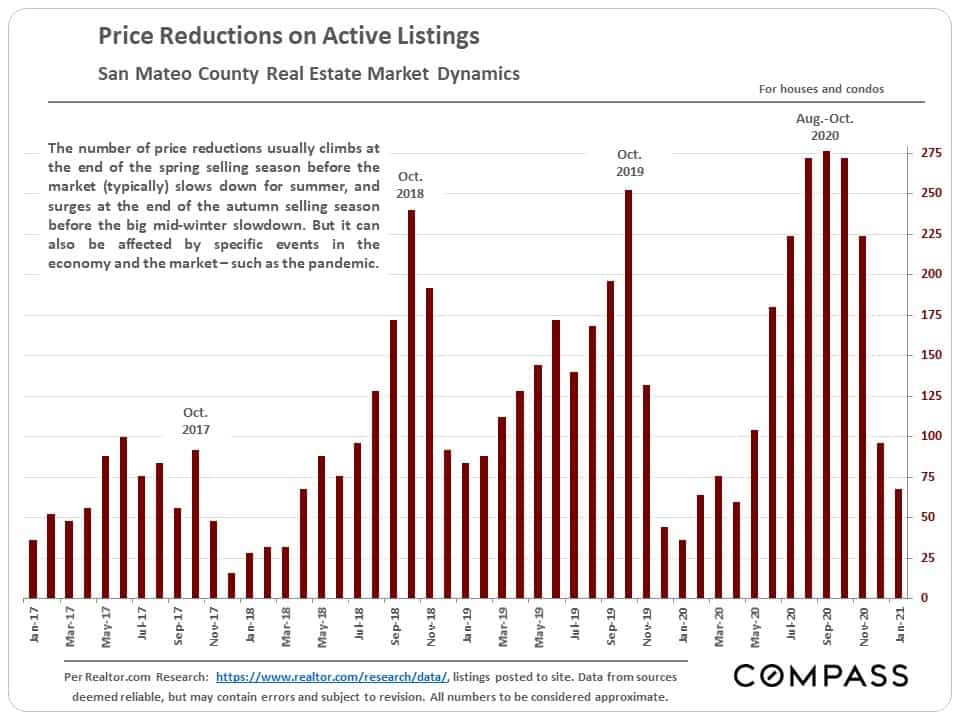
The number of price reductions has dropped rapidly from the peaks it hit in late summer, early autumn.
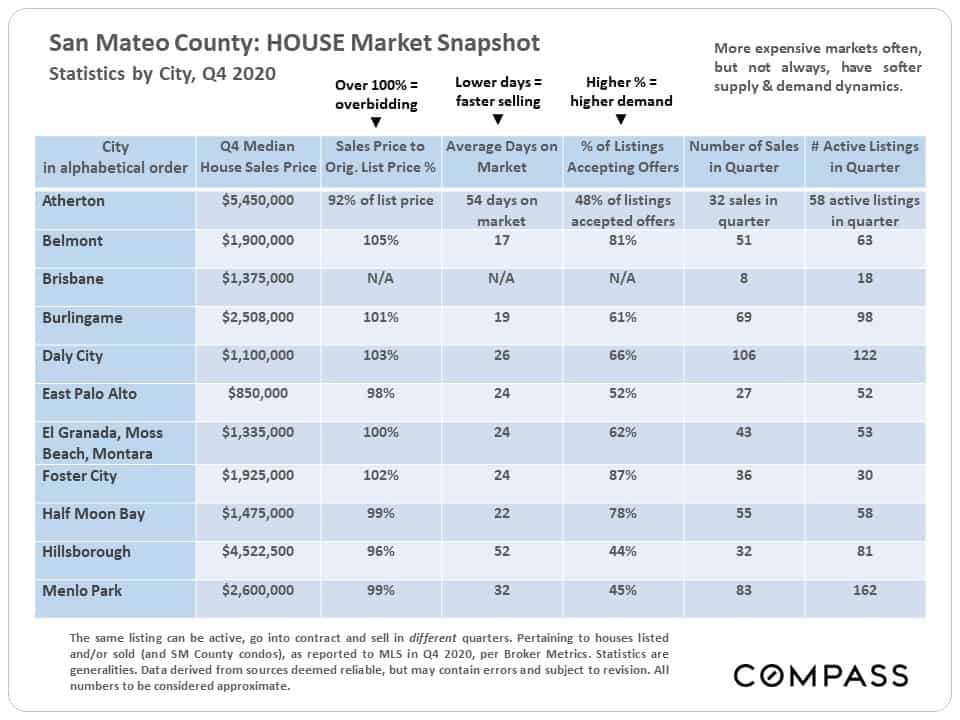
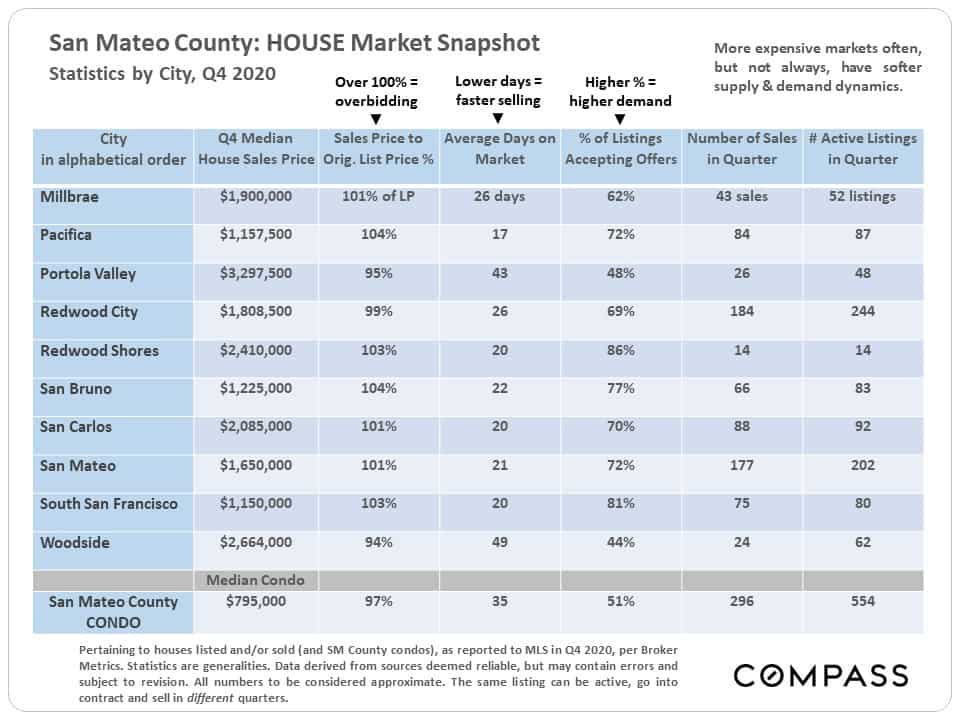
The 2 tables below reflect market statistics and values for Q4 2020 only, which will often be different than those for the full year 2020. It is not unusual for more expensive markets to have softer supply and demand statistics – such as higher average days on market figures, and lower percentages of listings accepting offers within the period – though this is not always the case.
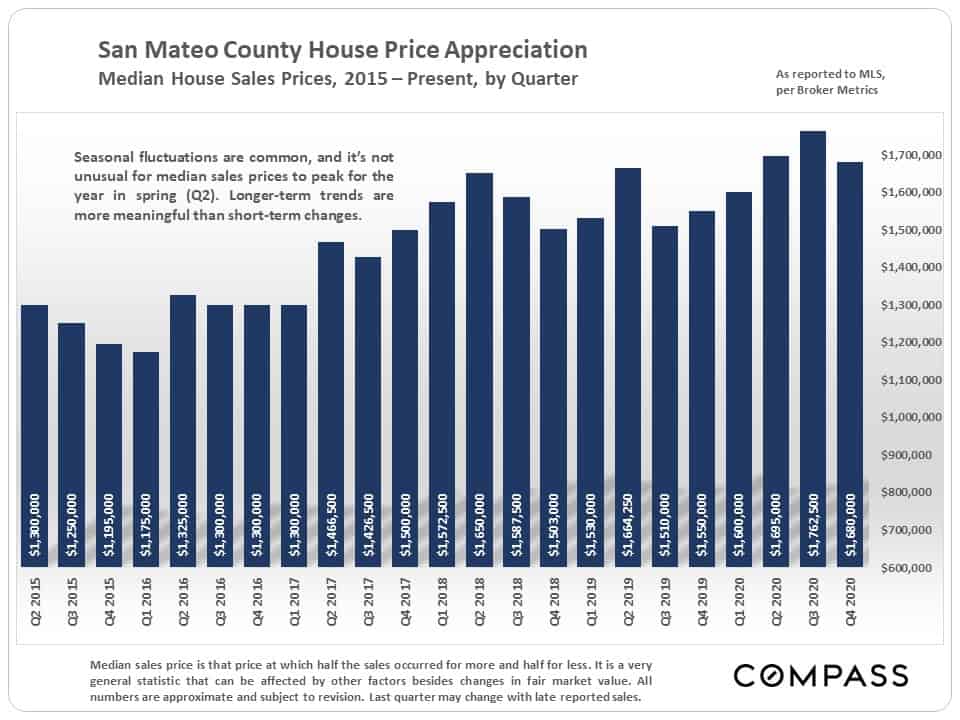
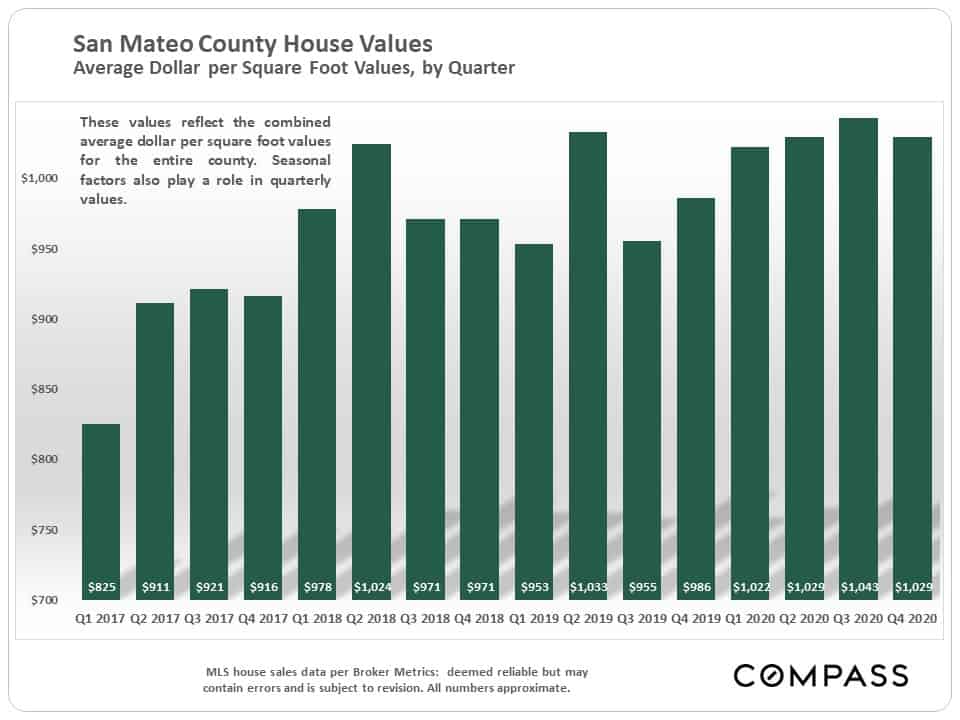
Median sales values can fluctuate for a number of reasons, and are especially prone to do so in markets with low sales volumes.
Luxury home sales by city and price segment:
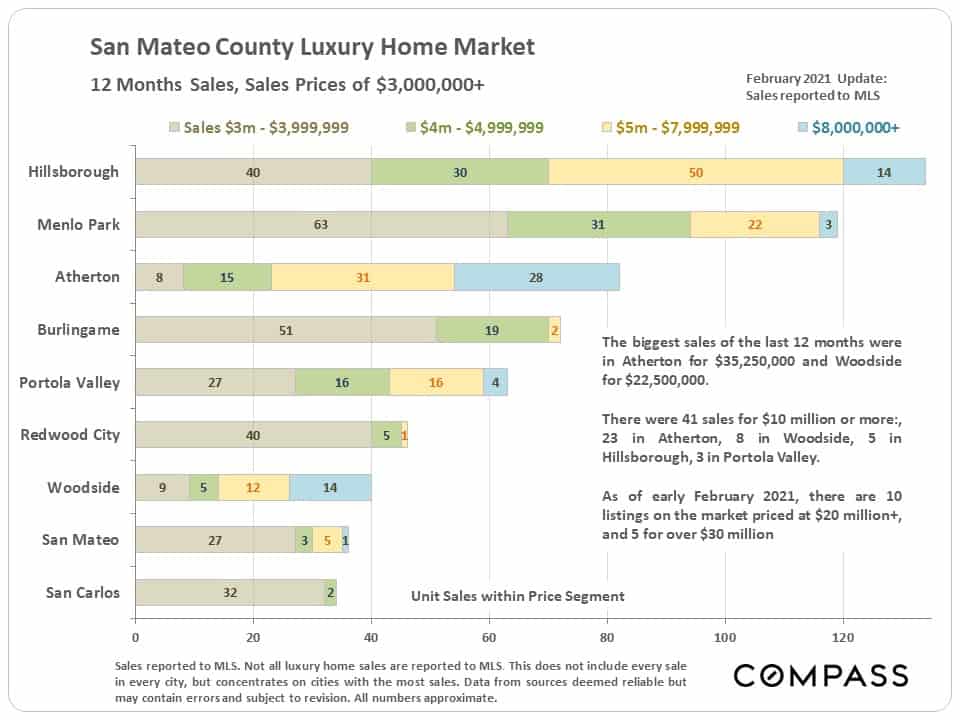
The most dramatic surge in luxury home sales occurred in the third quarter of 2020 – a factor in the Q3 peaks in median sales price and average dollar per square foot values illustrated in the first 2 charts of this report.
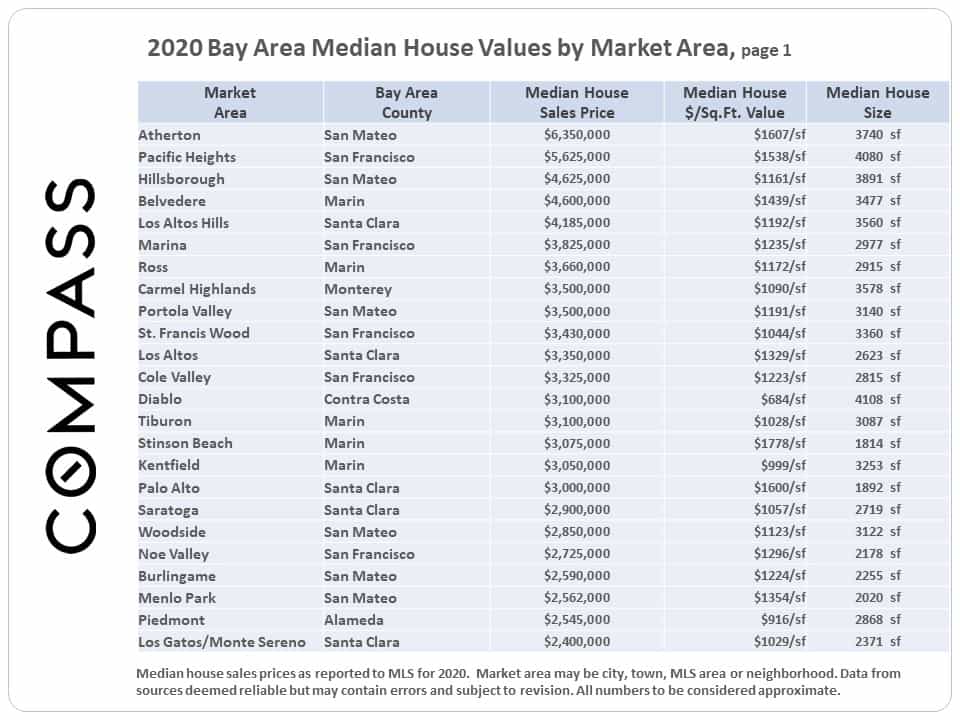
Below is the first table of a full-year 2020 home value analysis of markets around the Bay Area, ranked by median sales price, highest to lowest. The peninsula has a large footprint at the top of the list. The full report and home price map are here: Bay Area 2020 Home Prices.
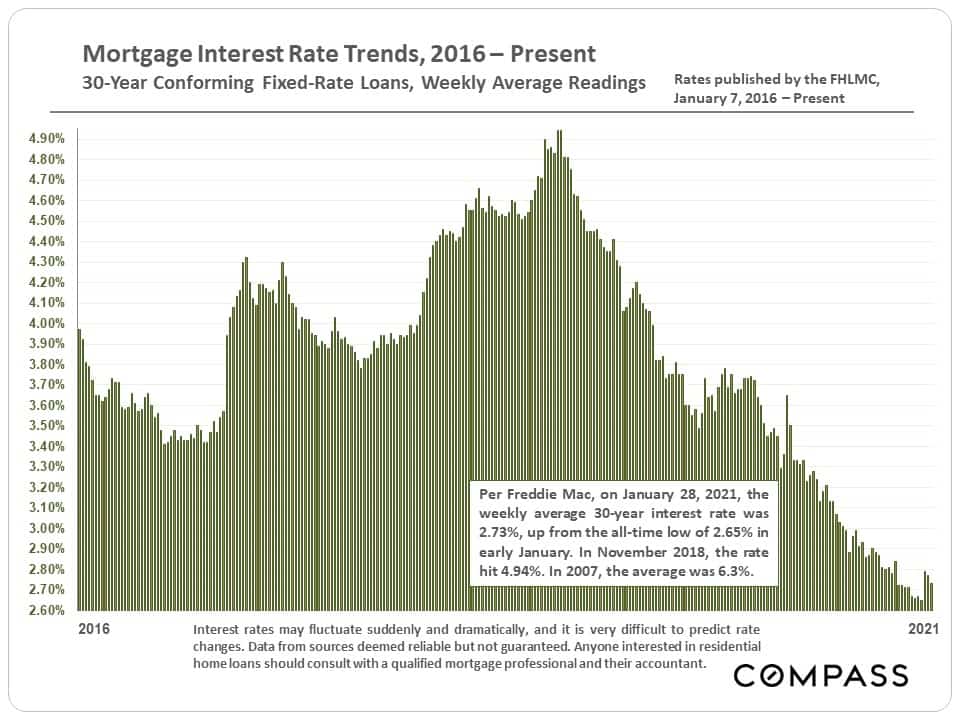
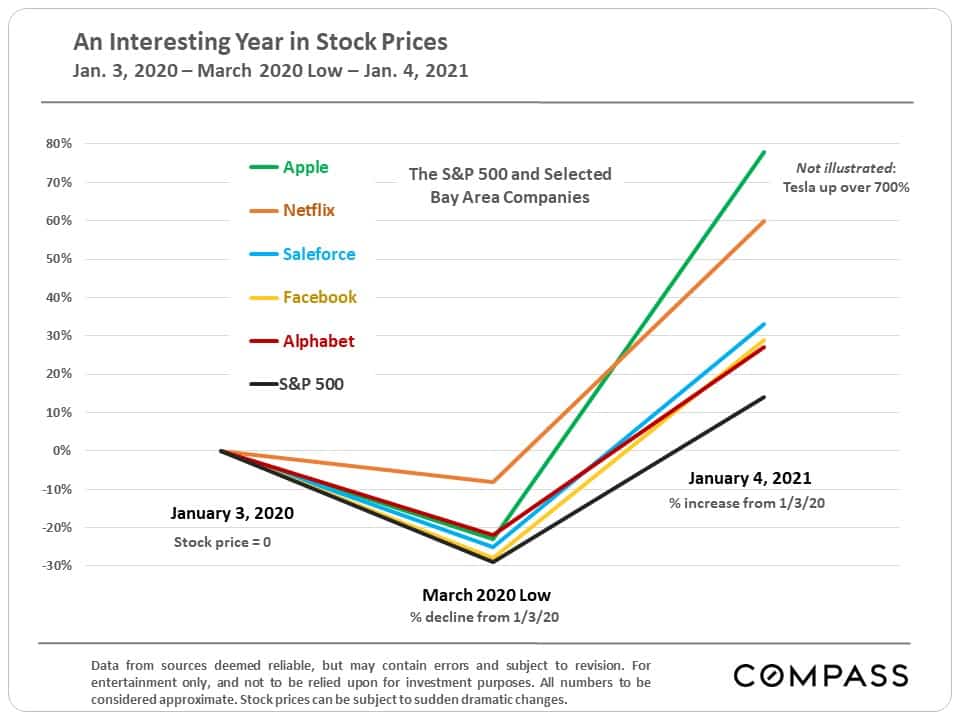
Two of the factors behind the housing market recovery after the pandemic first hit were the dramatic drop in interest rates, and the significant rebound in the stock market – especially in the stocks of some of our local high-tech giants.