San Mateo County August Real Estate Market Report 2020

San Mateo County Real Estate
Market Report
Virtually all market indicators reflect strong market conditions. Luxury home sales soar.
August 2020
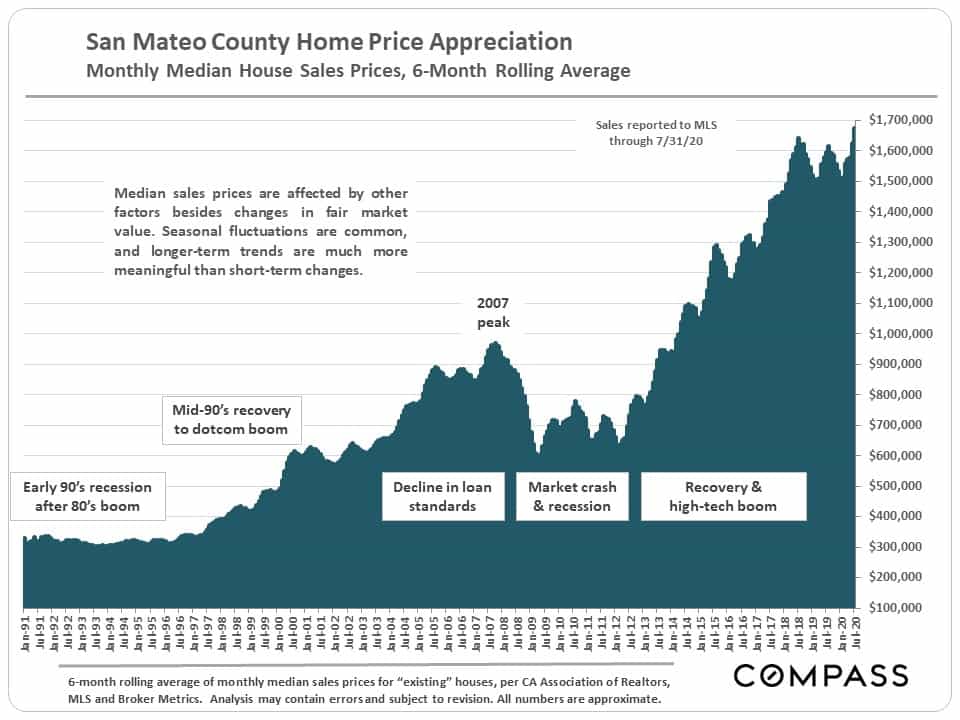
Median House Sales Price – Long-Term Trends
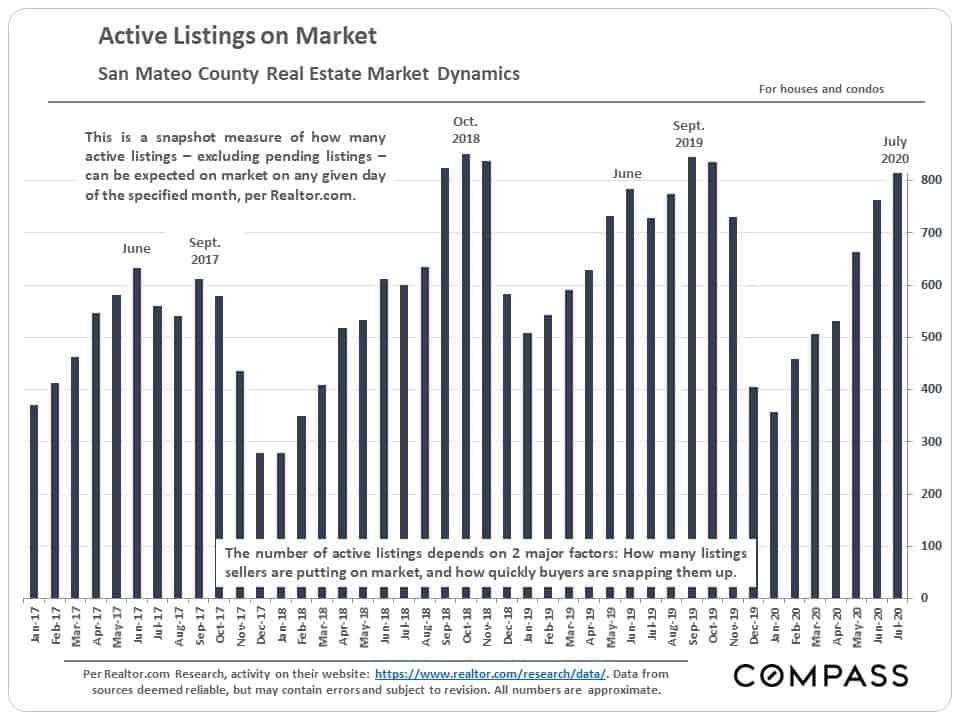
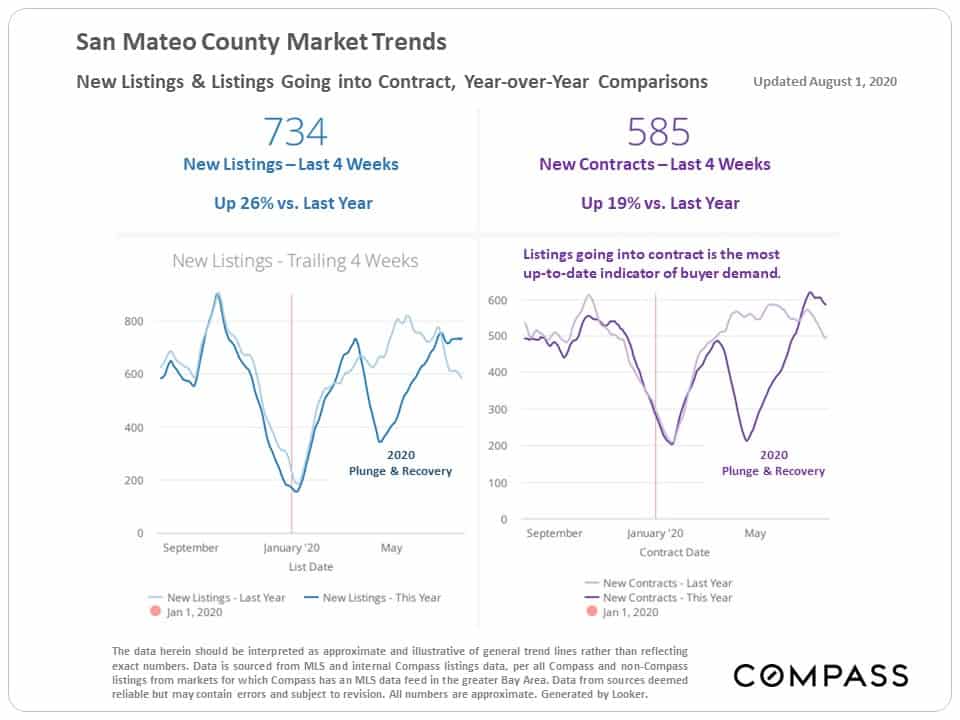
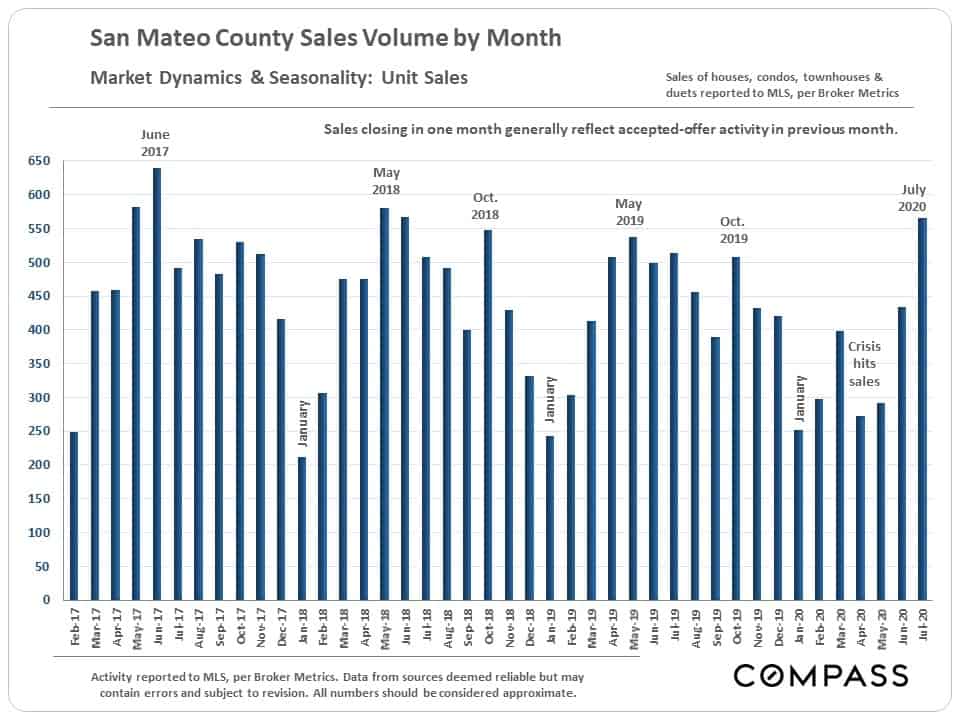
Supply & Demand
Inventory, listings accepting offers, and closed sales volume are all well up from the low points earlier this year.
Standard Market Indicators
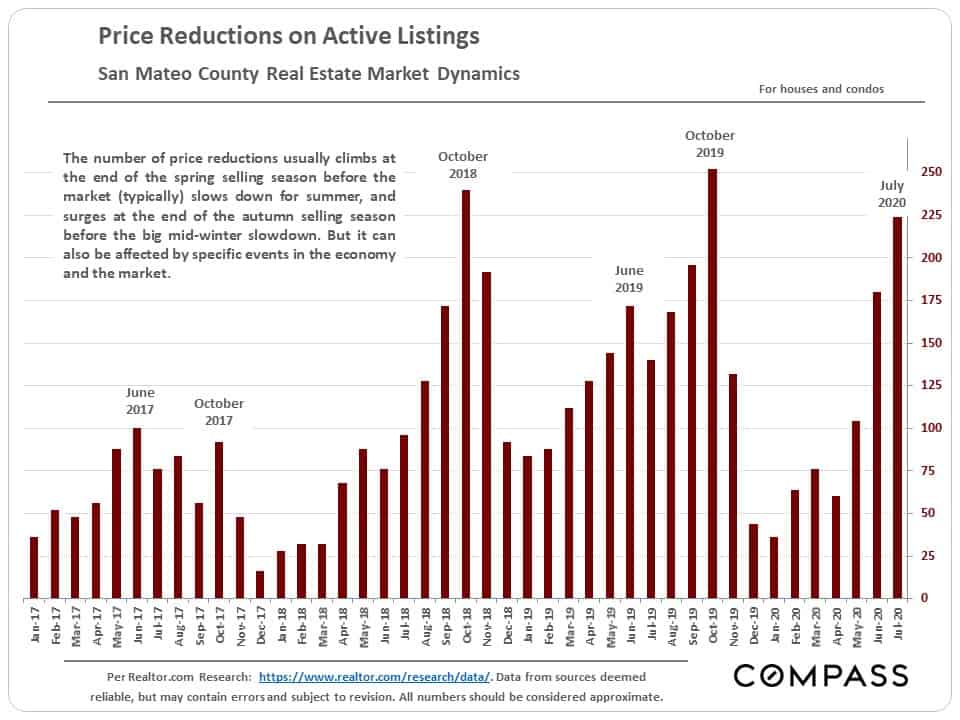
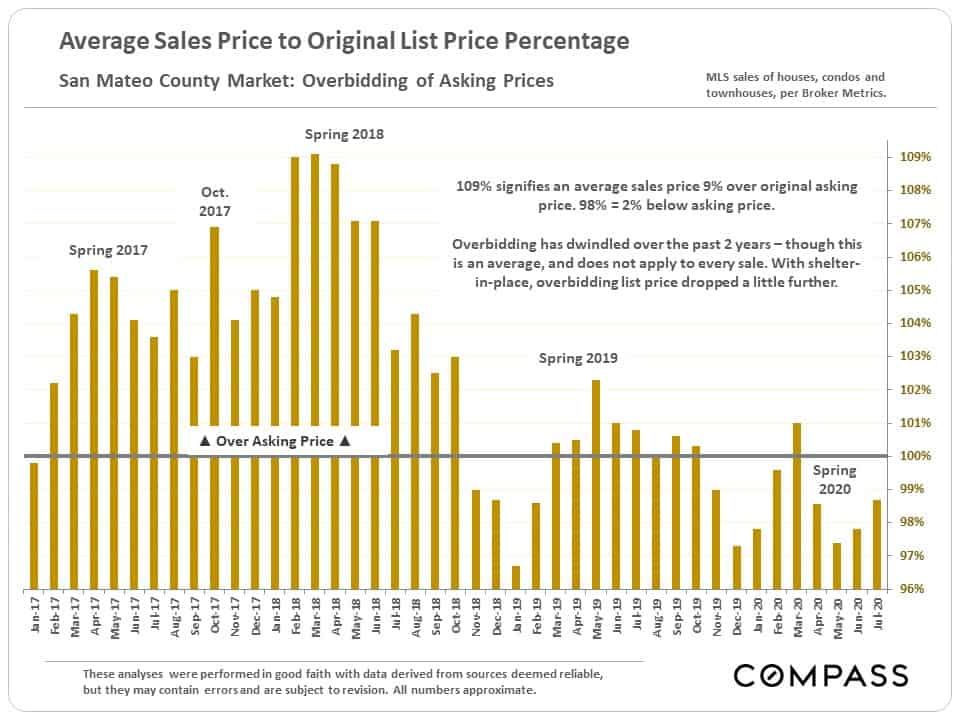
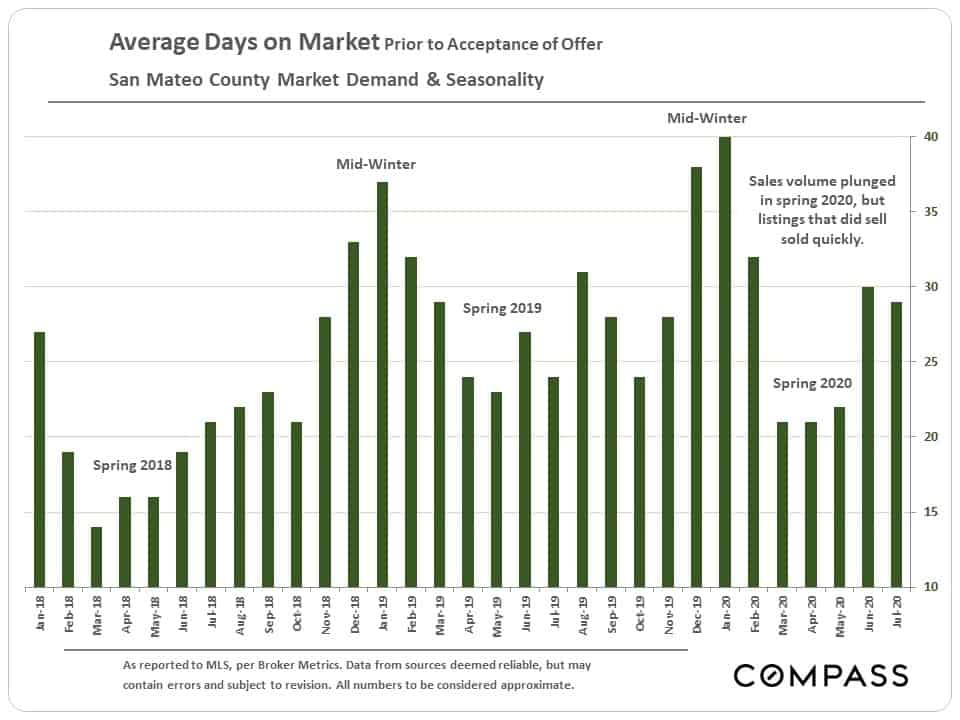
There are indicators of some softening in the market: Year-over-year, the number of price reductions is up (chart 1); the average sales-price-to-list-price percentage is down (chart 2); and average days on market are somewhat higher, but still wouldn’t be considered high (chart 3).
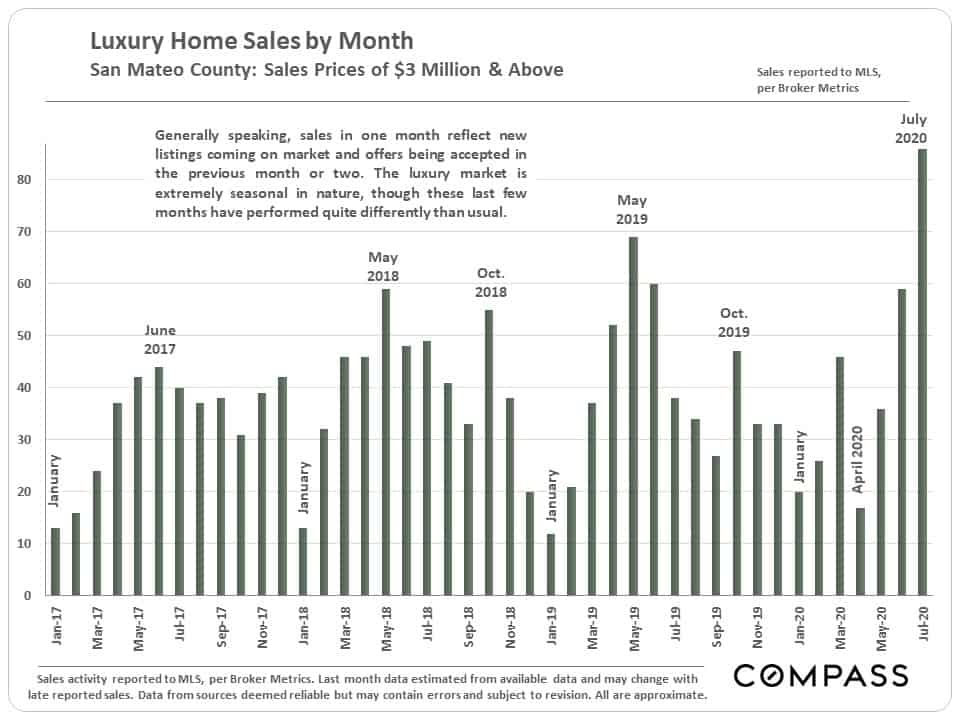
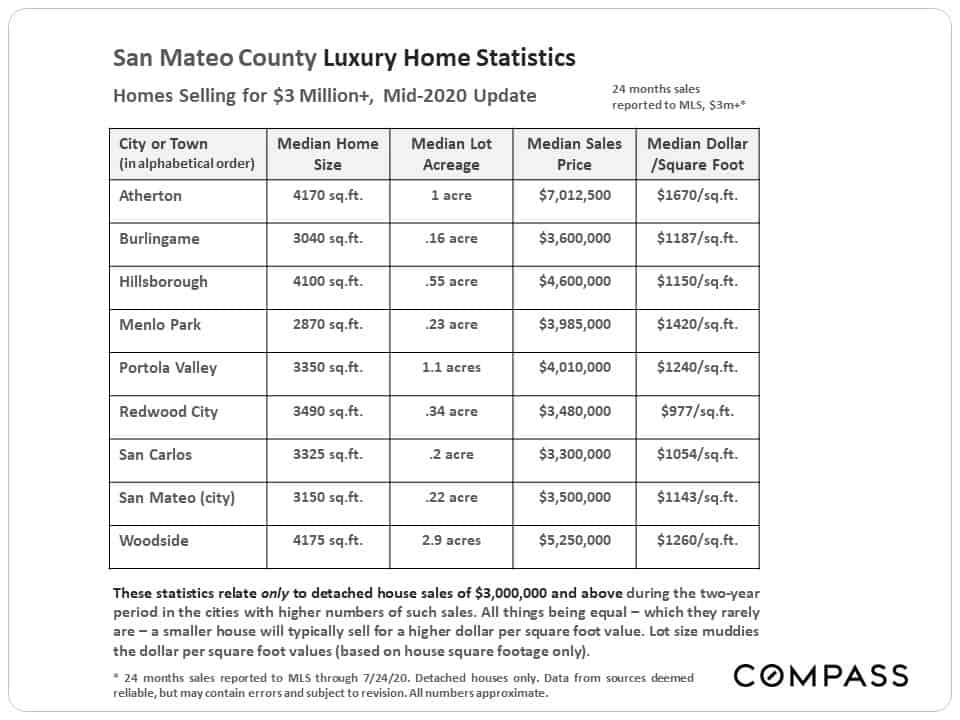
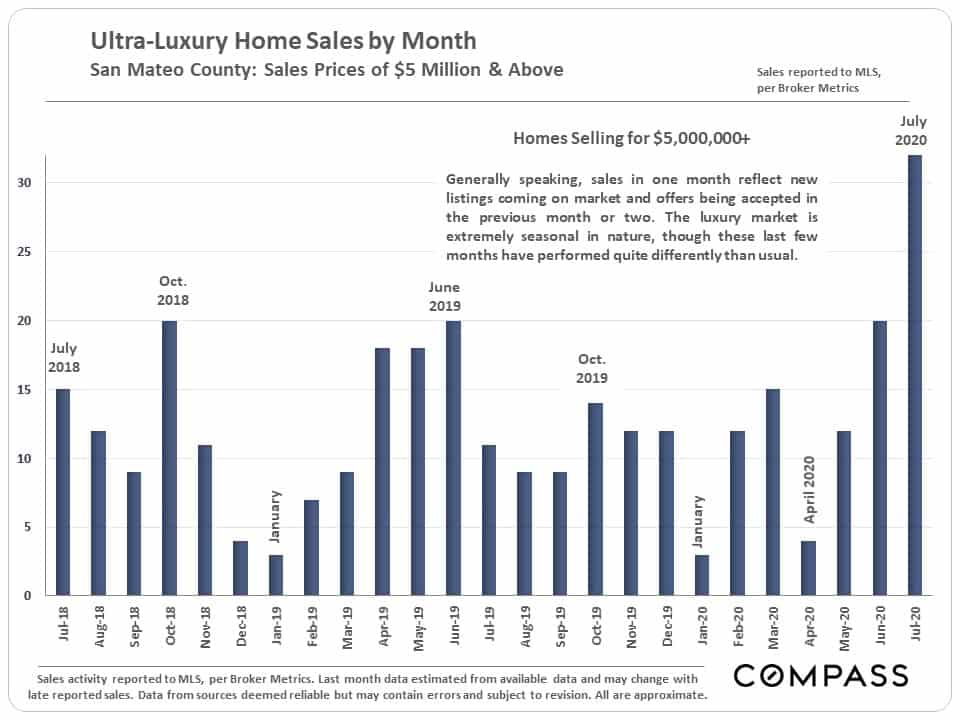
Luxury Home Sales
Summer has seen a big spike in high-end home sales.
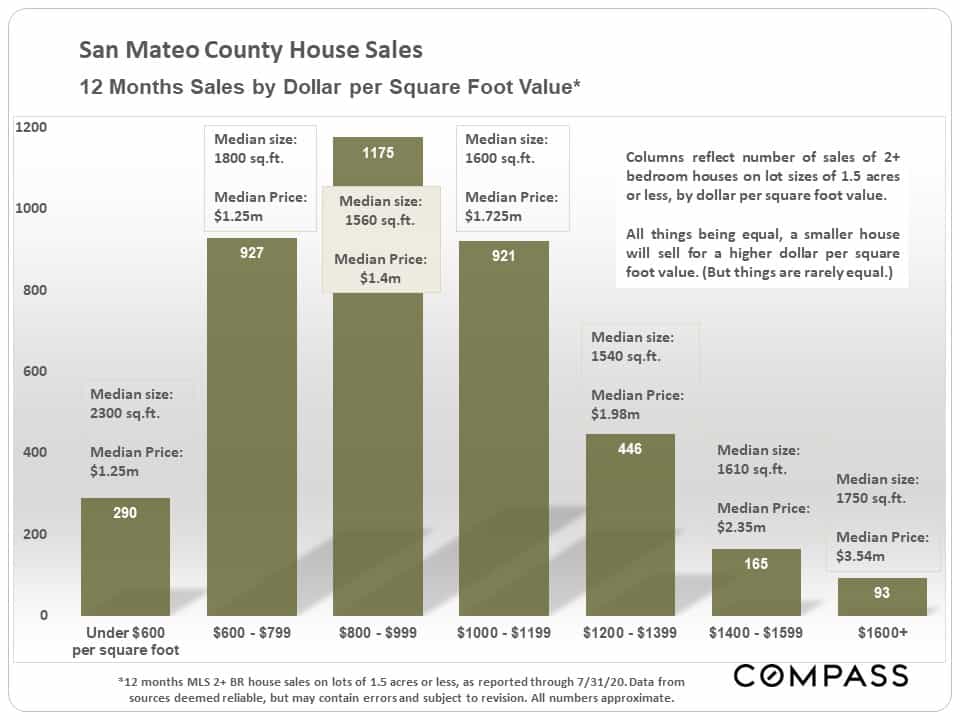
House Sales by Dollar per Square Foot Value
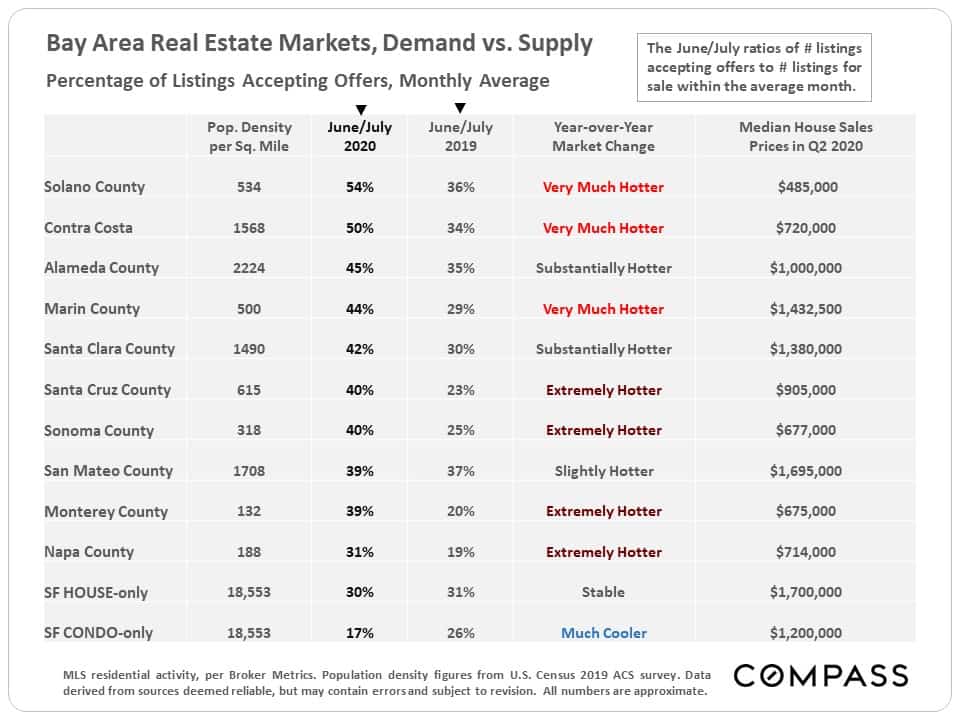
Bay Area Market Comparisons by County
This table ranks each county by the percentage of active listings going into contract in June/July 2020 – a standard statistic of market heat – compares it to the same period of last year, and then rates the year-over-year change. By this indicator, San Mateo County was the strongest market in the Bay Area one year ago. It is slightly hotter this year, but many other counties have seen very dramatic surges in demand.