Oakland, Berkeley, Piedmont and Alameda November Real Estate Market Report 2020
Greater Oakland-Berkeley Region, Inner East Bay Real Estate Markets
November 2020 Report with Emphasis
on City Market Dynamics
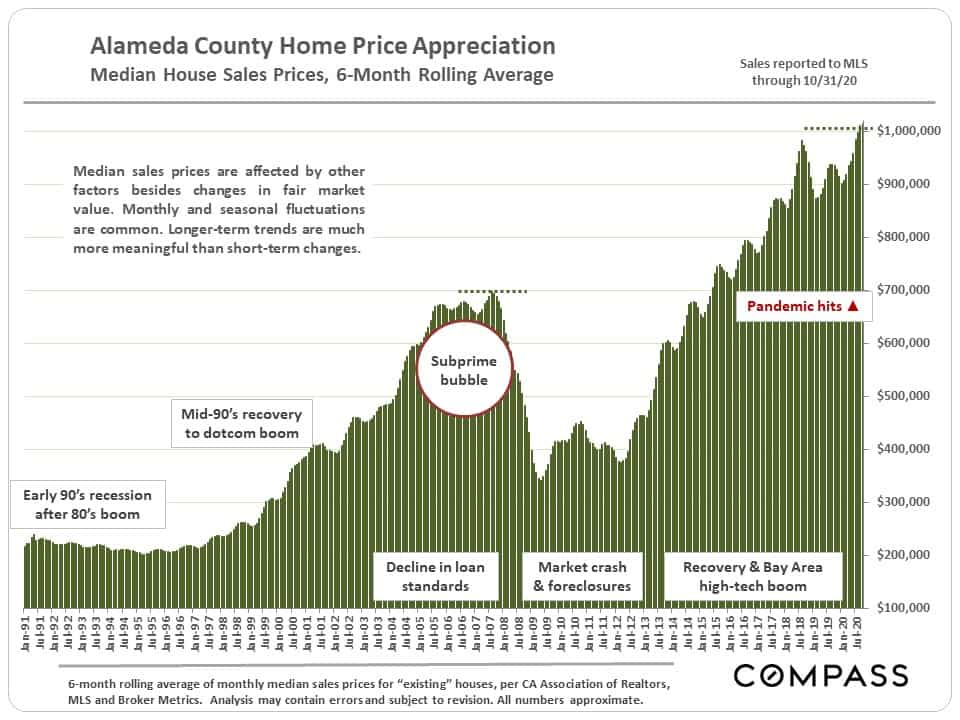
The first 2 graphs reflect Alameda County data, which generally tracks very close to Inner East Bay trends.
The long-term median sales price chart below is similar to those for most markets around the Bay Area – a significant spike in median house prices since the pandemic struck in early spring. (Generally speaking, Bay Area condo markets have not seen comparable increases in prices.)
As mentioned before, recent jumps in median house prices have been driven not only by appreciation in fair market values, but by increases in expensive home sales. Affluent buyers have made up a larger percentage of Bay Area home purchases since the pandemic hit.
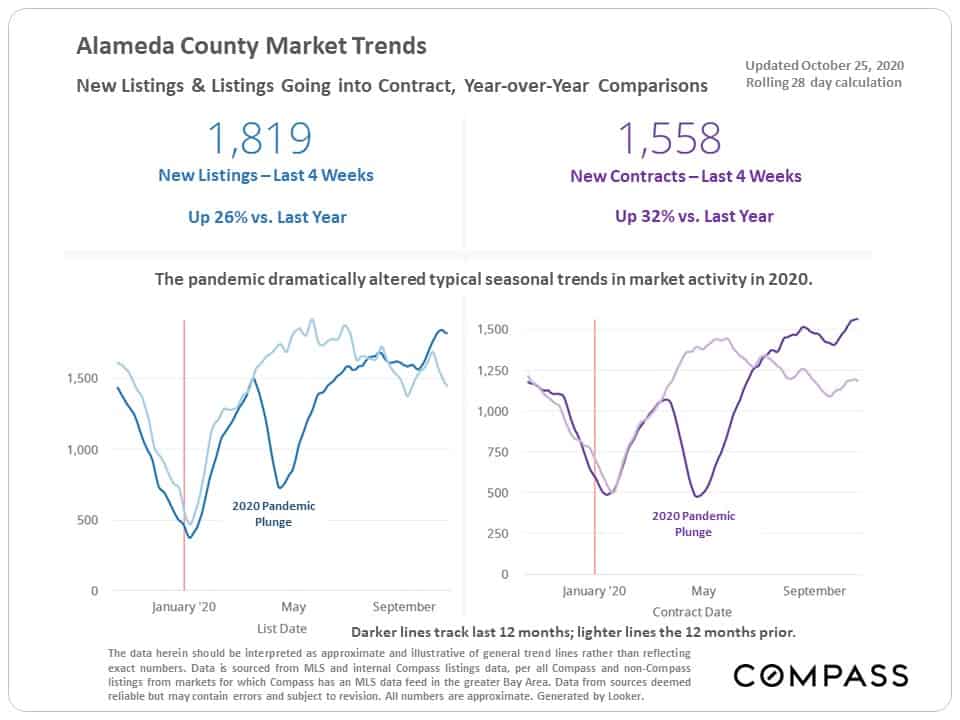
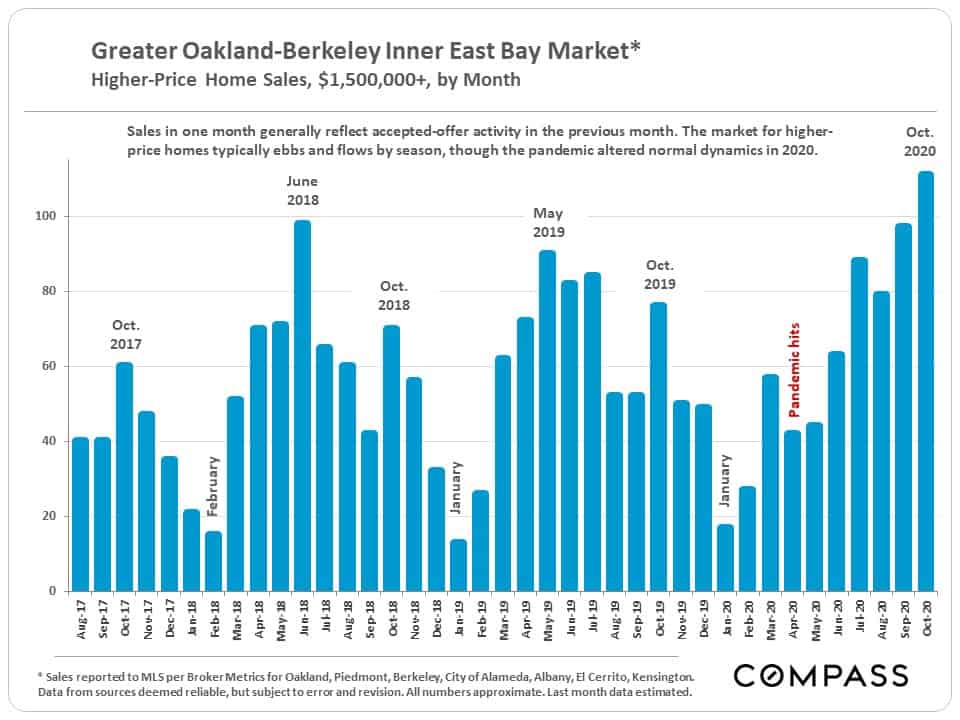
The market typically starts a big slowdown in mid-November, running through the mid-winter holidays, until it begins to wake up in mid-January: New listings and sales plummet, and listings pulled off the market soar. Higher-price segments normally see the most dramatic plunges in mid-winter activity.
This year, the pandemic upended seasonality: Spring, usually the strongest selling season, saw a crash in activity; summer, which typically slows down, saw high demand; and the heated summer market ran right into autumn.
We suspect late Q4 will see something of a slowdown, but remain more active than in past years.
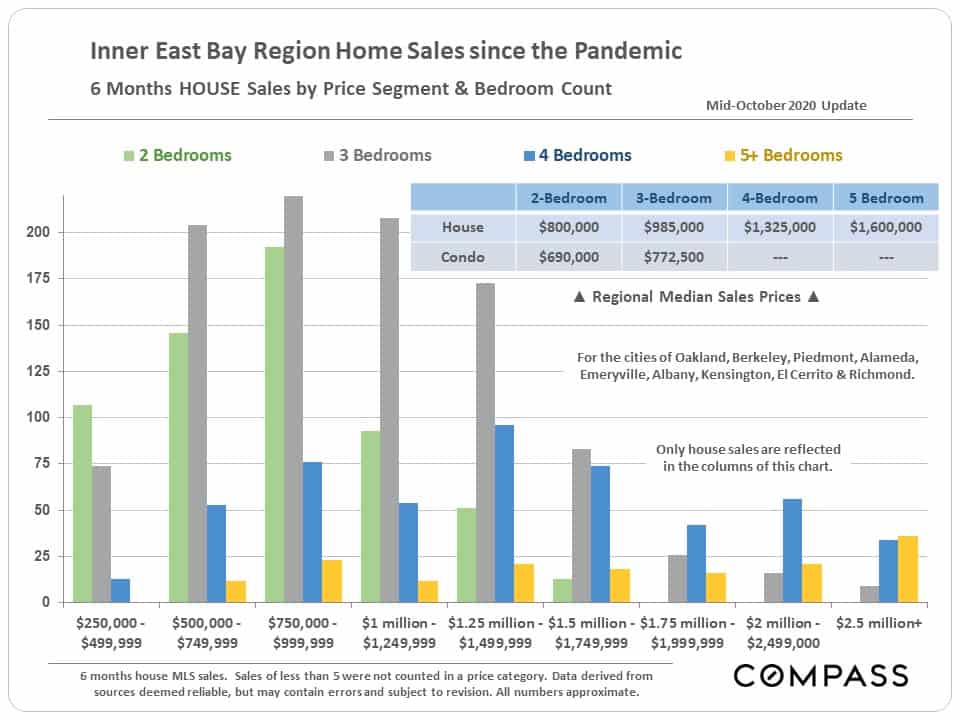
Home Sales Breakdown by Price & Bedroom Count
Higher-Price Home Sales, $1,500,000+, by Month
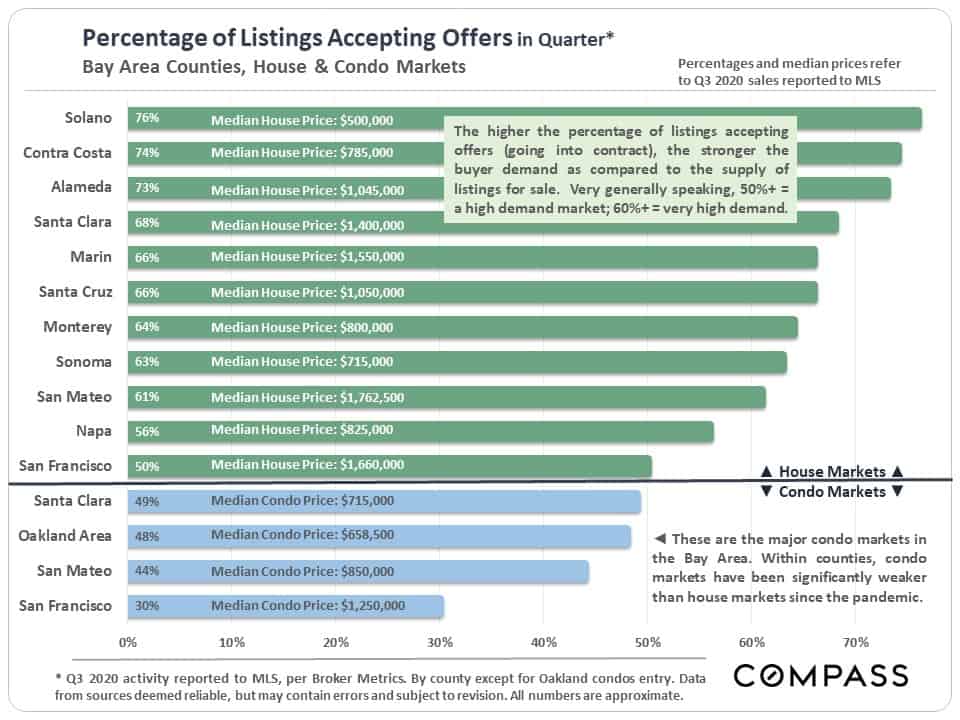
Measuring Demand by Bay Area County
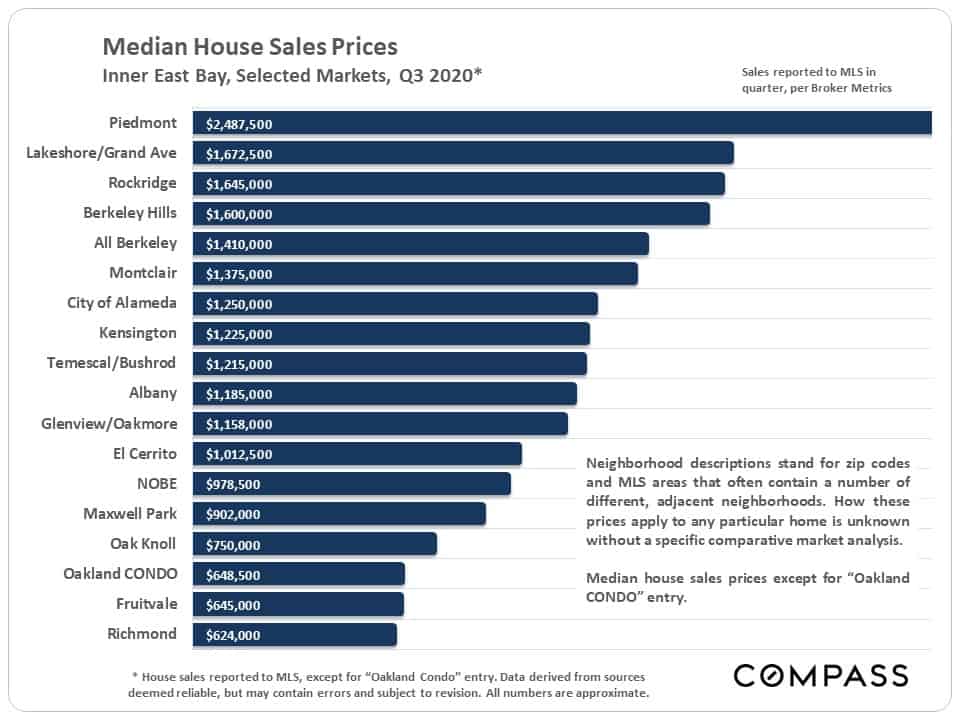
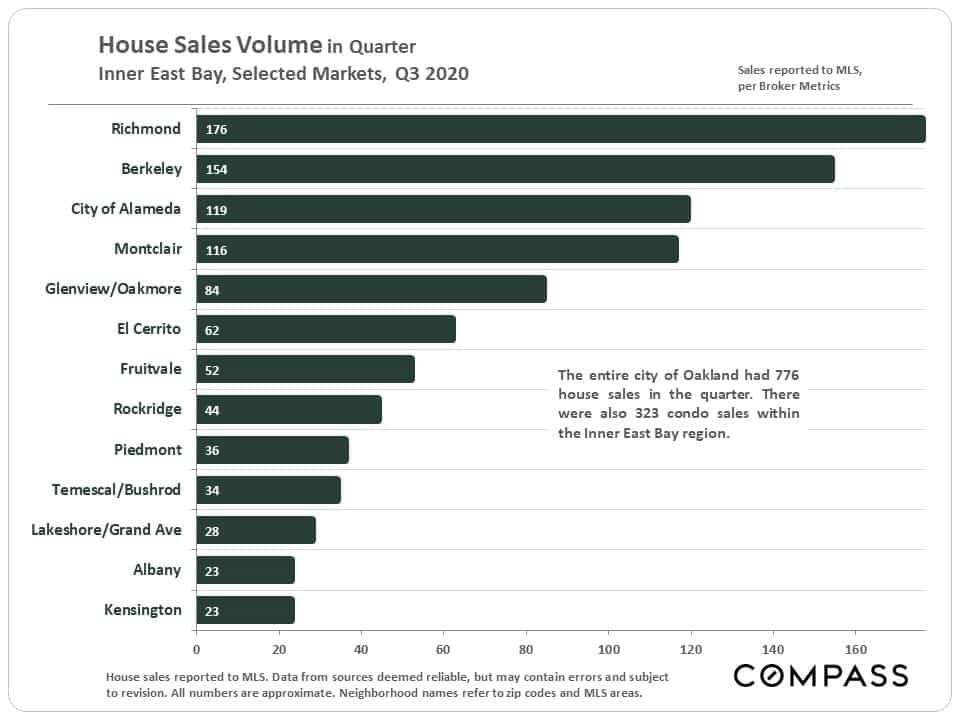
Market Dynamics by City & Selected Neighborhoods
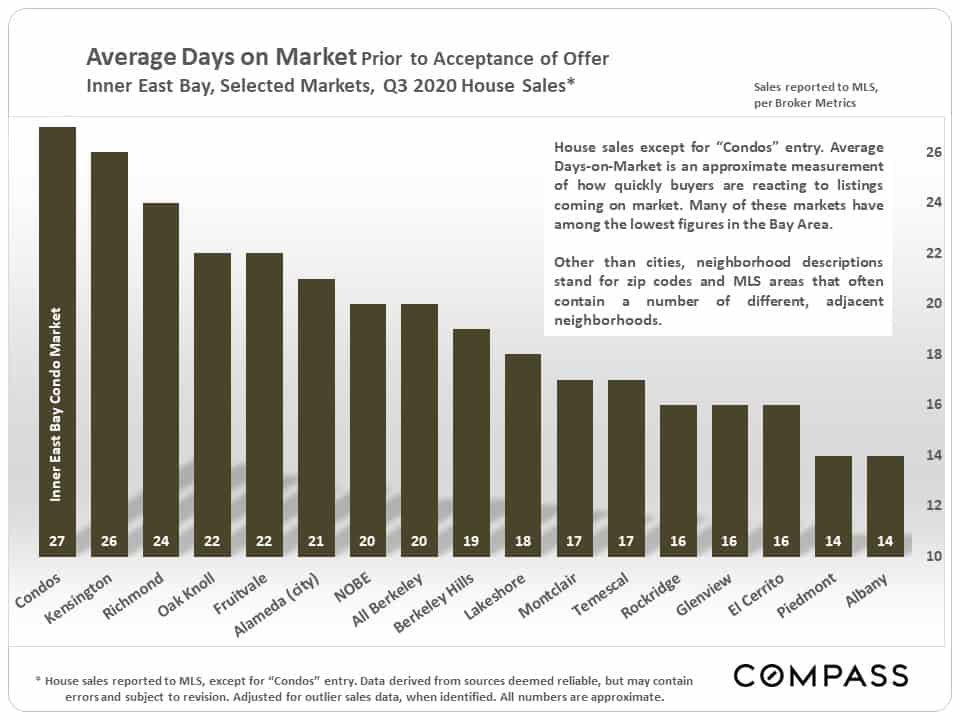
Following is a series of analyses that look at city and neighborhood sales volumes, median sales prices, and a few standard measurements of supply and demand.
The condo market has been broken out in some of these – around the Bay Area since the pandemic, demand for condos has generally been significantly softer than demand for houses.
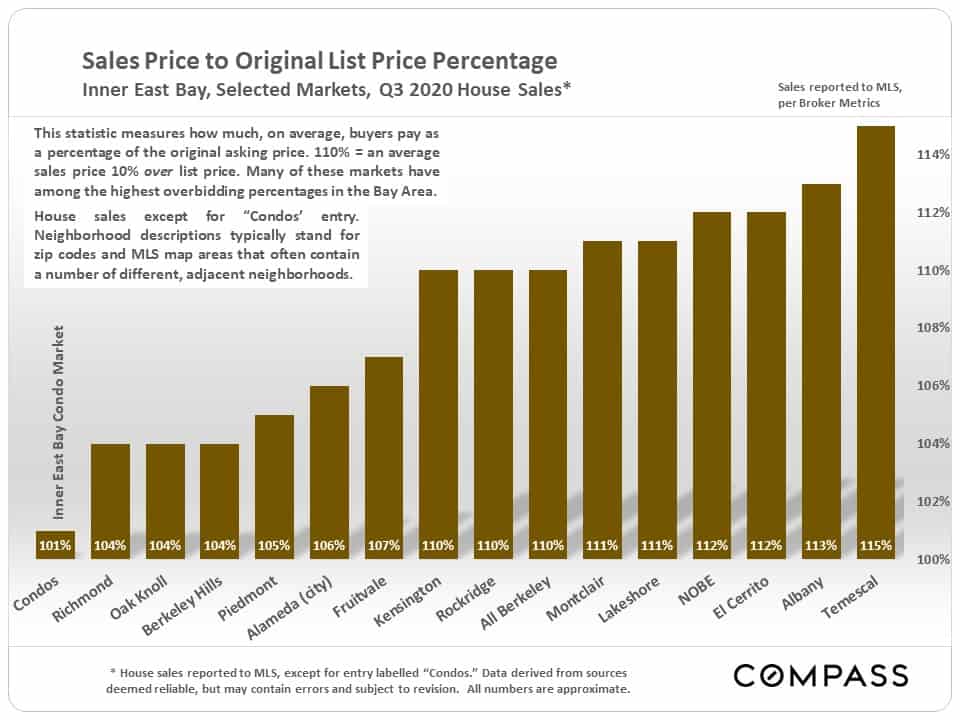
Regarding the next chart: Percentages of 50% or more would typically be considered to reflect a high-demand market. Over 60% signifies very high demand, or as it climbs, extremely high demand.
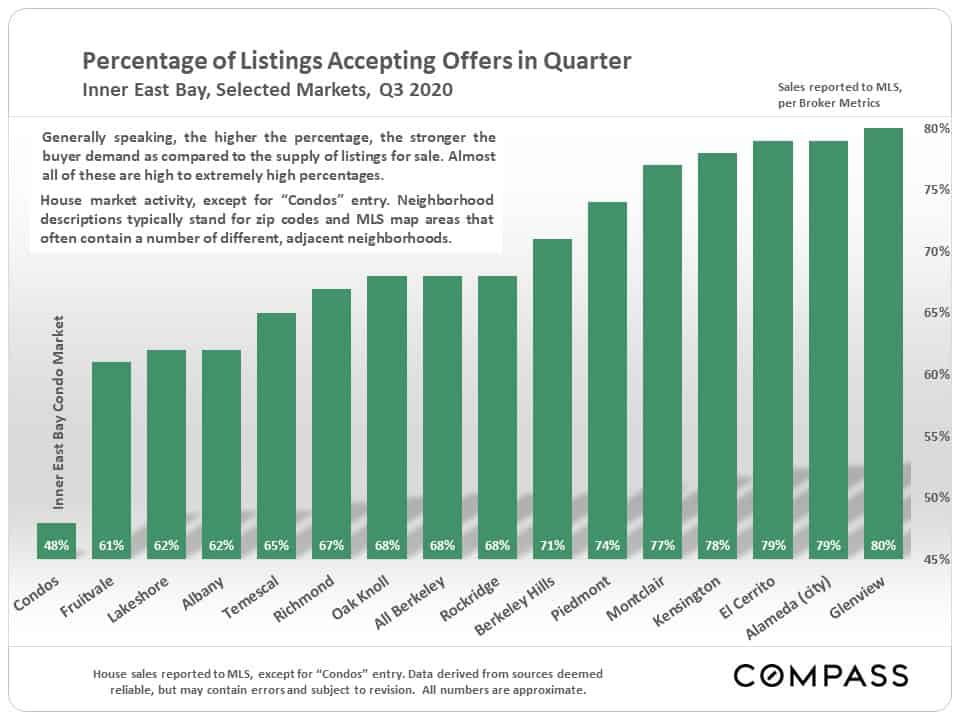
The Inner East Bay region continues to see the highest overbidding percentages in the Bay Area.