Oakland, Berkeley, Piedmont and Alameda June Real Estate Market Report

Oakland, Berkeley, Piedmont
& City of Alameda Real Estate
The Strongest Market in the Bay Area: Median Home Sales Prices & Luxury Home Sales Hit New Peaks
June 2019 Market Report
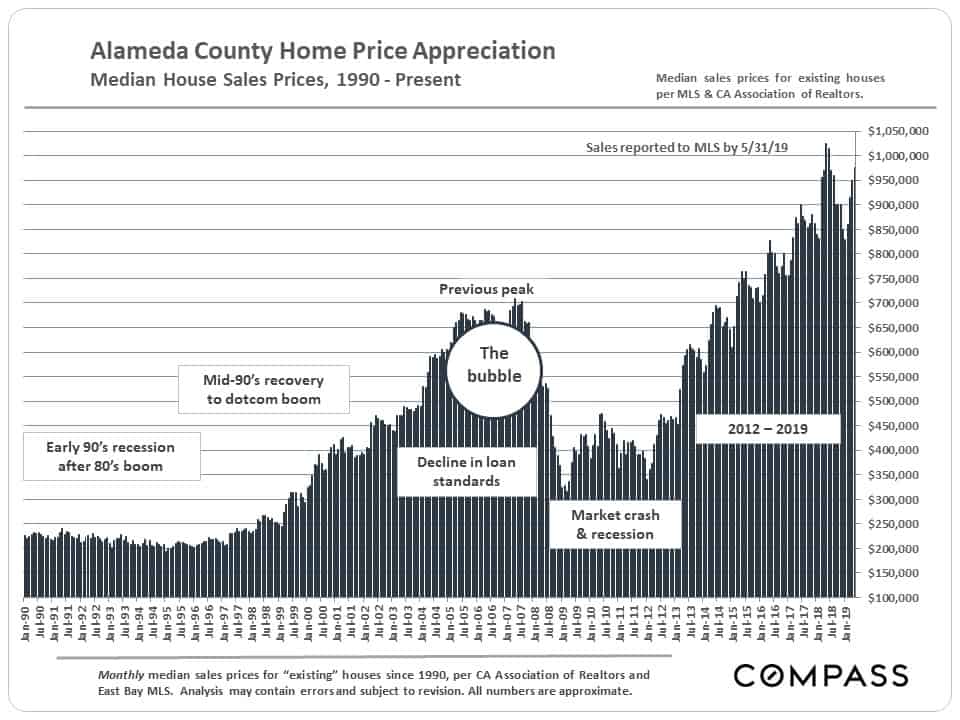
Alameda County: Long-Term Median Price Trends
The greater Oakland-Berkeley area is now actually out-performing Alameda County as a whole, but this is an excellent illustration of overall home-price trends since 1990.
Oakland, Berkeley, Piedmont, City of Alameda:
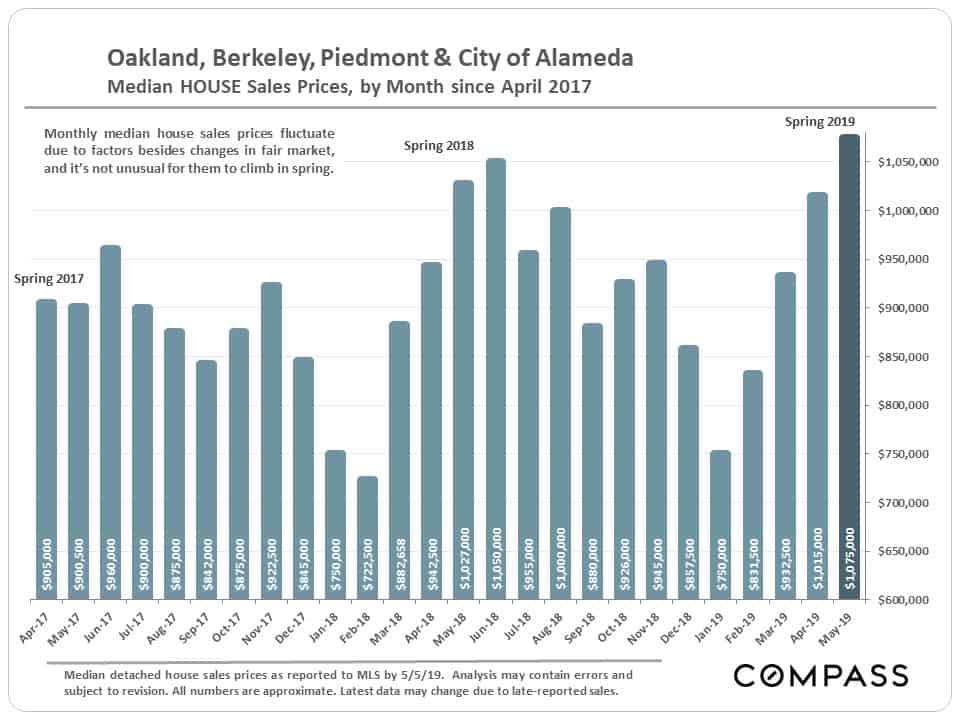
Short-Term Median Home Price Trends
The combined median house sales price for the 4 cities in May 2019 ticked above the previous peak in June 2018. In the last 2 years, June has seen the annual high in median price, so perhaps we shall see another increase in June 2019. (June closed sales mostly reflect accepted offers in May.)
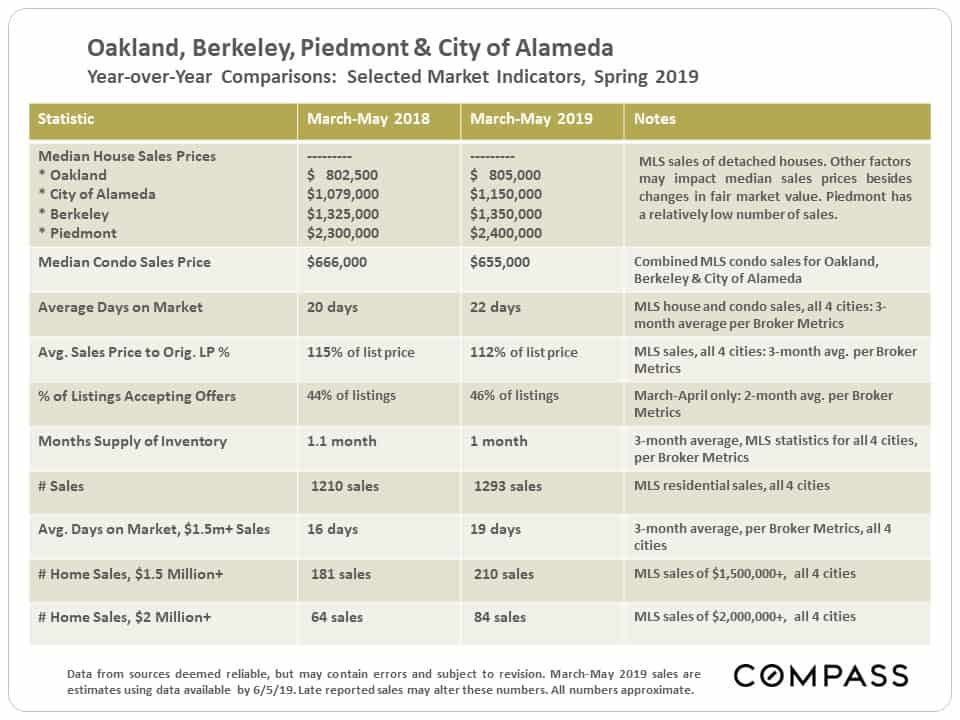
Year-over-Year Comparisons, March-May
Many Bay Area markets have been distinctly cooler as compared to the very hot spring 2018 market, and some have seen declines in median home sales prices. San Francisco and San Mateo have remained strong year over year – we may be seeing the IPO effect here – but by virtually every standard measurement, the greater Oakland-Berkeley region is the highest-demand market in the Bay Area.
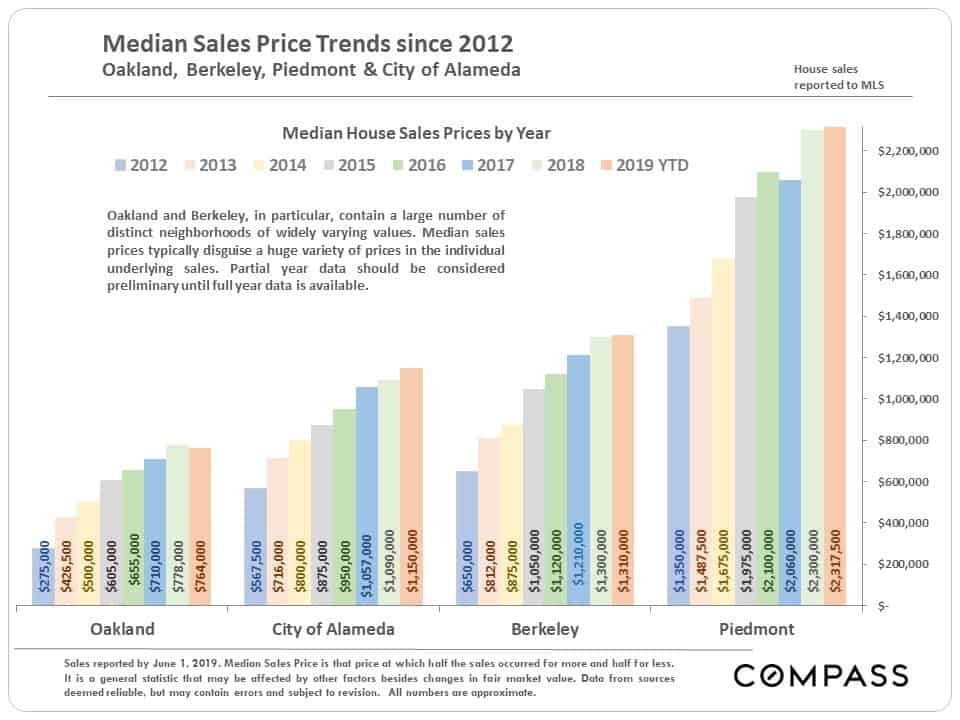
Annual Median Home Price Changes by City
Comparing annual median home prices to partial year prices is not really an apples-to-apples comparison because of the effect of market seasonality on sales prices, but the below analysis is still an interesting indicator of home-price trends. However, full-year 2019 median home prices may be significantly different than the year-to-date figures.
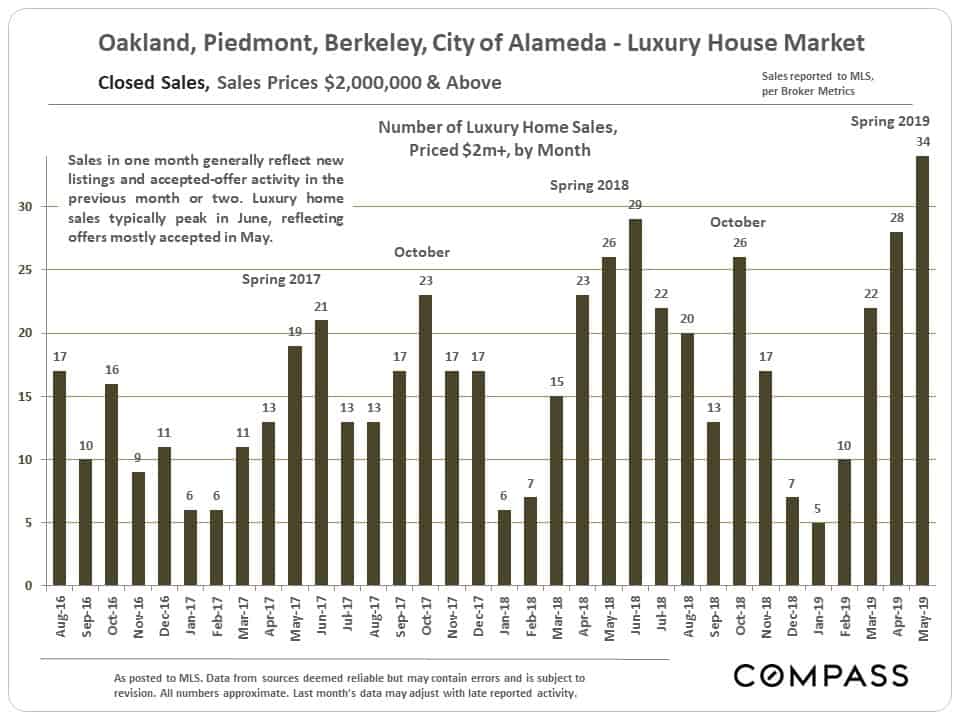
Luxury Home Sales, $2,000,000+
May 2019 saw the highest monthly number of homes selling for $2 million and above ever. San Francisco and San Mateo Counties also hit new highs in luxury home sales.
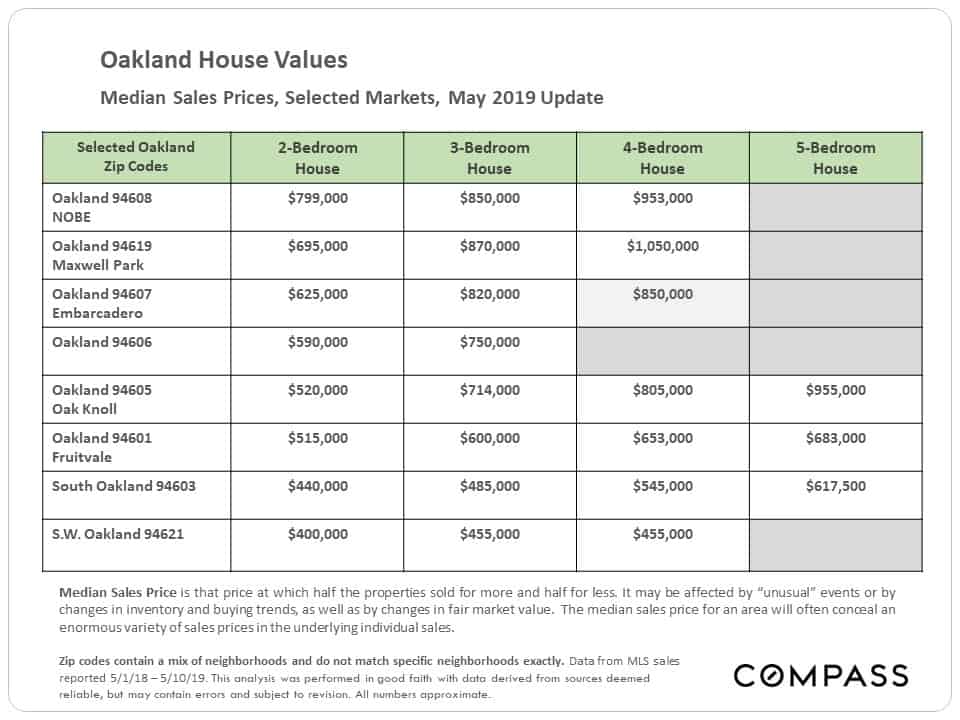
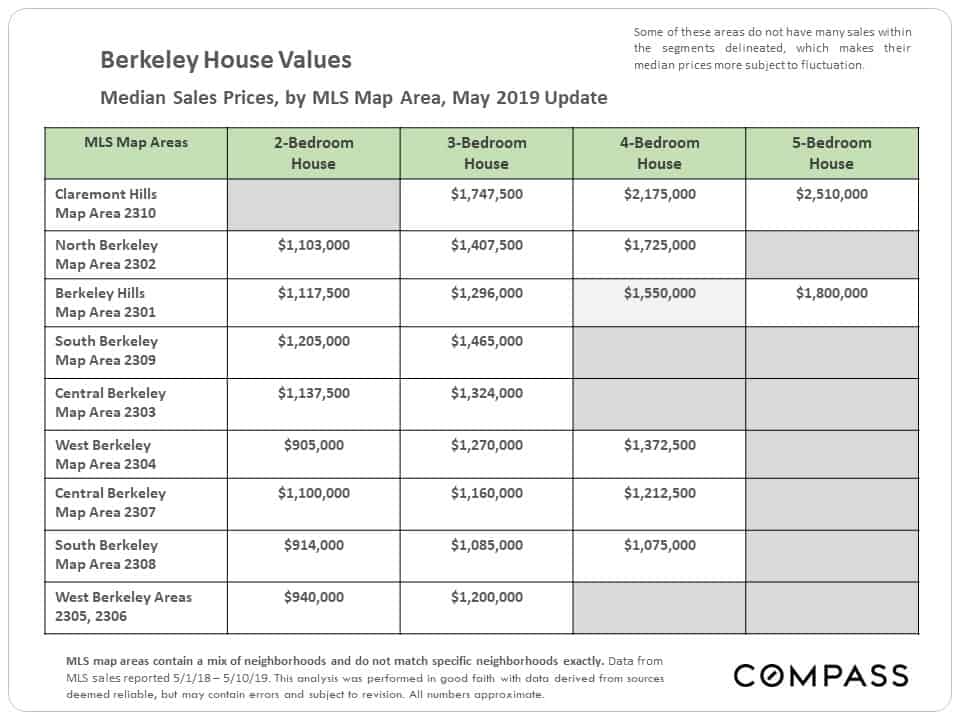
Median House Sales Prices by Market Area
& Bedroom Count
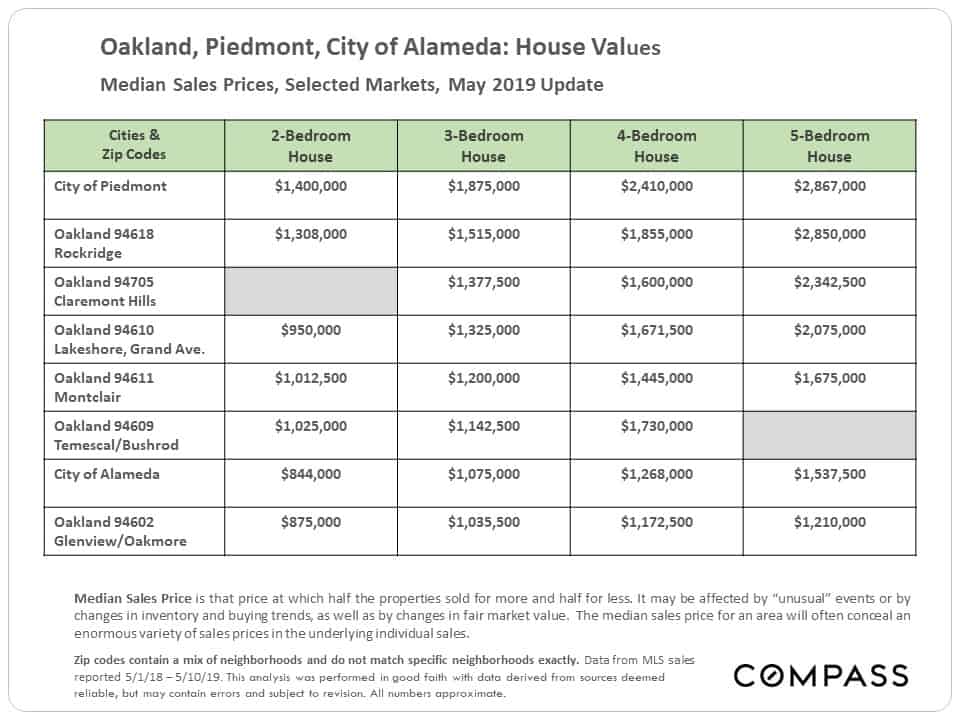
Click on the button-link below to go to our updated map of Bay Area median house prices.
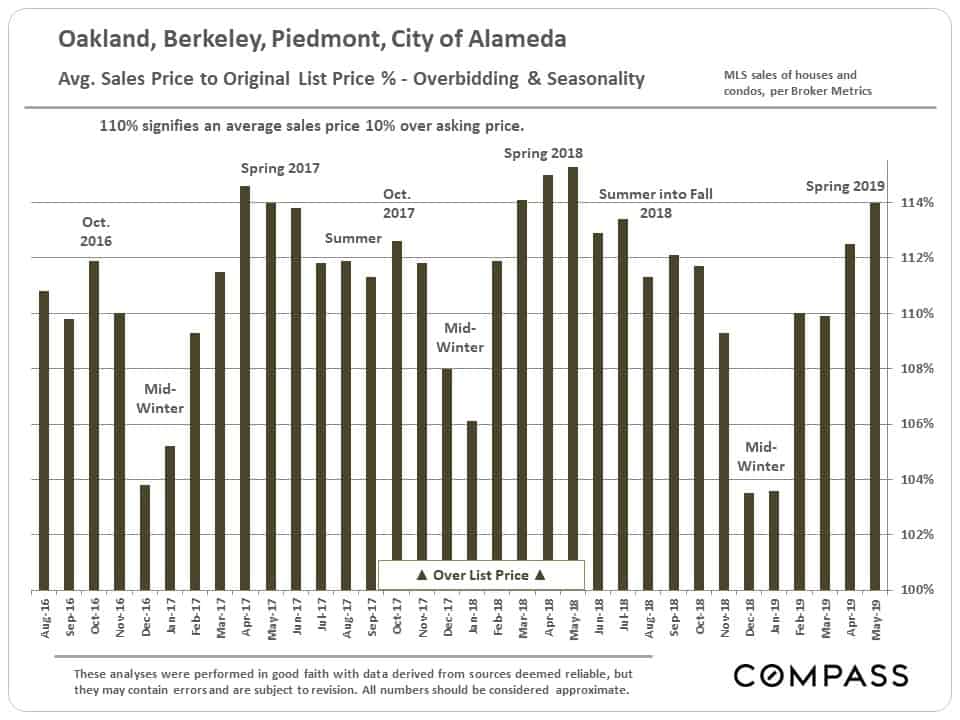
Selected Market Indicators
Homes selling very quickly, with high overbidding percentages above list price – both due to buyers competing aggressively for new listings.
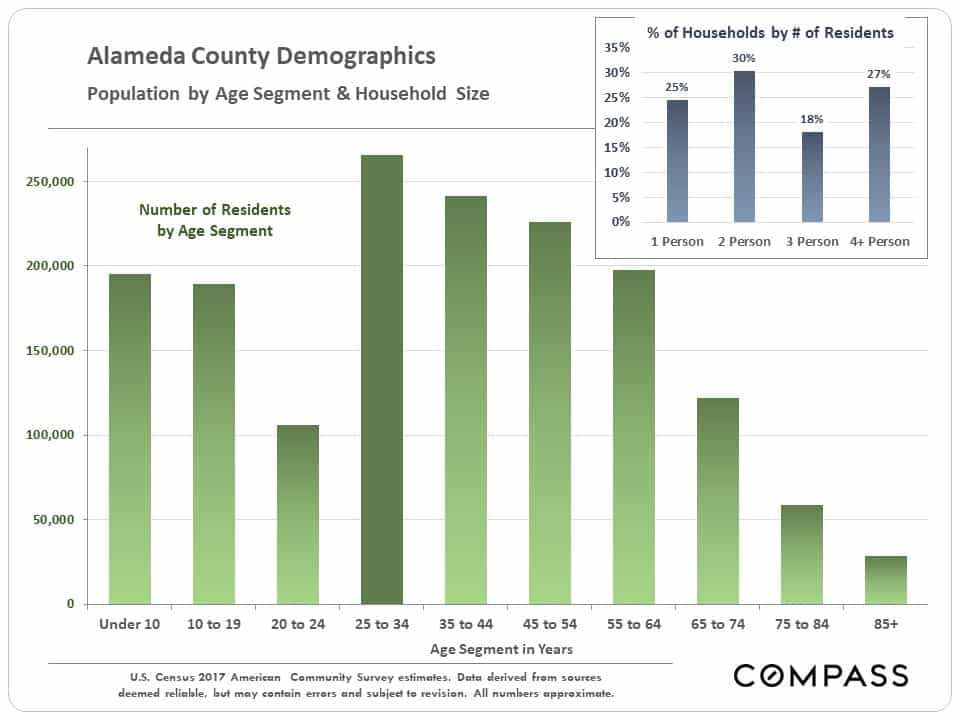
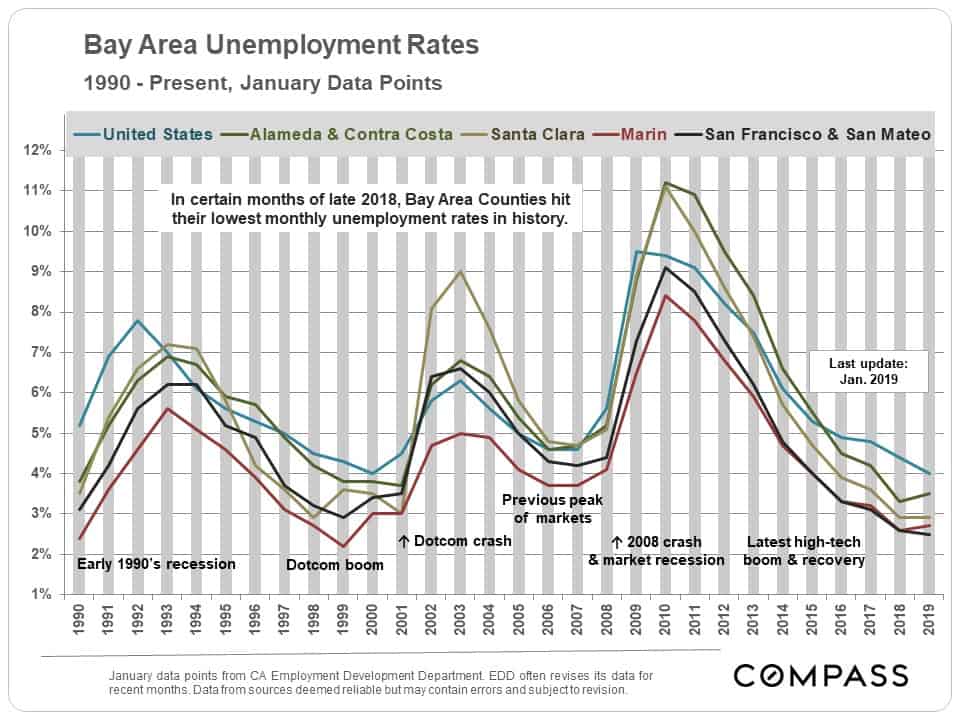
Selected Economic & Demographic Snapshots
This chart illustrating unemployment rates is updated through January. Since then, rates around the Bay Area half dropped about another half percent – to some of the lowest rates in history.
The Bay Area counties with the highest percentages of millennials are those most affected by the high-tech boom. Alameda County has the second highest percentage of residents aged 25 to 34 (16.3% behind SF’s 23%), and the second lowest median age (37.3 years to Santa Clara’s 37 years). Marin County has by far the highest median age at 46.1 years.