Oakland, Berkeley, Piedmont and Alameda July Real Estate Market Report

Oakland, Berkeley, Piedmont & City of Alameda Real Estate
Quantifying the Spring 2019 Market
Stock markets hit new highs, interest rates hit multi-year lows, unicorn IPOs rolled out in San Francisco, and the greater Oakland-Berkeley real estate market had another very strong spring selling season
July 2019 Q2 Report
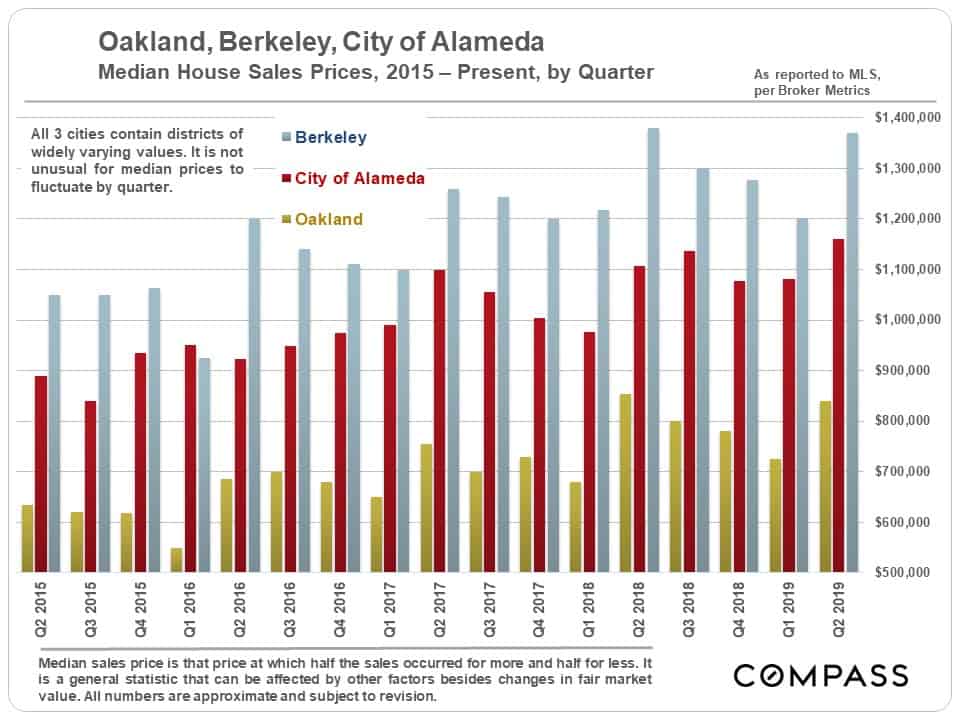
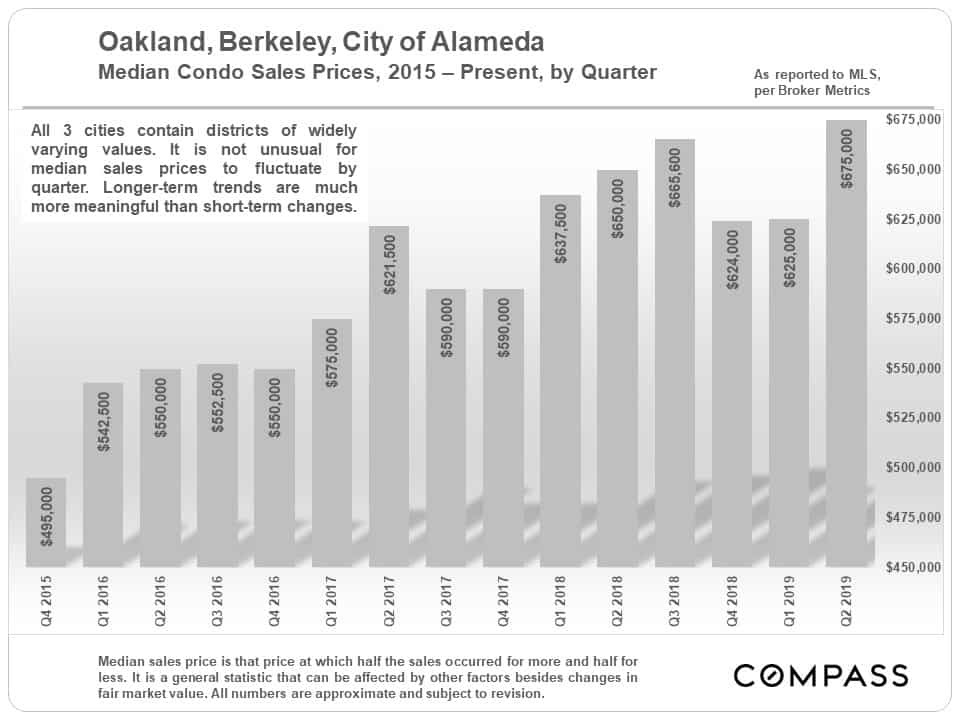
Median Sales Price Trends
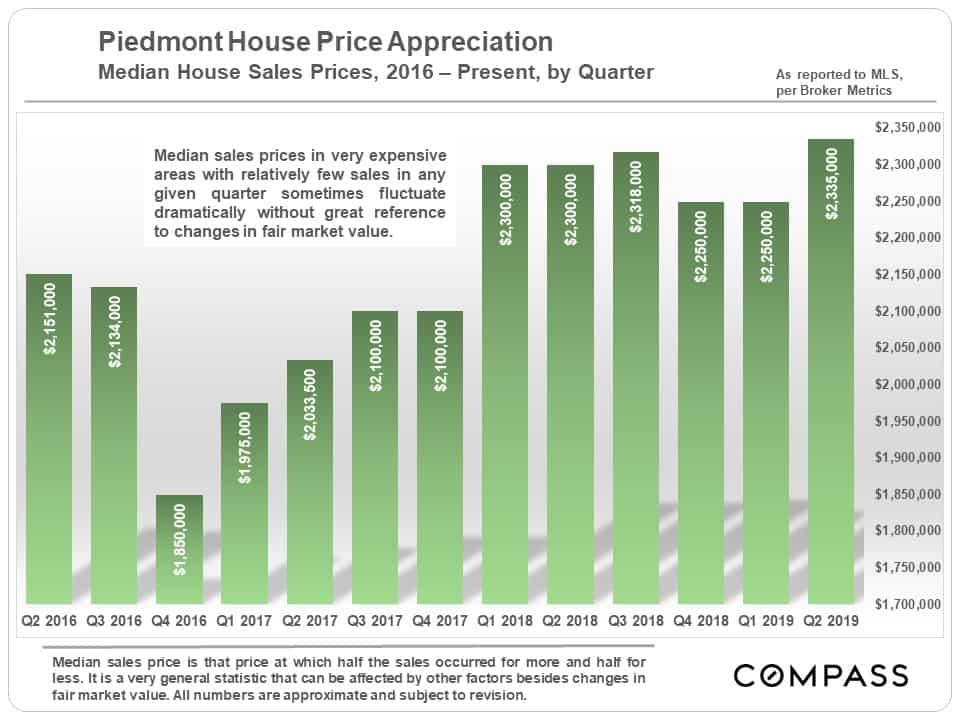
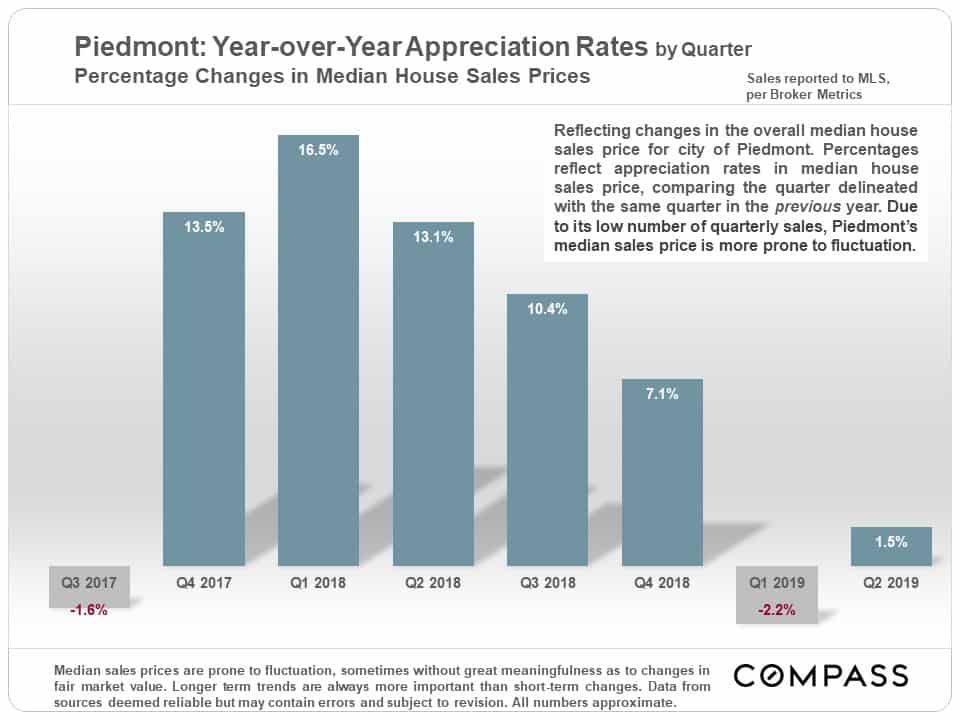
Median home sales prices typically fluctuate by season – partly due to the heat of buyer demand and partly due to the seasonal nature of luxury home sales – and it is not unusual for them to peak for the calendar year in Q2.
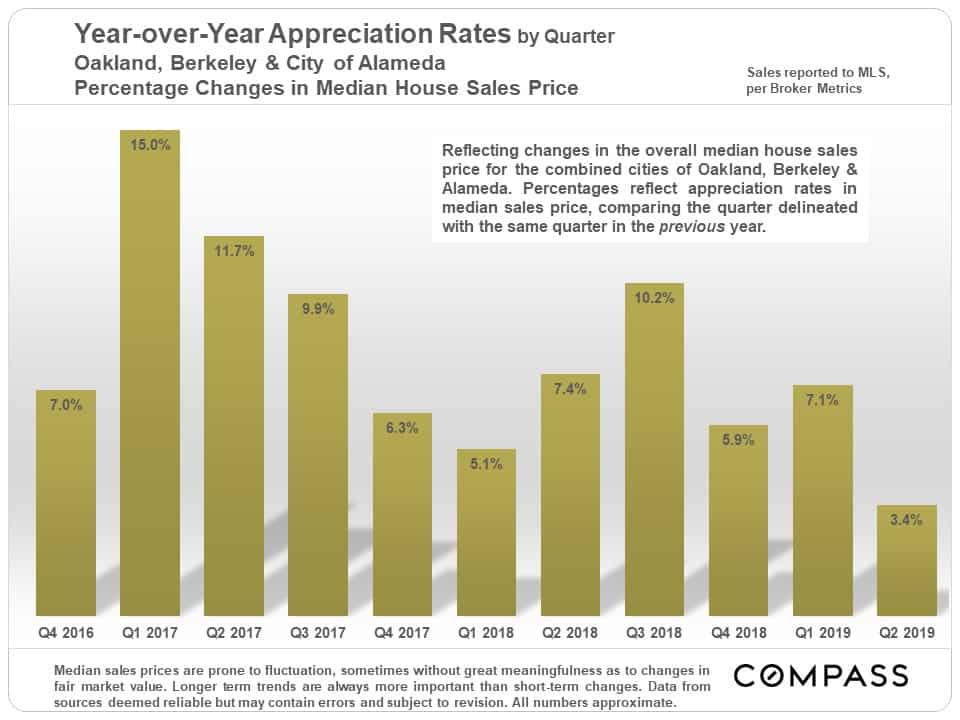
Year-over-year appreciation rates have clearly declined, but generally remain positive in our market area. Many Bay Area markets have seen small y-o-y median price declines. San Francisco, being at the heart of the spring surge in IPOs, saw the highest year-over-year increase – about 5%.
In the charts below, we separated Piedmont from the other 3 cities, because its home prices are so much higher.
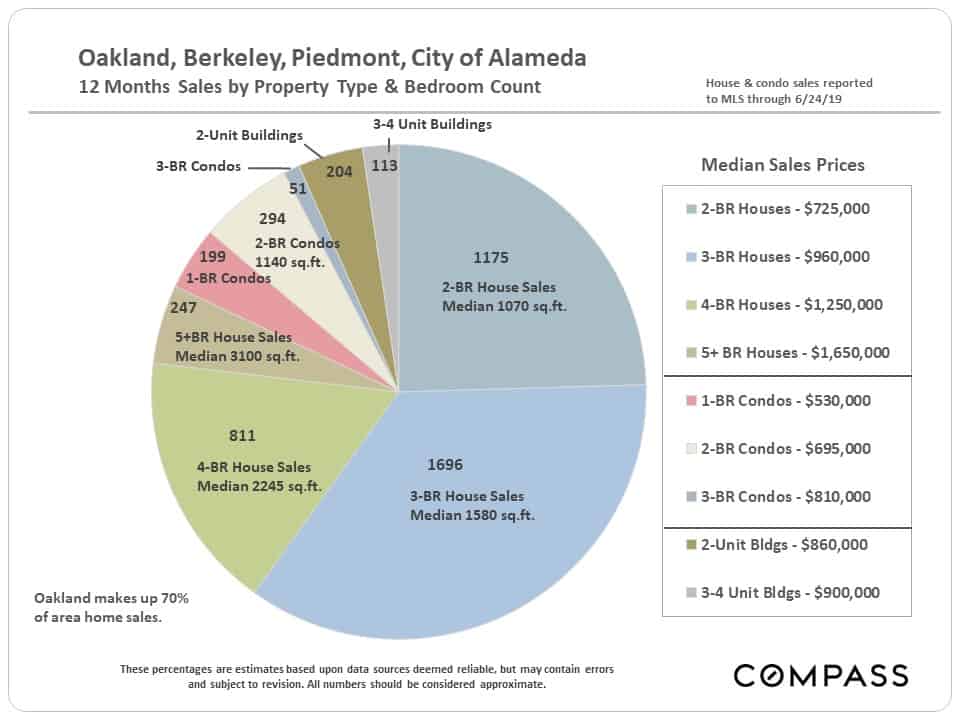
Home Sales by Property Type & Bedroom Count
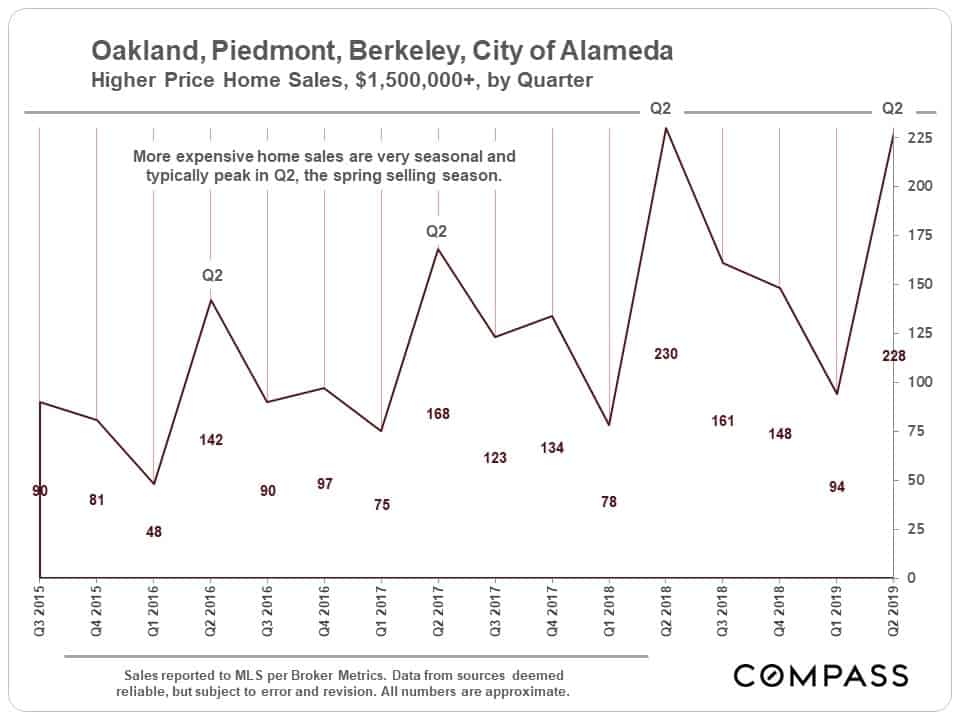
Higher-Price Home Sales, $1.5 Million+
Q2 dominates sales of more expensive homes. This year’s sales volume is similar to the peak hit in spring 2018.
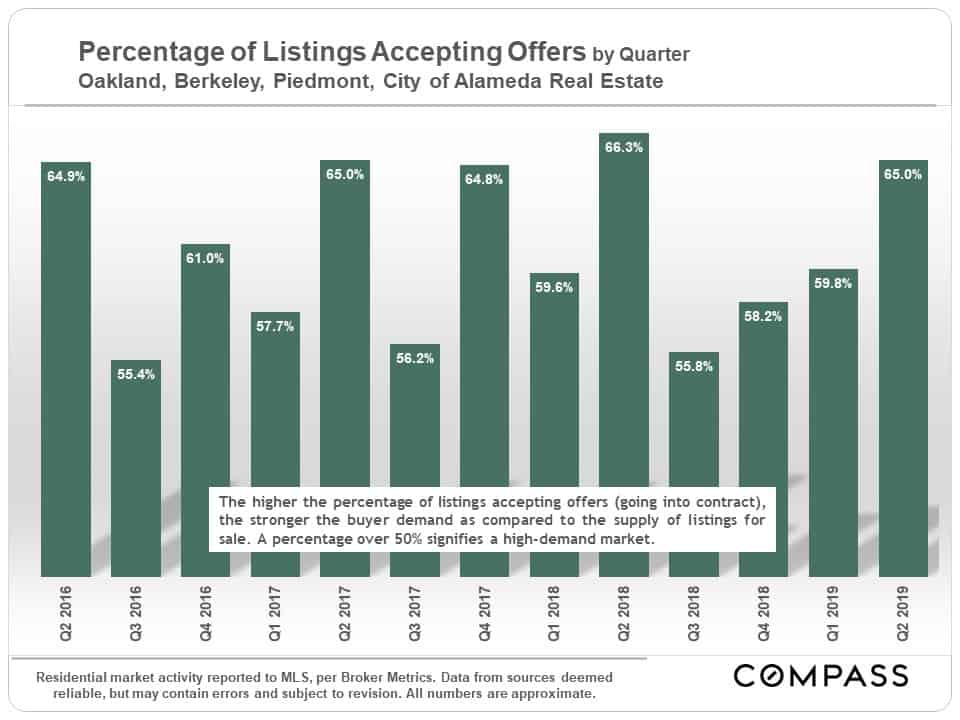
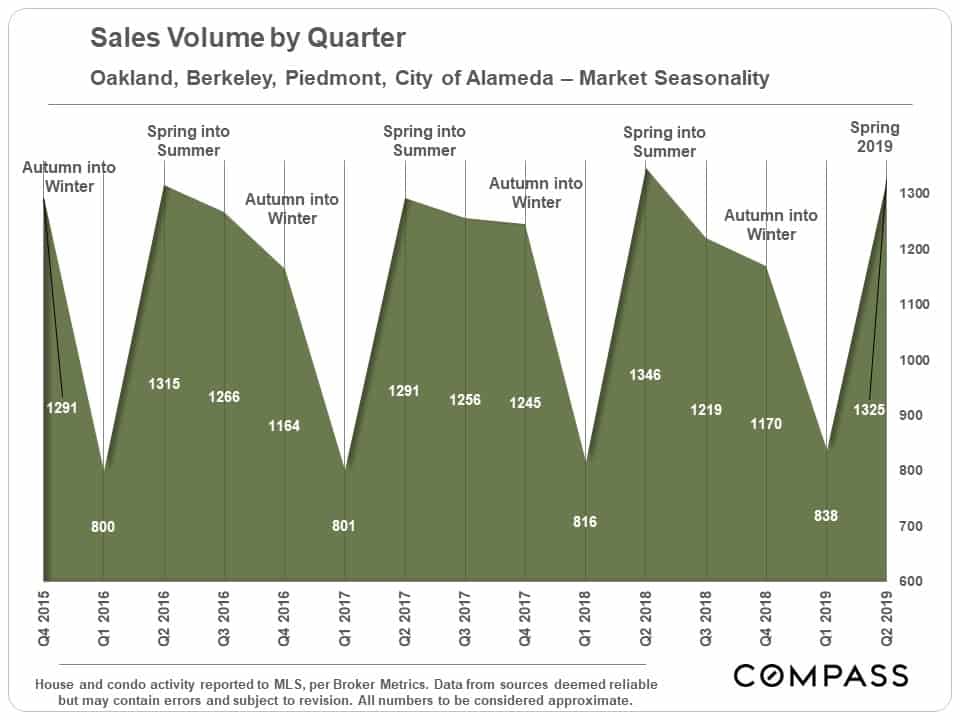
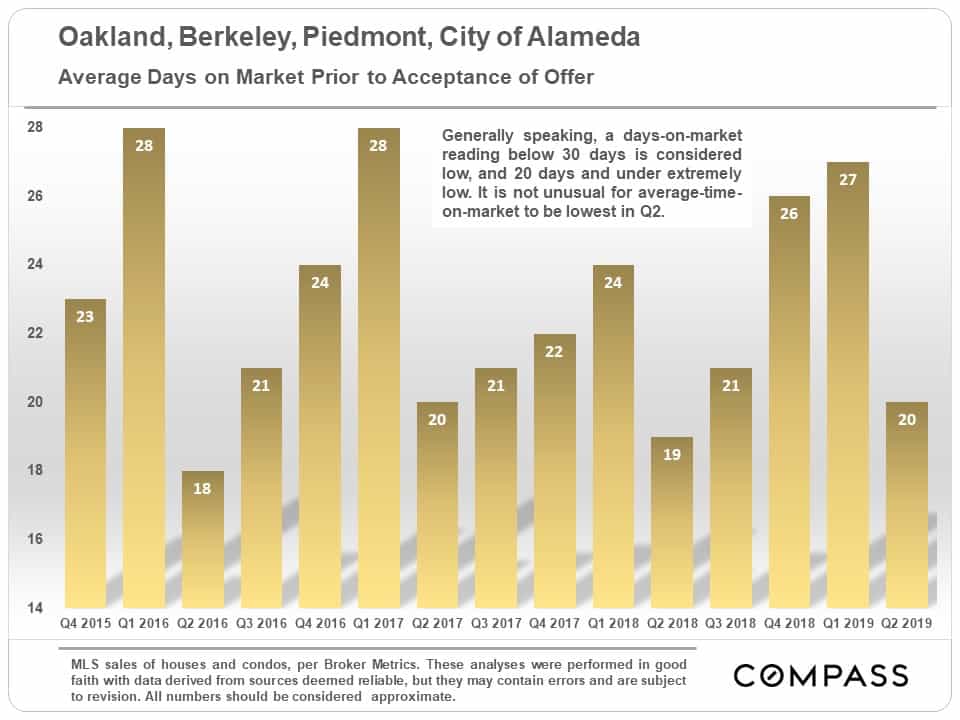
Selected Measurements of Buyer Demand
As illustrated below, the statistics of demand in Q2 2019 compare favorably with the hottest markets of recent years. Spring is typically the most active selling season of the year, and, generally speaking, the market gradually cools down thereafter until hitting its low point at the end of the year during the mid-winter holiday season.
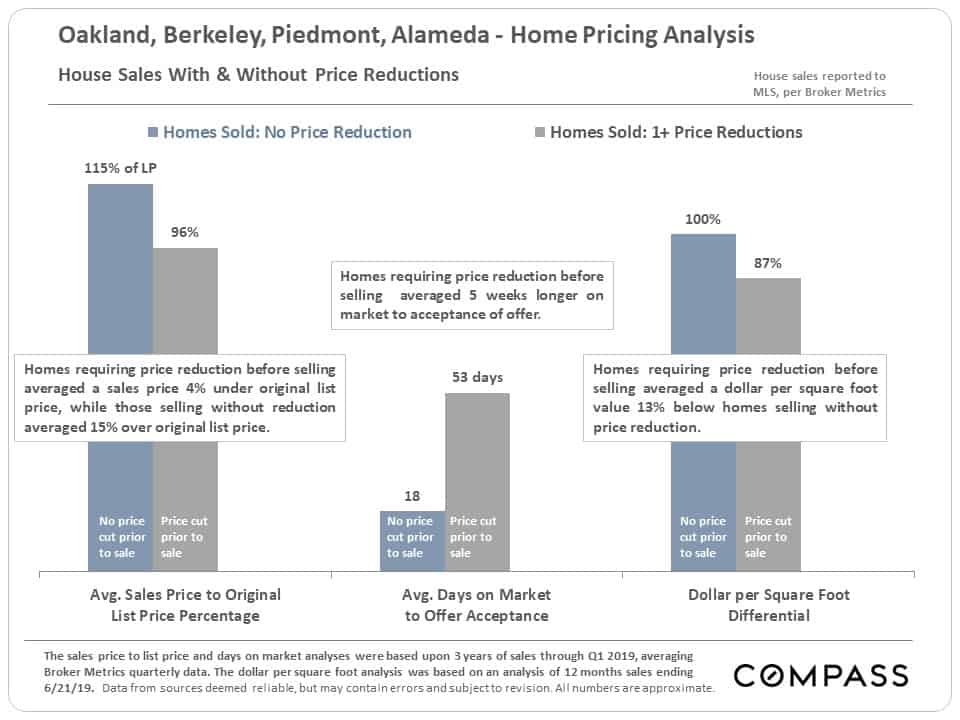
Overpricing: Negative Effects for Sellers
& Opportunities for Buyers
We performed longer-term analyses of the effects of overpricing – as indicated by the need for price reductions before the property sold – on every major market in the Bay Area and the results were uniformly similar. As would be expected, there were dramatic differences in the sales price to list price percentage and time on market before sale. But there were also very substantial differences in the average dollar per square value realized upon sale – and the hotter the market, the larger the percentage decline in dollar per square foot that accompanied price reductions.
This is almost certainly due to missing out completely on the sales-price-enhancing effects of overbidding.
So, overpricing lowers values for sellers, which also signifies opportunities for buyers who keep an eye out for price reductions and react accordingly.
The statistics illustrated below for homes that sold without prior price reduction reflect buyers jumping very quickly and bidding fiercely on new listings they deem appealing and fairly priced.
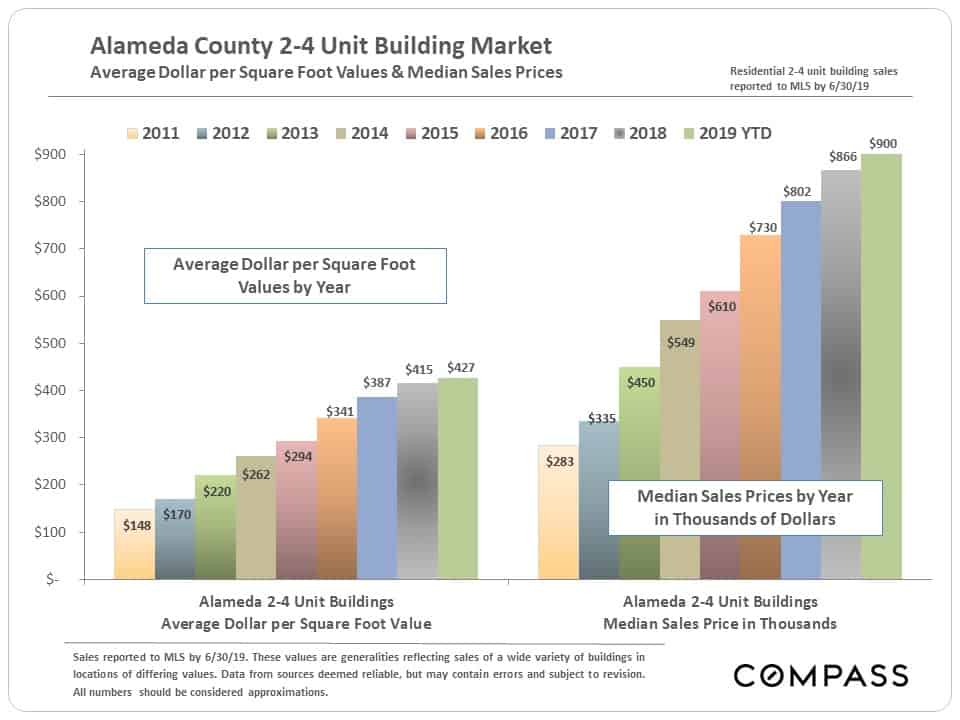
2-4 Unit Multi-Family Property Values –
Alameda County
This is an active market segment in our area. Appreciation trends are similar to those seen in single family homes, partly due to the large increase in rents over the period measured.
We not only mapped Bay Area median house sales prices, but ranked them, lowest to highest. What stands out clearly is that, though our home prices are indeed higher than ever, how much more affordable they are when compared to communities of comparable quality in San Francisco and Silicon Valley. If interested, click on the button link below. The ranking list can be found below the map.
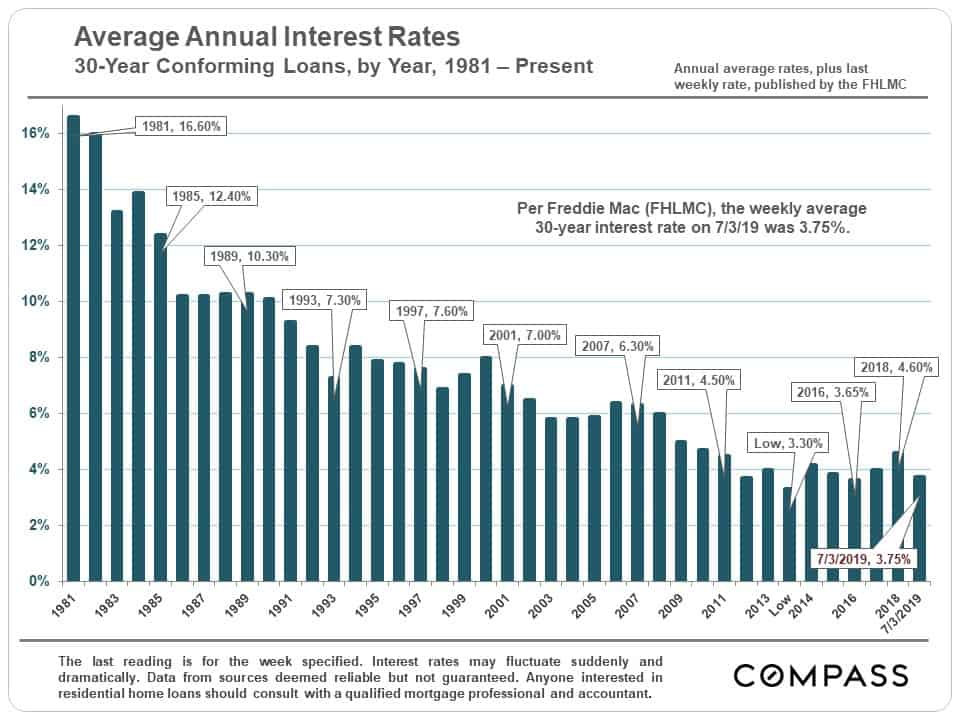
Mortgage Interest Rate Trends
Interest rates fell dramatically from the end of 2018 to multi-year lows in Q2 2019, playing a huge role in the cost of housing for home buyers, and energizing demand.