Oakland, Berkeley, Piedmont and Alameda July Real Estate Market Report 2020

Oakland-Berkeley Inner East Bay Region Real Estate
Big rebound in market activity continues;
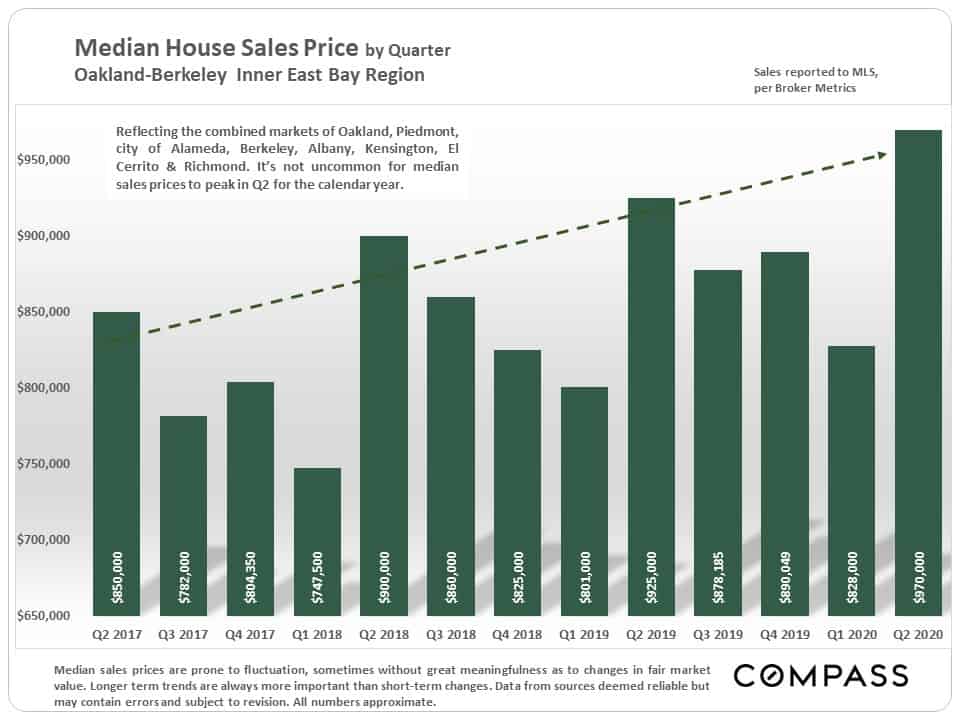
Median house sales price hits new quarterly high.
July 2020 report for Oakland, Berkeley, Piedmont, City of Alameda, Albany, Kensington, El Cerrito & Richmond
Despite the ongoing health and economic crisis precipitated by COVID-19, the real estate market made a dramatic recovery from the steep decline in April. The median house sales price hit a new high in Q2, and around the Bay Area, high-end homes, in particular, have seen very strong demand.
Depending on the statistic, a few charts below reflect the market in Alameda County as a whole.
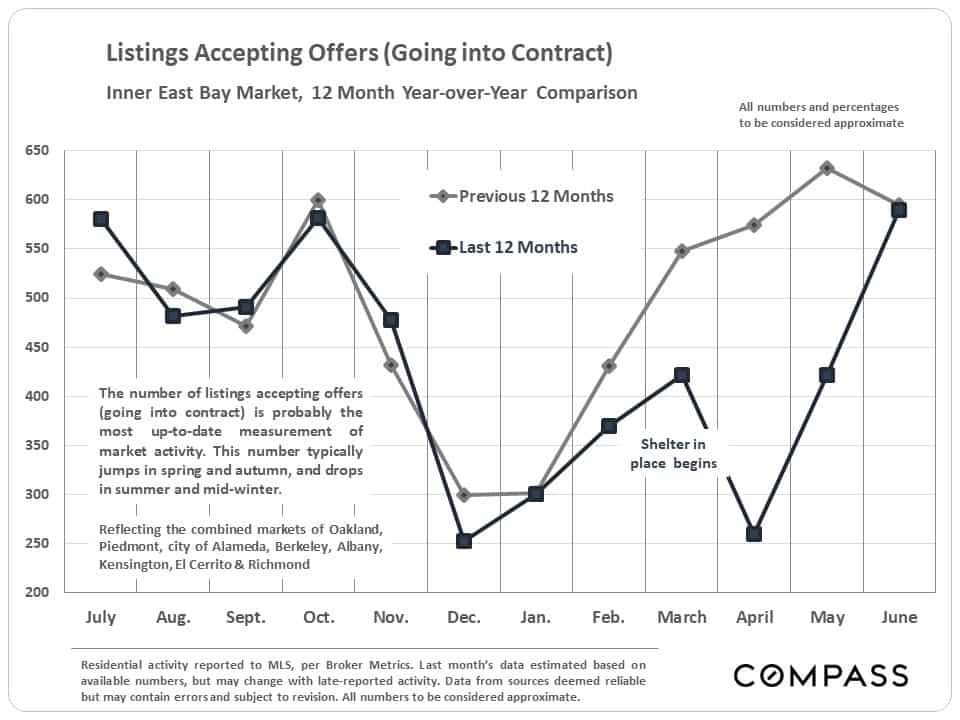
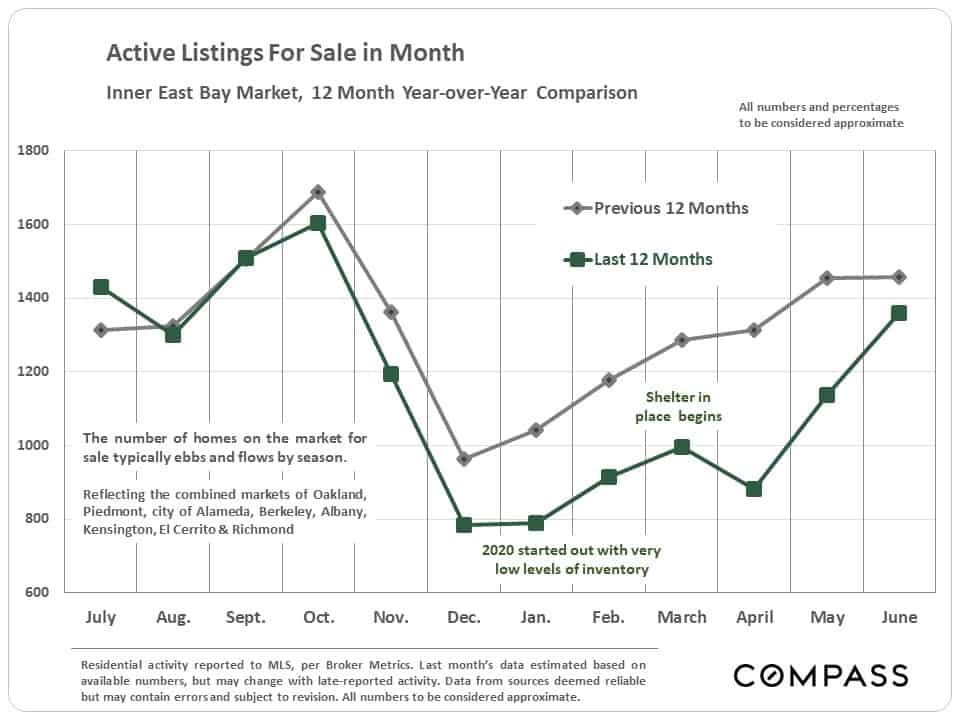
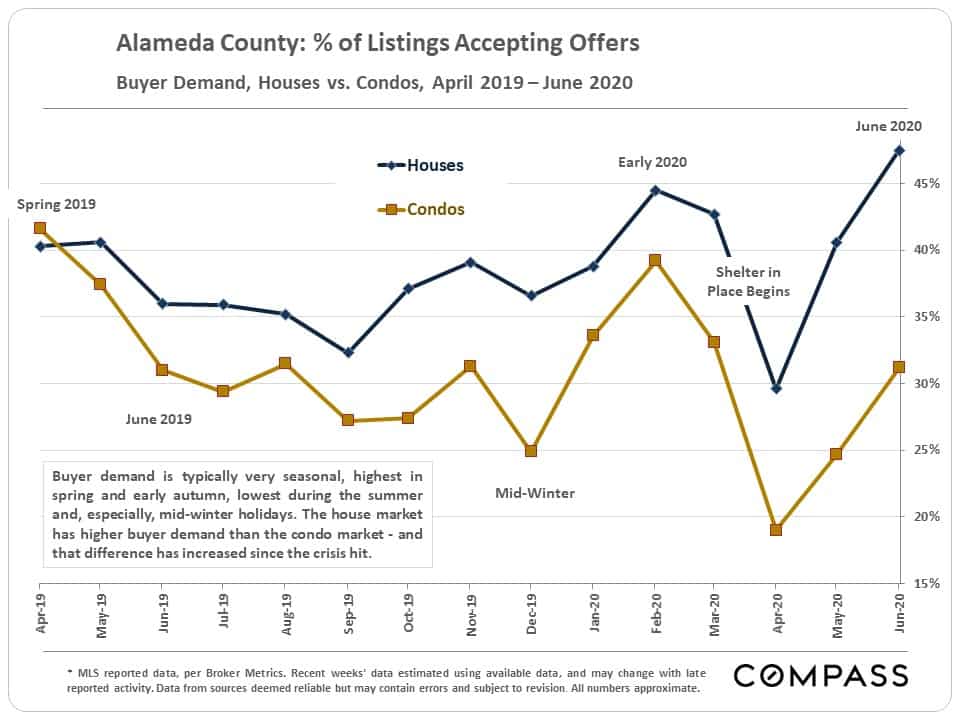
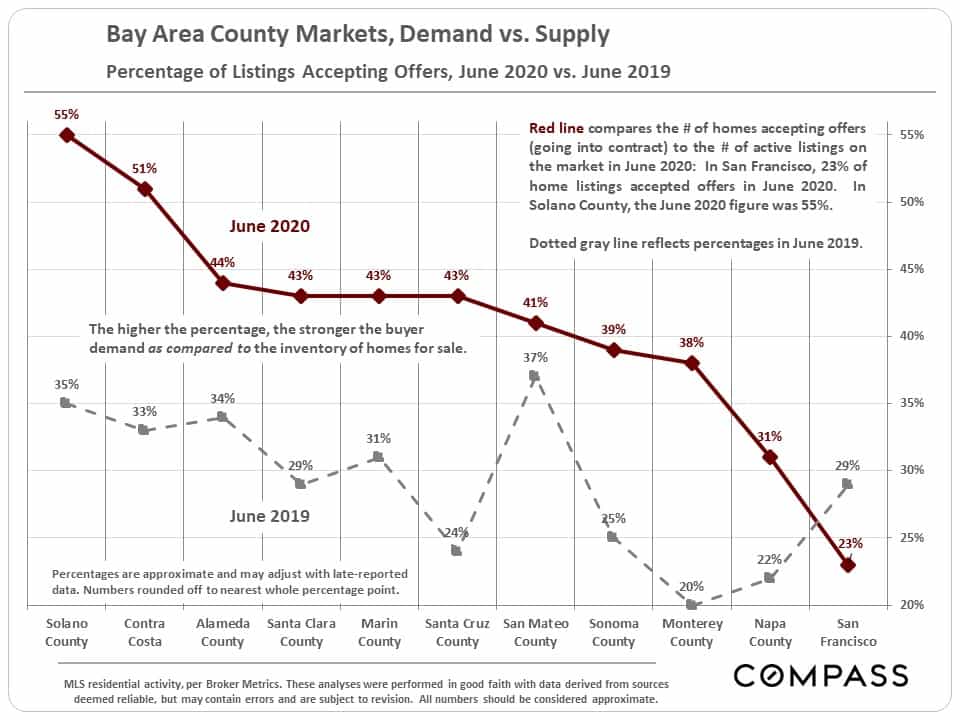
The first chart below illustrates the big rebound in buyer demand from the initial shelter-in-place crash, as the number of listings accepting offers in June 2020 rose back up to normal on a year-over-year basis. Of course, closed-sales volume – a lagging indicator – was hammered in Q2 by shelter in place.
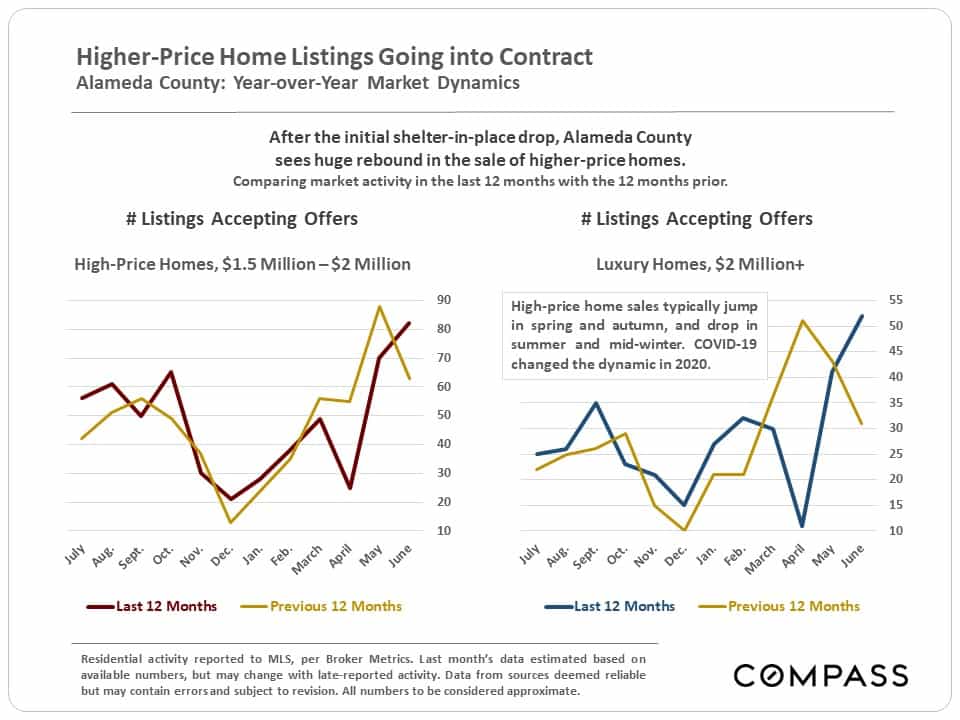
The large increase in sales activity in higher price segments is reflected in these next two charts.
2020 began with low levels of inventory, and, though increasing significantly since the April drop, remains a bit lower on a year-over-year basis.
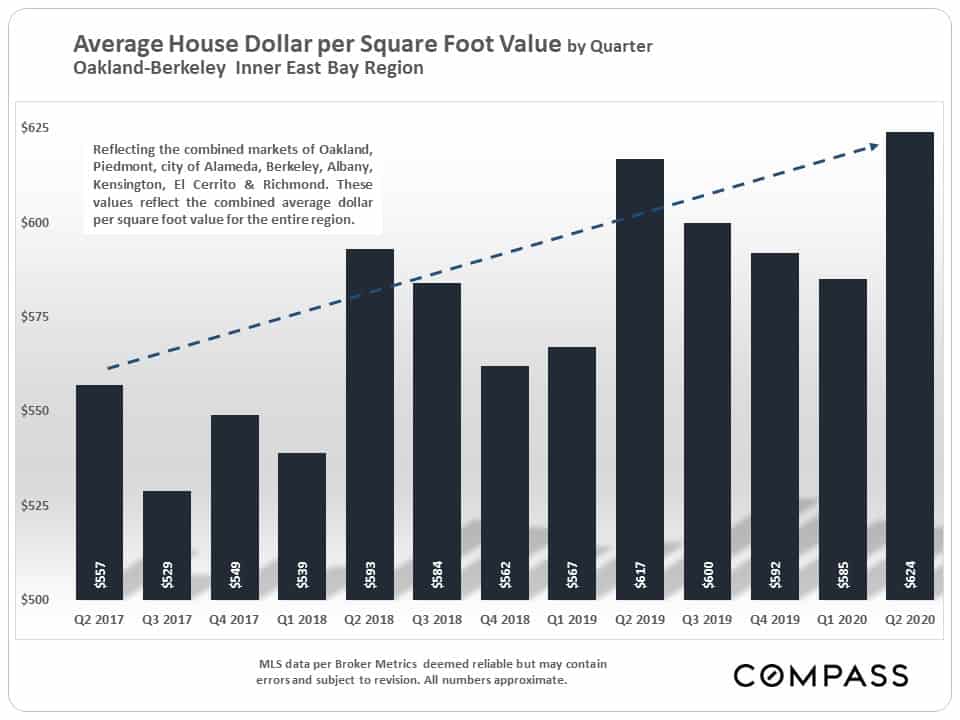
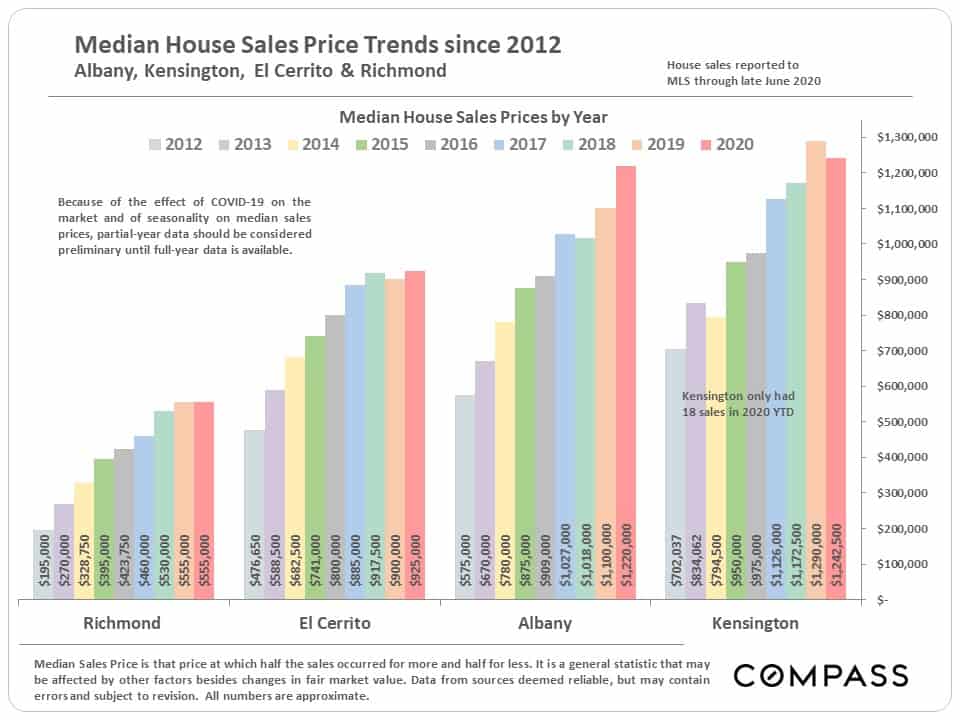
Area house values, as measured by both median sales price and average dollar per square foot value, hit new highs in Q2.
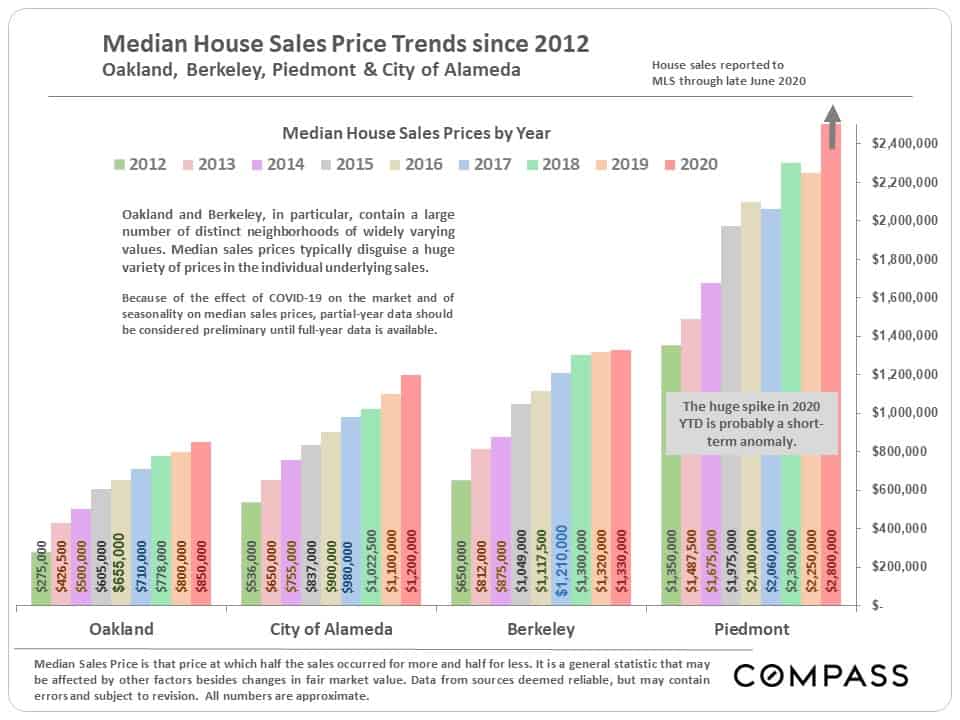
Median house sales price trends by city: Remember that median sales price is not a perfect indicator of changes in fair market value, as it can be affected by a number of factors. Fluctuations are especially common in markets with relatively low sales volumes across a wide range of sales prices, such as in Piedmont and Kensington.
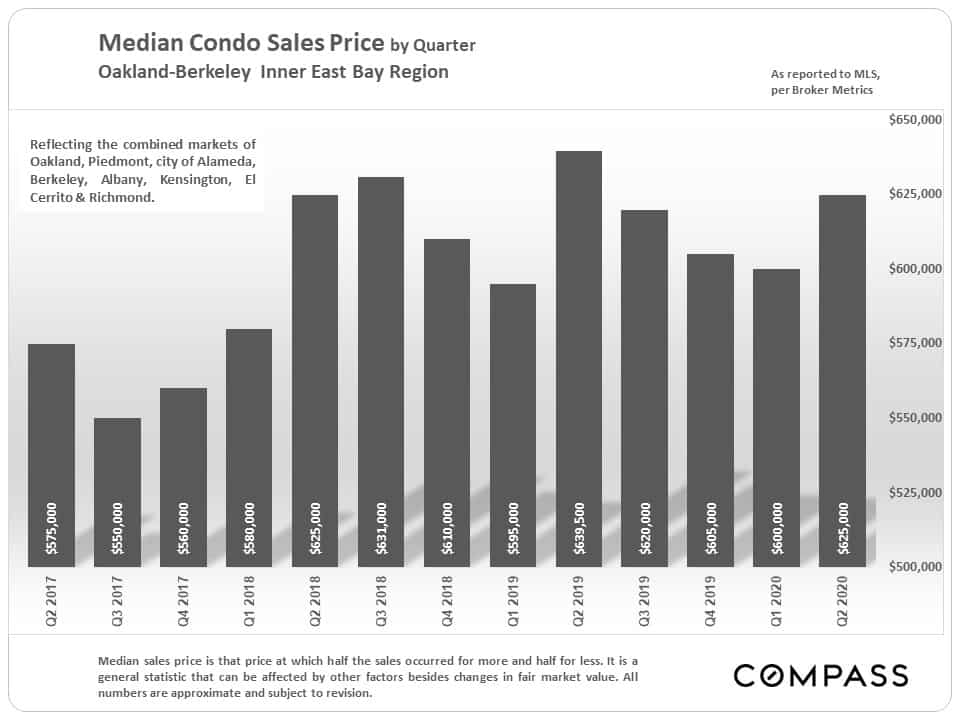
The condo market has been weaker than the house market, as measured by both sales activity and median sales price. This is a common dynamic around the Bay Area. It may be that prospective condo buyers – often younger and less affluent than house owners – have been more affected by the huge jump in unemployment.
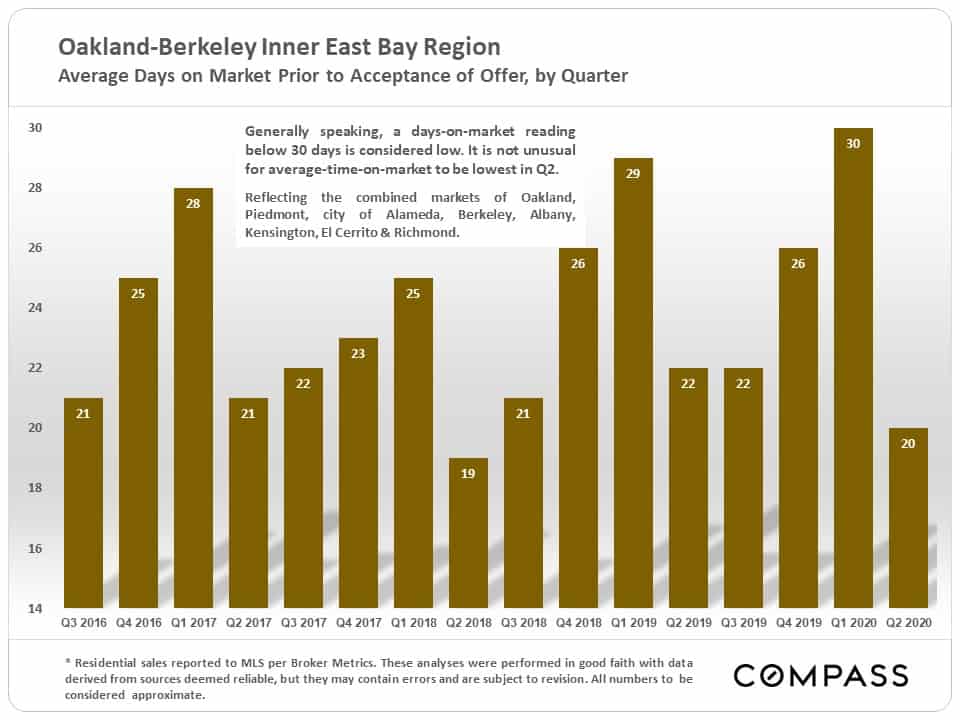
Average days on market were very low in Q2. The listings that sold typically went into contract quite quickly.
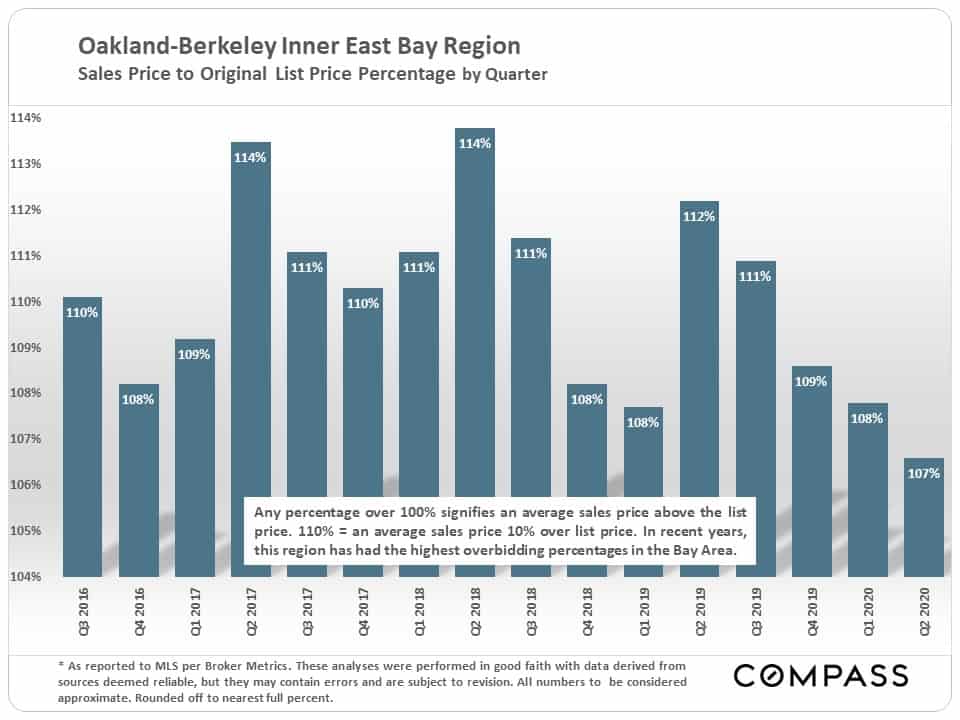
Overbidding of asking price has declined – some of this has to do with changed home showing protocols with shelter in place – but the average sales price to list price percentage in the region remains by far the highest in the Bay Area.
Except for San Francisco, every county market in the Bay Area saw year-over-year increases in the percentage of listings accepting offers in June, and with a reading of 44%, Alameda County is near the top of the June 2020 scale for this metric. (first chart below)
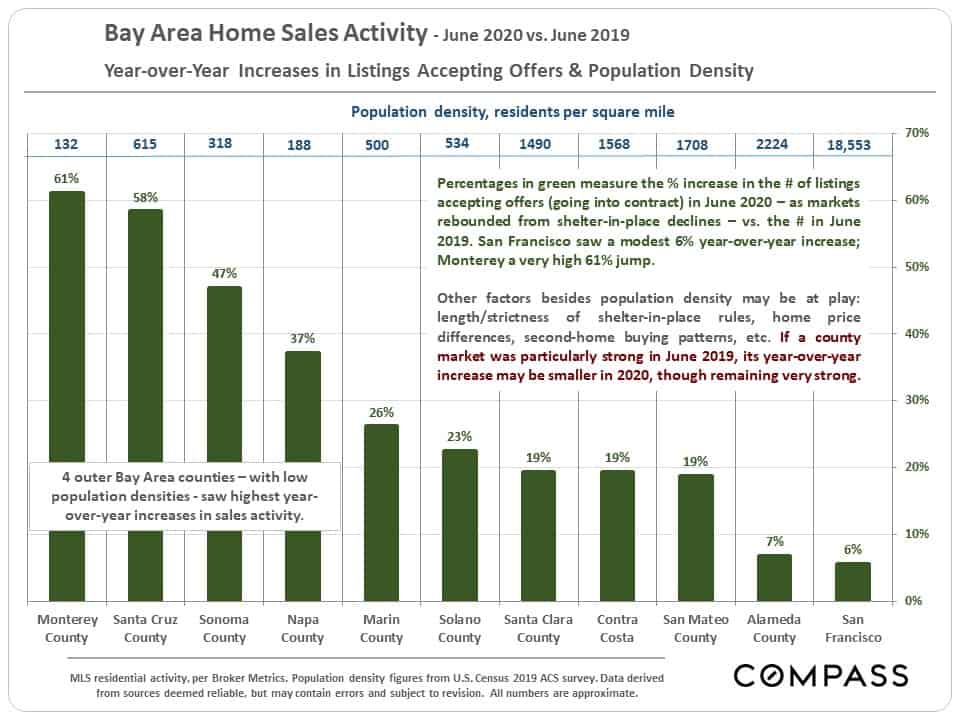
But the counties that had the largest y-o-y INCREASES in percentage of listings accepting offers in June were 4 outer Bay Area counties characterized by very low population densities. The counties with the lowest y-o-y increases were the more urban markets, SF and Alameda. (second chart below) Other factors may also be at play: length/strictness of shelter-in-place rules, home price differences, second-home buying patterns, and so on.
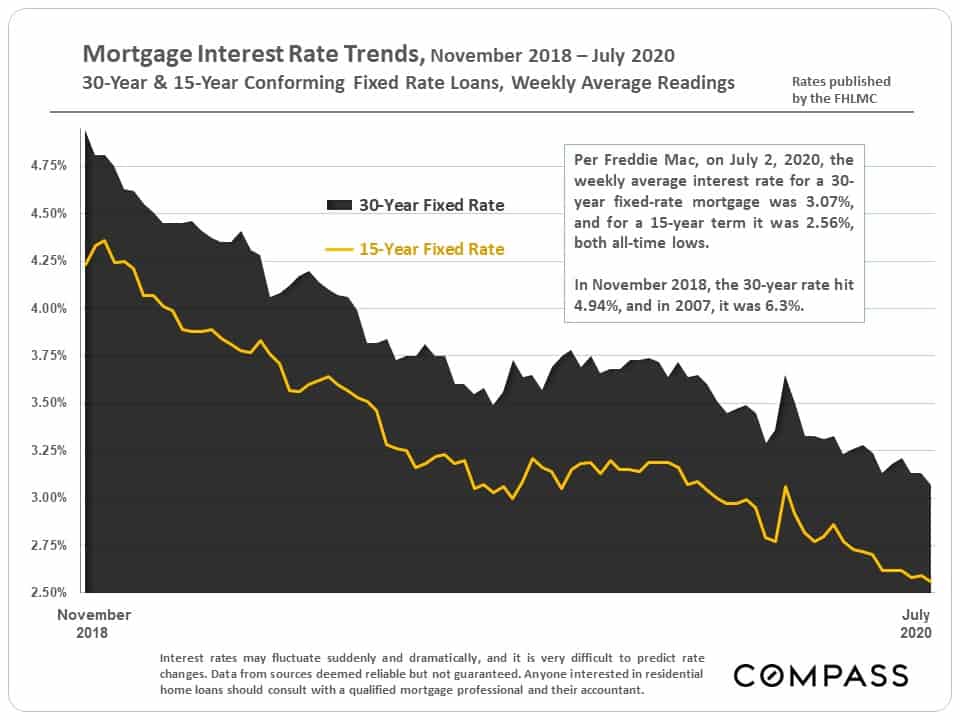
And mortgage interest rates have continued to decline.