Oakland, Berkeley, Piedmont and Alameda August Real Estate Market Report 2020

The Greater Oakland-Berkeley Inner East Bay Real Estate Market
August 2020 Report
Depending on the statistic and source of data, this report will generally pertain to cities of the “Inner East Bay” but sometimes reference Alameda County data
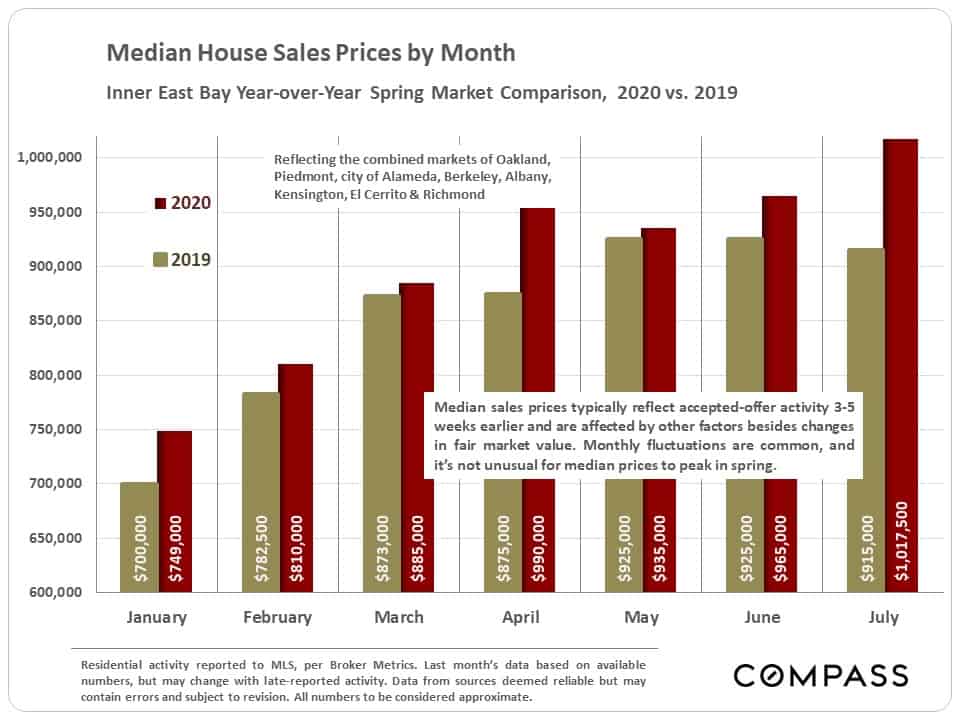
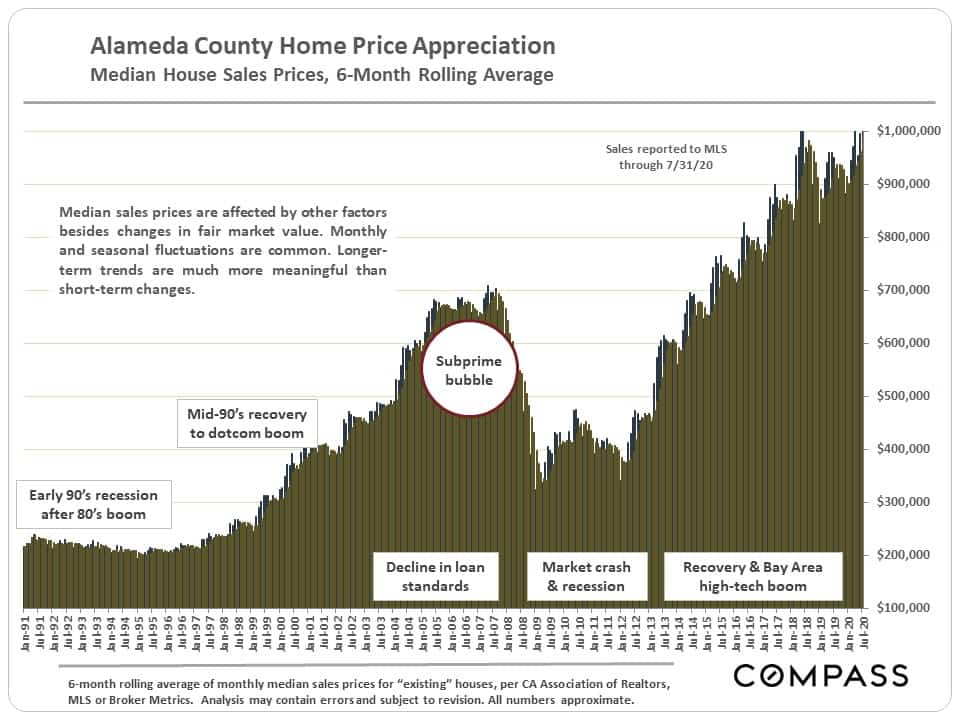
Median Home Sales Price Trends
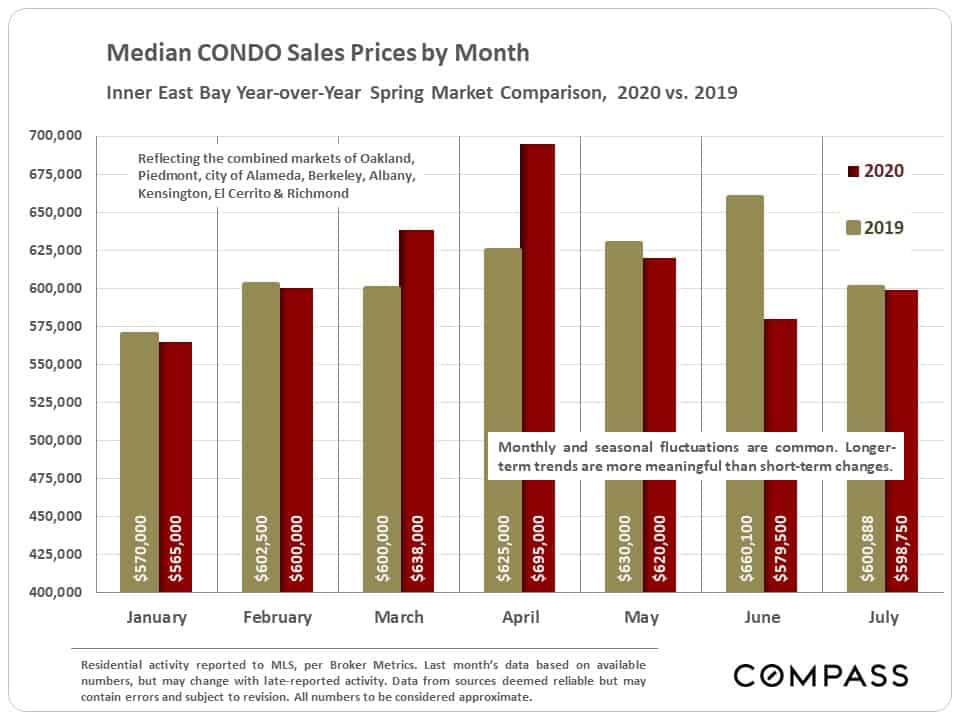
Around the Bay Area, condo markets have typically been softer than house markets since shelter-in-place first came into effect. (This is especially true in San Francisco, where condos constitute the largest segment of the market.)
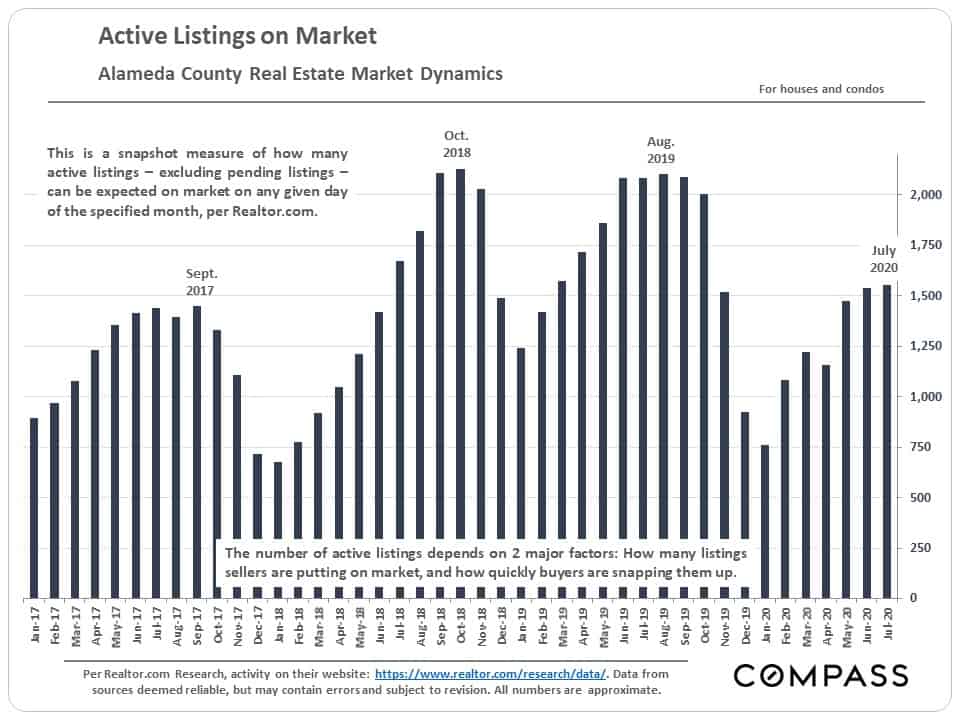
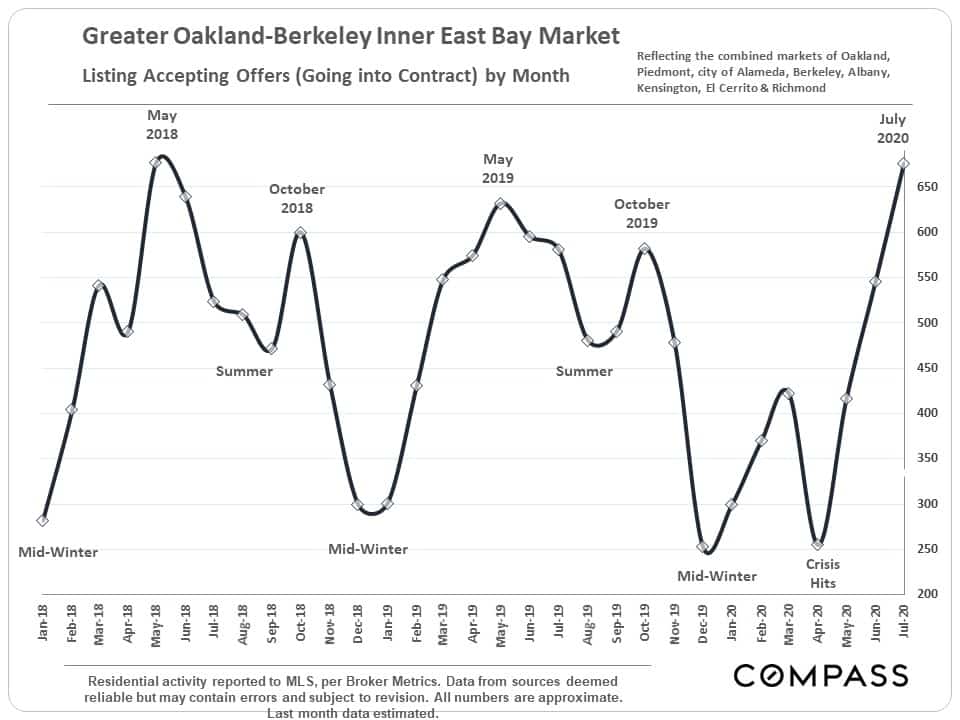
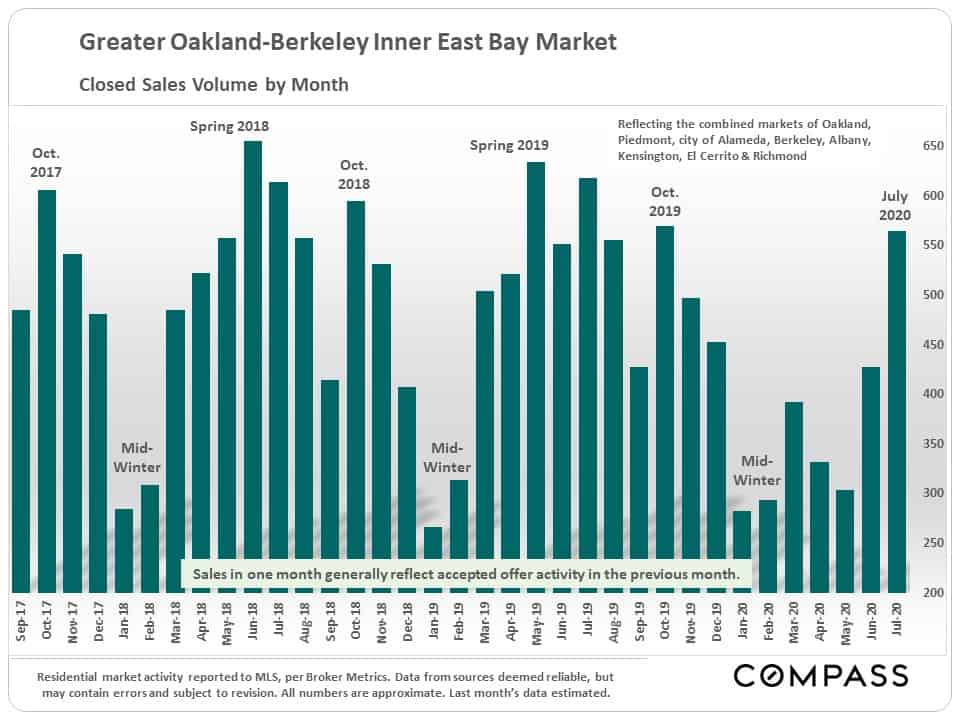
Supply & Demand
Active listings on market, listings accepting offers, and closed sales volume by month
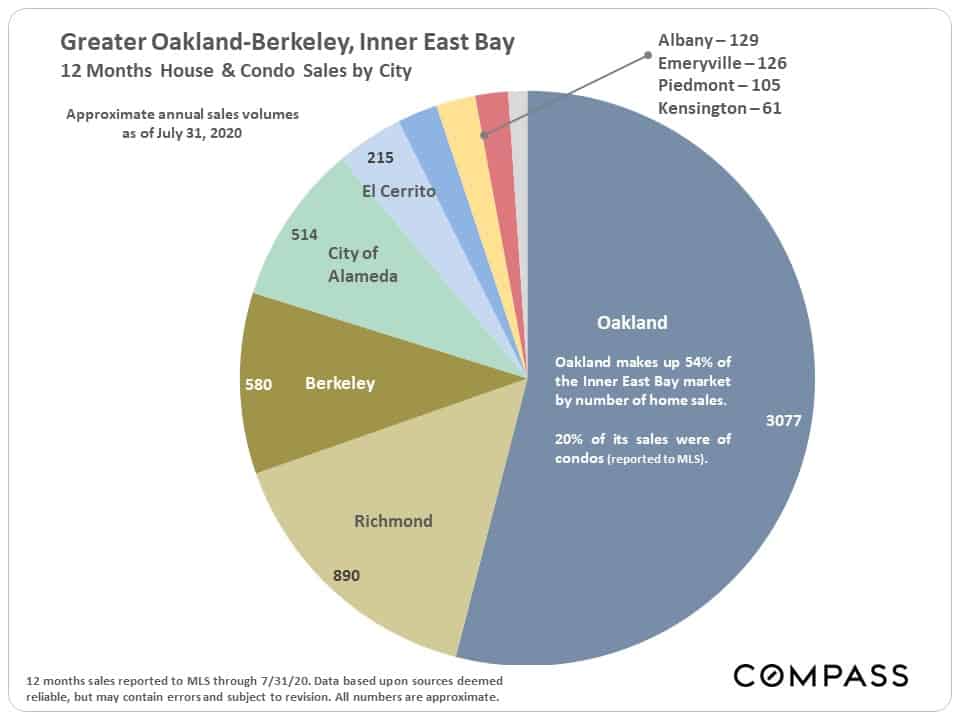
Sales Volume by City
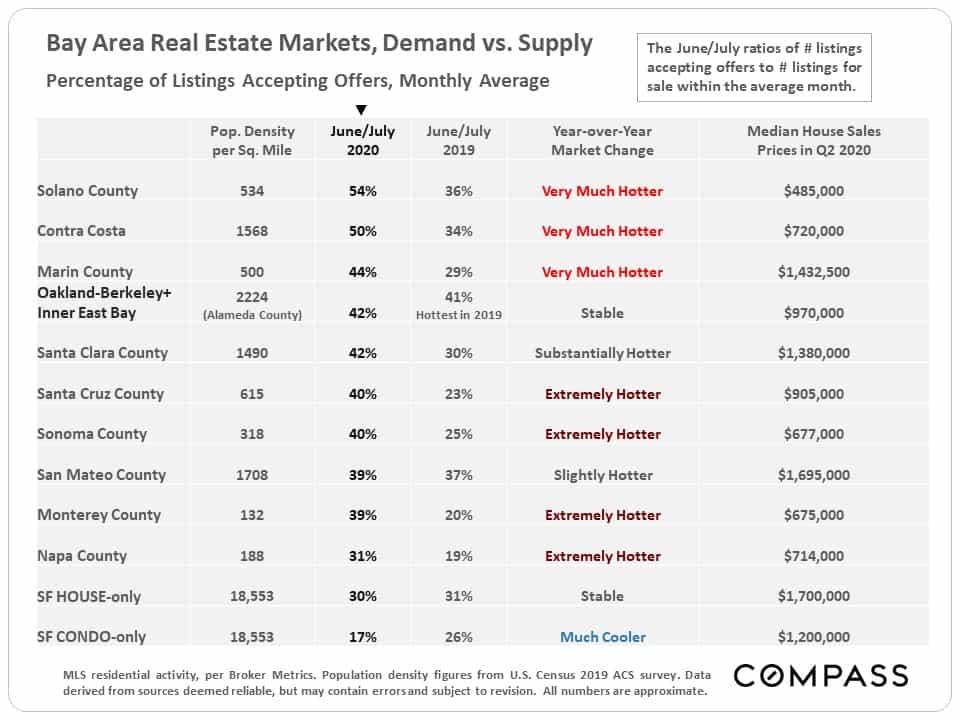
Bay Area Markets Comparison
This table ranks each county by the percentage of active listings going into contract in June/July 2020 – a standard statistic of market heat – compares it to the same period of last year, and then rates the year-over-year change.
The Greater Oakland-Berkeley Inner East Bay market was the hottest in the Bay Area last year, by a substantial margin. Its market remains very strong, similar to last year, but many other county markets saw dramatic year-over-year increases in buyer demand in recent months. This is especially true of less expensive, outlying counties, generally more suburban or rural in nature.
Selected Market Indicators
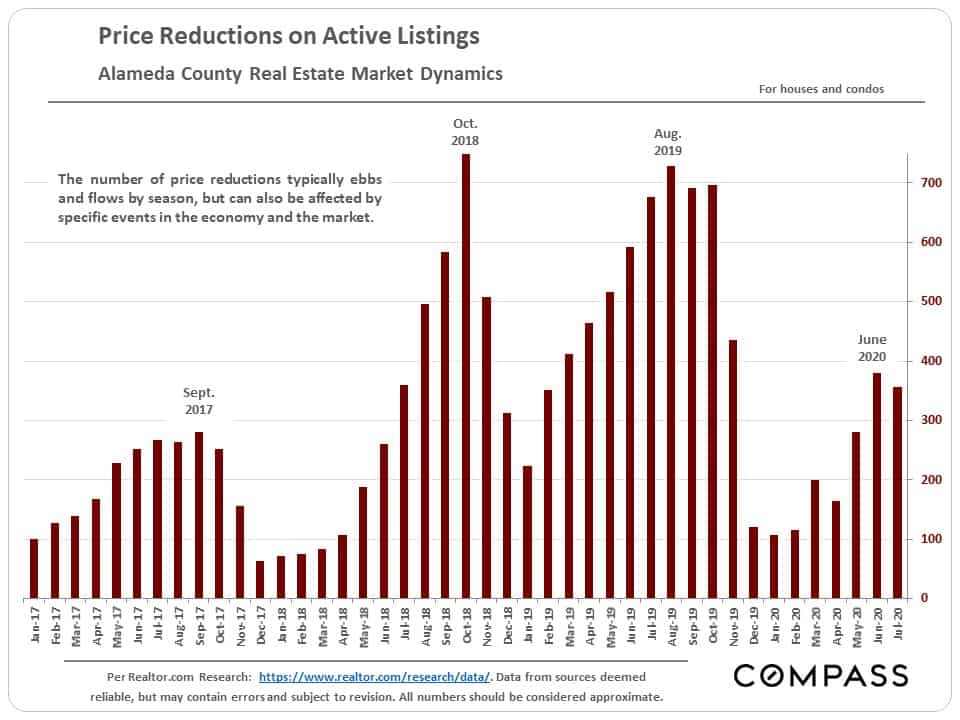
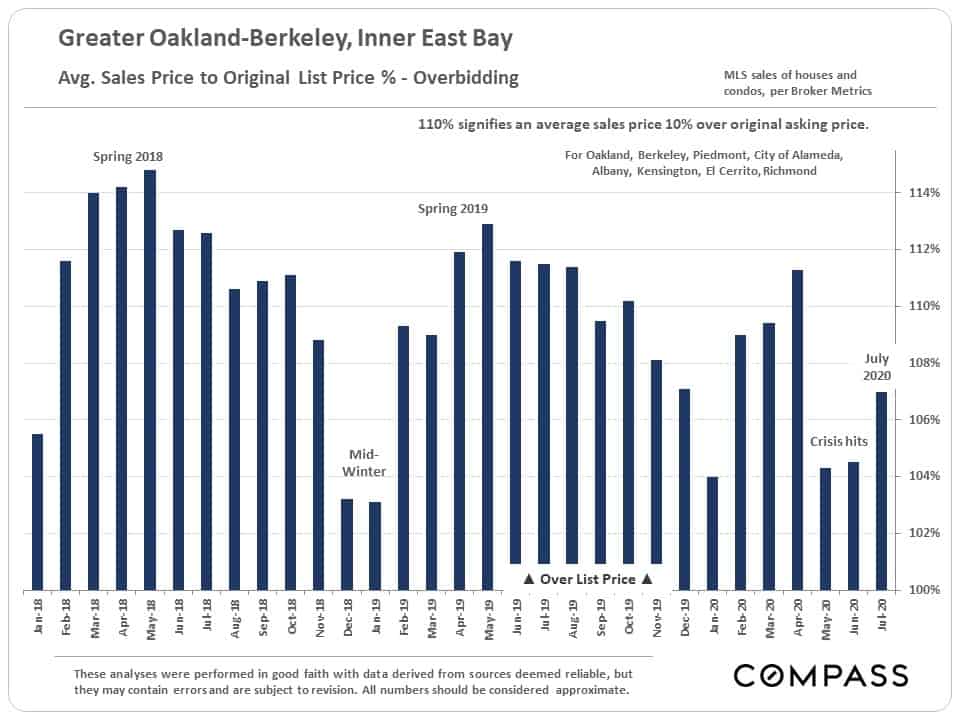
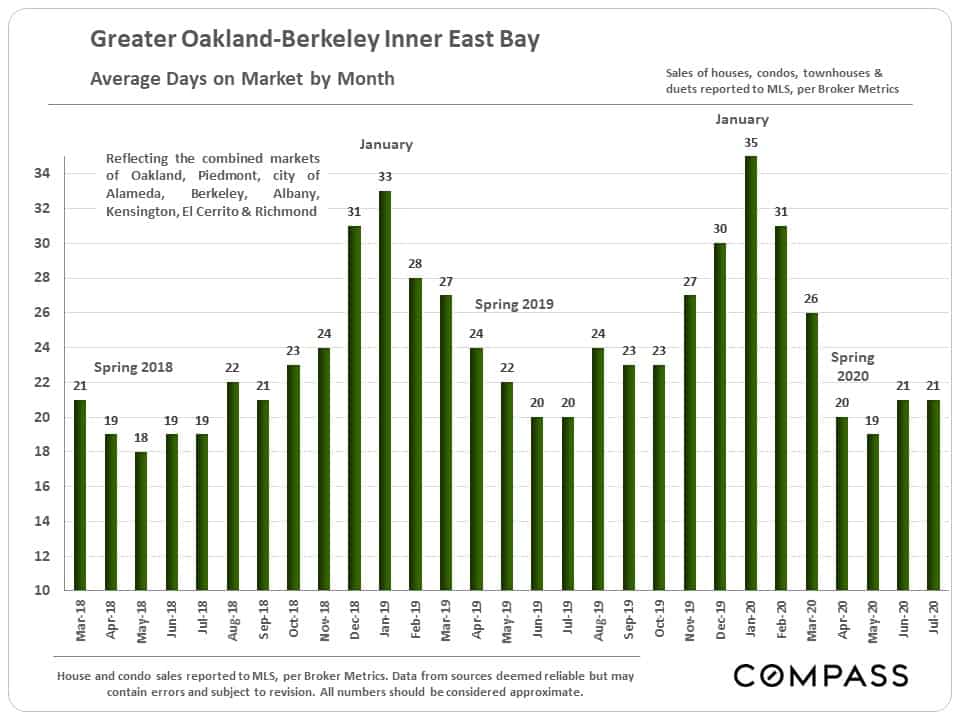
Price reductions, overbidding asking price, average days on market
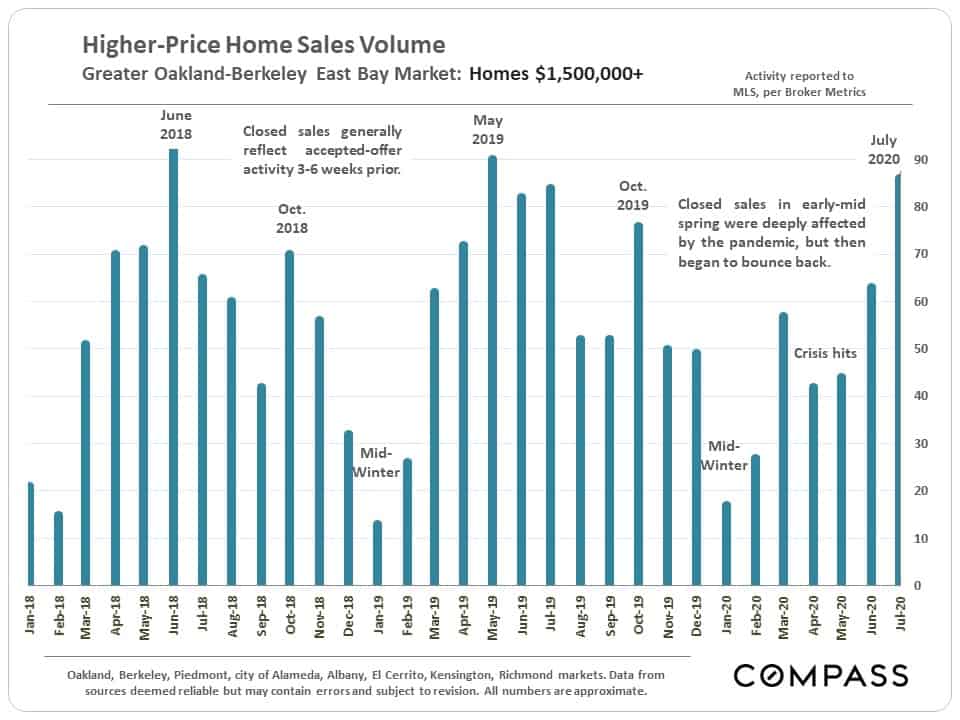
Sales of Higher-Price Homes by Month
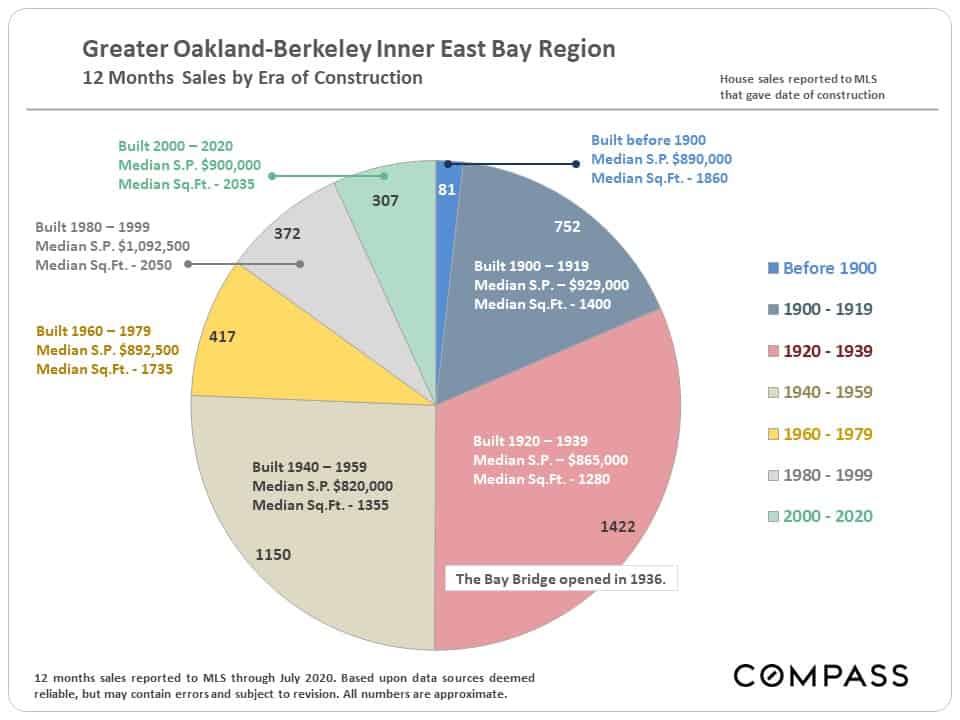
Home Sales by Era of Construction