Oakland, Berkeley, Piedmont and Alameda February Real Estate Market Report
Heading into the 2019 Market
February 2019 Report
As of early February, the government shutdown is over – at least for a couple weeks – the stock market has recovered dramatically from its late 2018 plunge, and interest rates are well down from November highs. A good number of large, local, high-tech “unicorns” continue to plan IPOs in 2019. All these are positive economic indicators for the Bay Area real estate market – but indicators have proven to be quite volatile over the past 5 months, and future movements are not to be taken for granted.
As detailed in previous reports, there was considerable cooling in Bay Area markets in the second half of 2018, but the change in the greater Oakland-Berkeley region was much less dramatic than in most others. The month of January typically has the fewest sales of the year, sales which mostly reflect activity during the December market doldrums: So, we don’t consider its data to be a reliable indicator of conditions or trends. But activity is picking up, and the beginning of the spring sales season – which in the Bay Area can start as early as February – will soon provide more direction as to where the market is heading.
Market Overviews
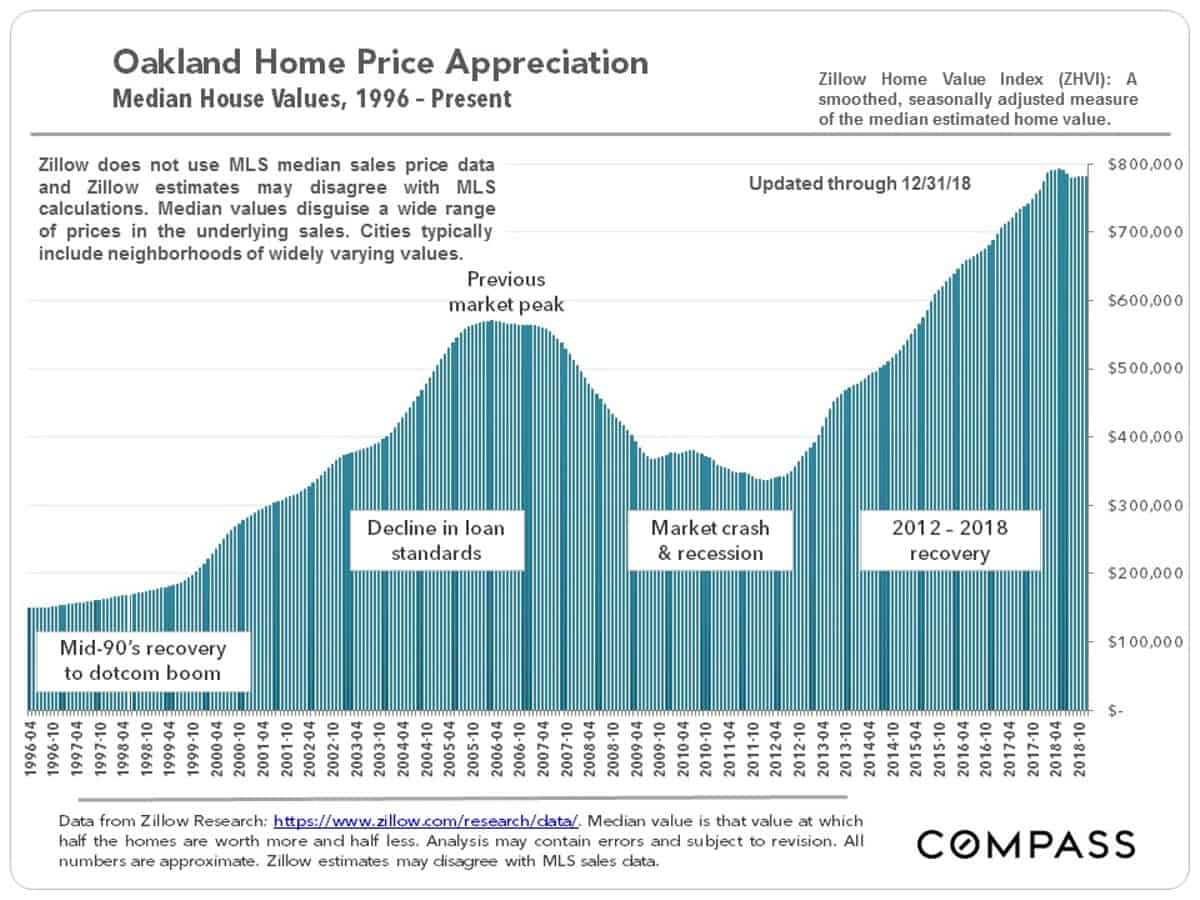
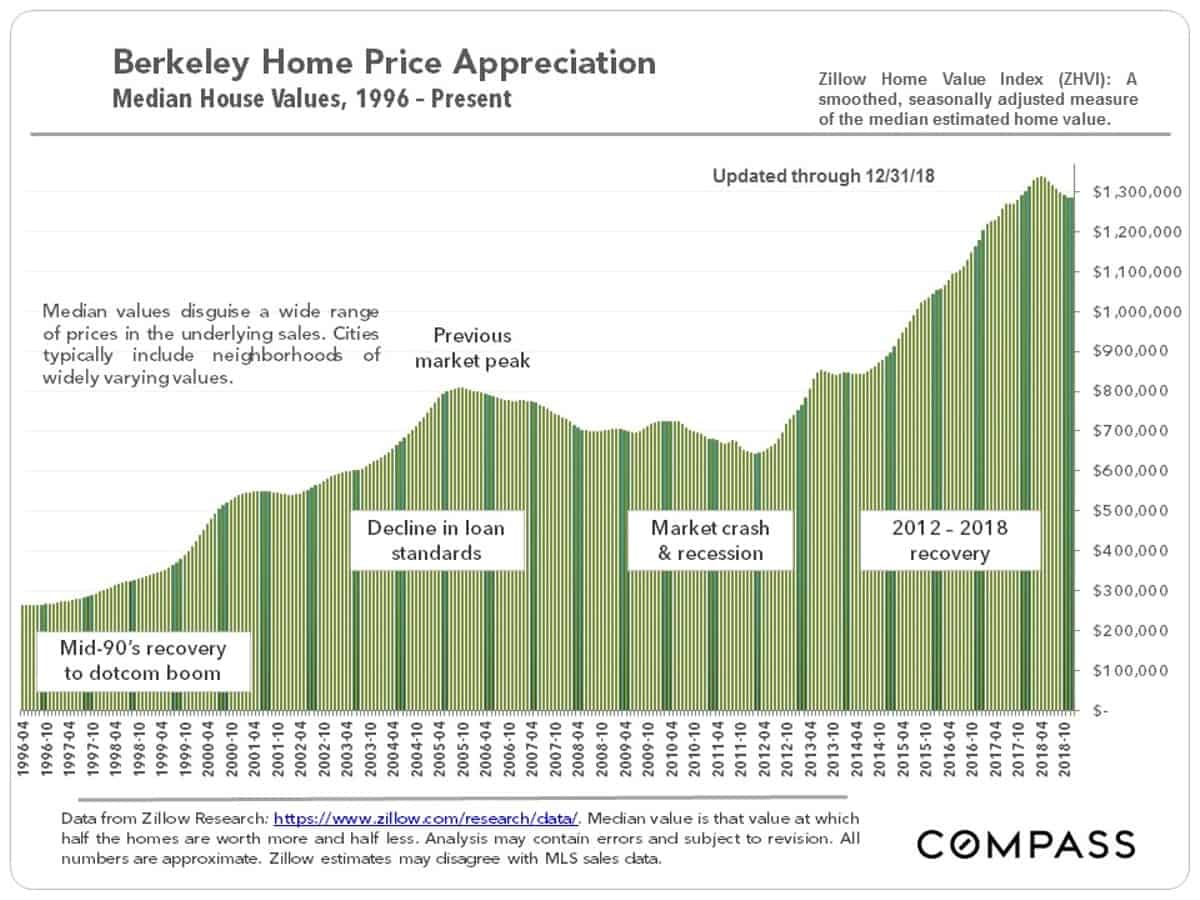
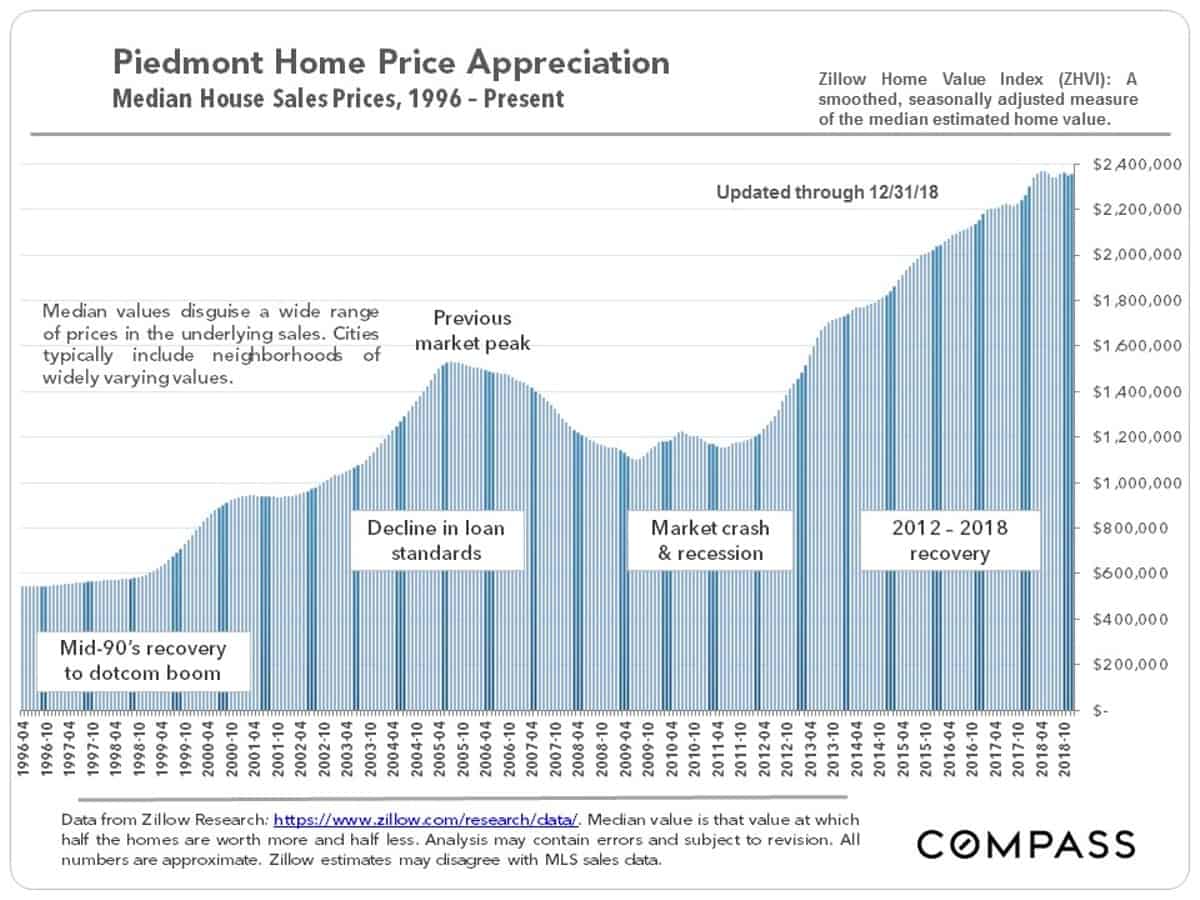
Home Price Appreciation Trends since 1996
In these charts, monthly and seasonal fluctuations have been smoothed out to convey overall home price appreciation trends. Trends are similar across the 4 cities, though Oakland saw a bigger subprime bubble and crash, and then a somewhat steeper recovery since 2012.

Condo Price Appreciation since 1996 for Alameda County
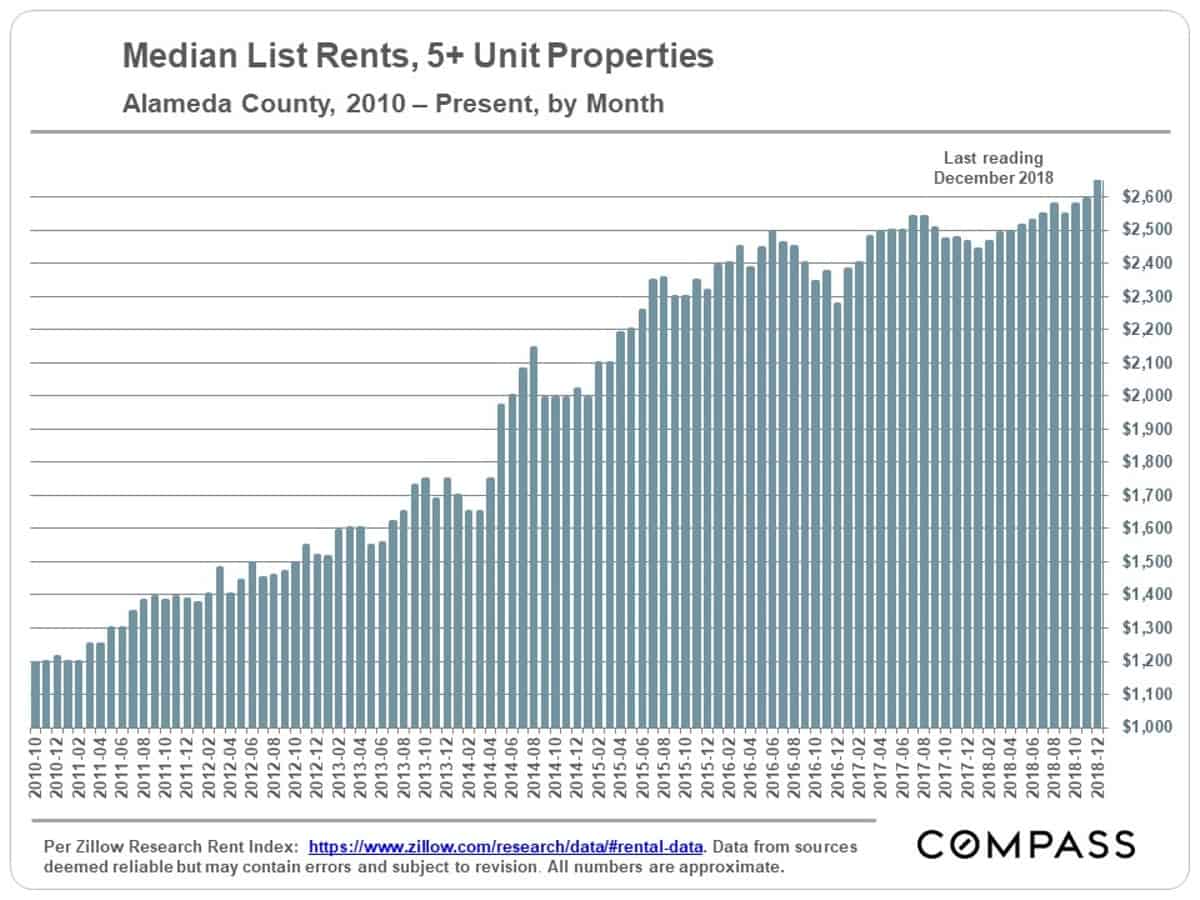
Rent Appreciation Trends since 2010in Alameda County
Generally speaking, there should be a relatively close correlation between home prices and rents: They constitute the 2 main options for paying for one’s housing. It is not an apples-to-apples comparison, because there are other issues at play, such as building equity, the ability to remodel and improve, certain tax advantages (though greatly diminished under new tax laws) and so on. If home prices appreciate while rents plateau or decline, it can be a warning sign of an imbalance in the market.
Home Sizes, Prices & Era of Construction
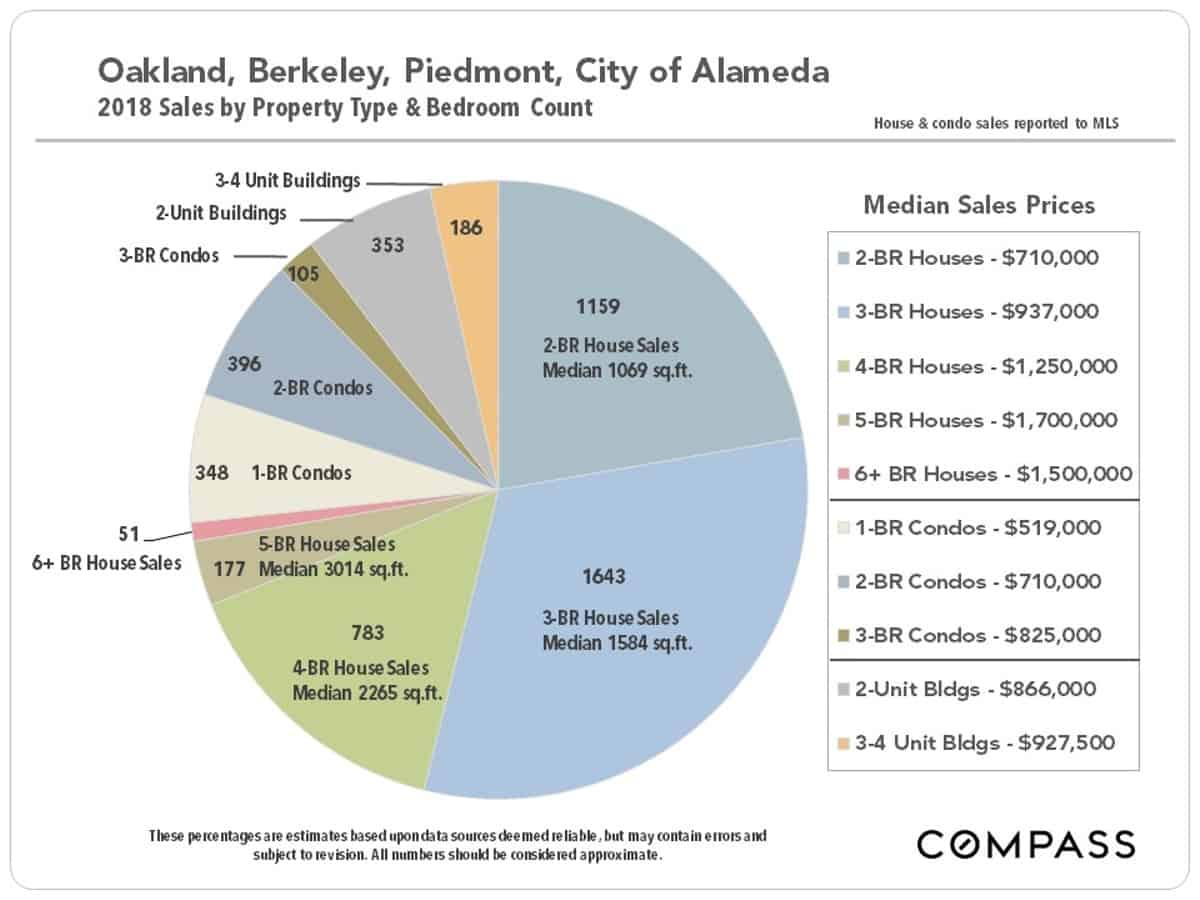
Sales & Prices by Property Type & Bedroom Count
The most common home sale in the area is a 3-bedroom house at a median sales price under $1 million. As an interesting point of context, the most common sale in San Francisco is a 2-bedroom condo at a median price of $1,375,000. A buyer gets much more for their money here than across the Bay Bridge.
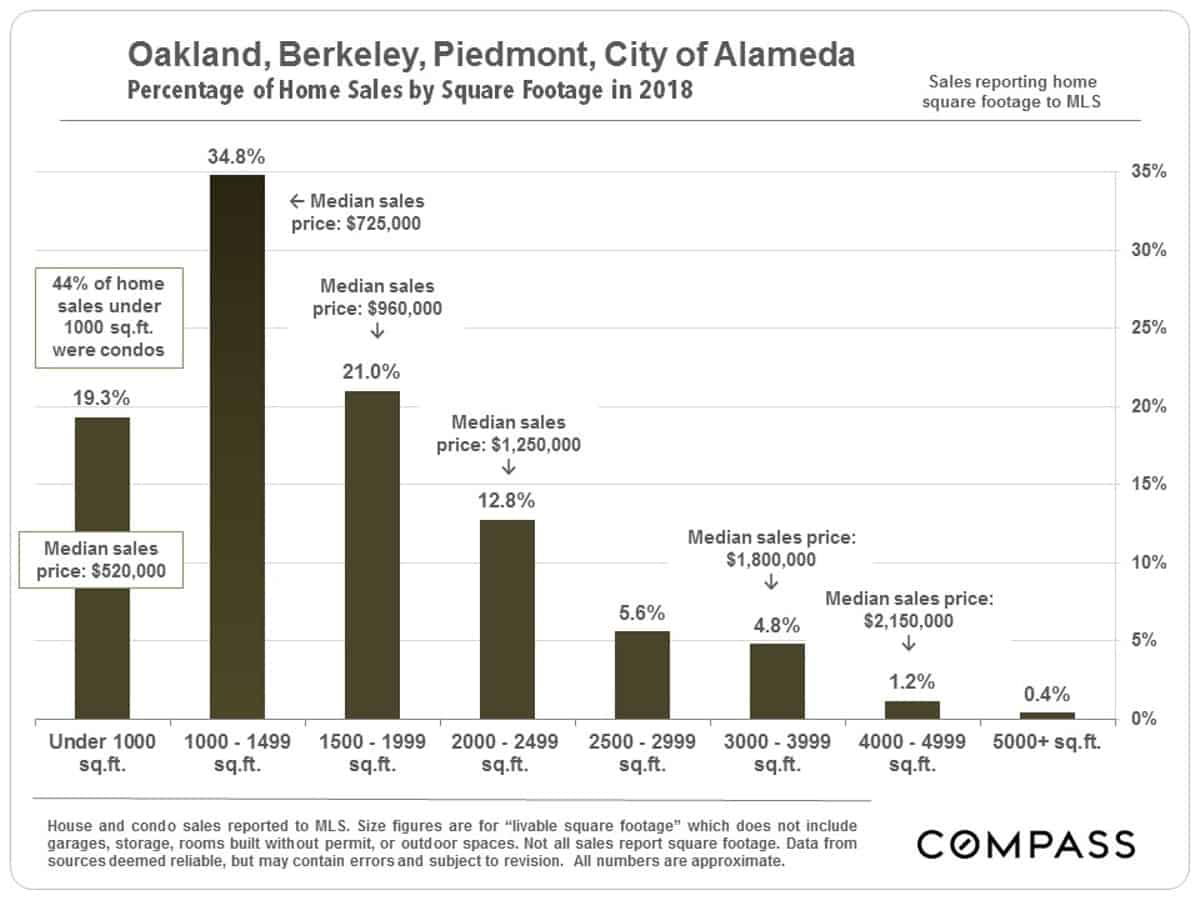
Home Sales by Square Footage
The greater Oakland-Berkeley market has the highest percentage of smaller home sales – sizes of 1500 square feet or less – of any major market in Bay Area. As noted in the pie chart above, it has a comparatively high number of 2-bedroom houses. Much of this has to do with era of housing construction: Just over 50% of its housing units were built prior to WWII. Newer houses tend to be bigger: When the Oakland hills rebuilt after the big fire in 1991, home sizes generally increased to make greater use of valuable lots. Unsurprisingly, bigger home sizes are typically found in more affluent neighborhoods.
Sales by Era of Construction

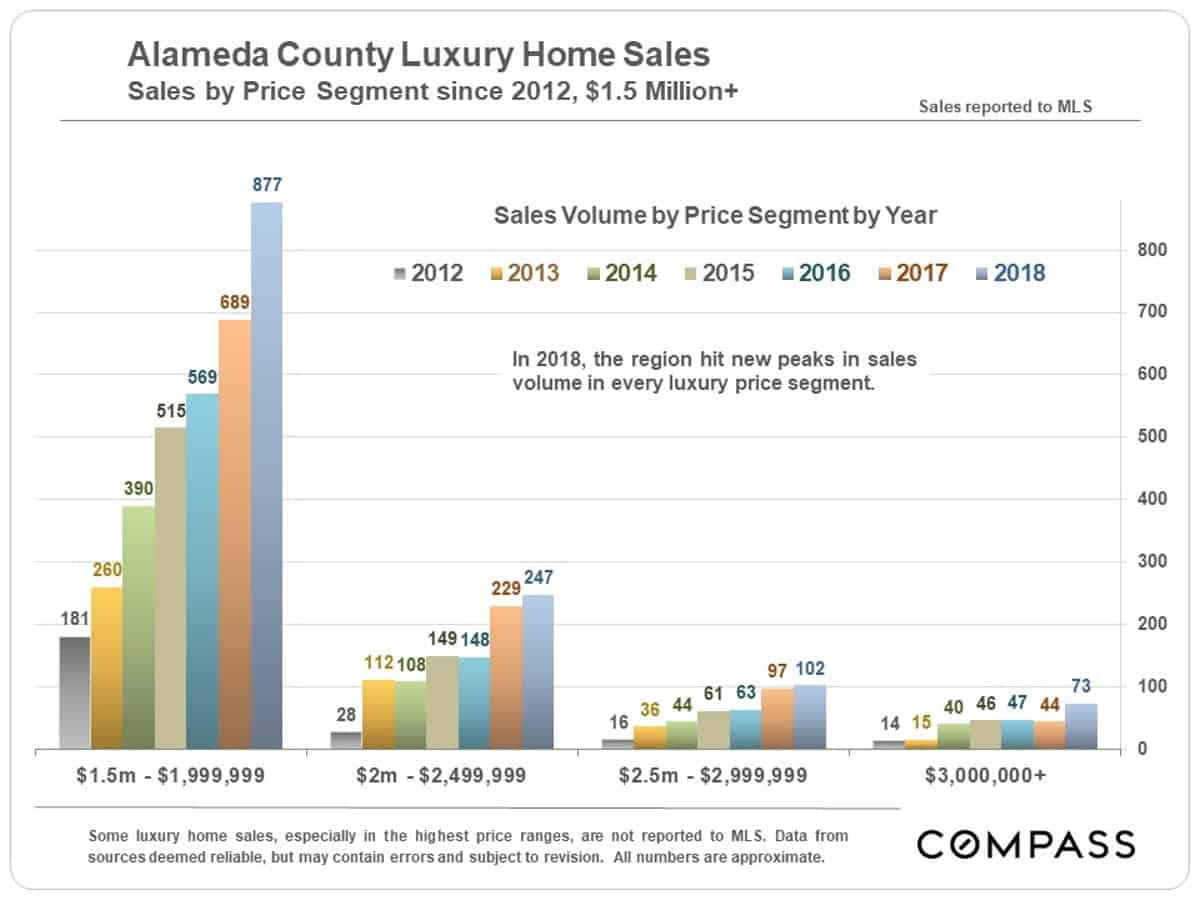
Luxury Home Sales
Luxury home sales in Alameda County hit new highs in 2018 in every price segment, as was the case in the four cities covered in this report.
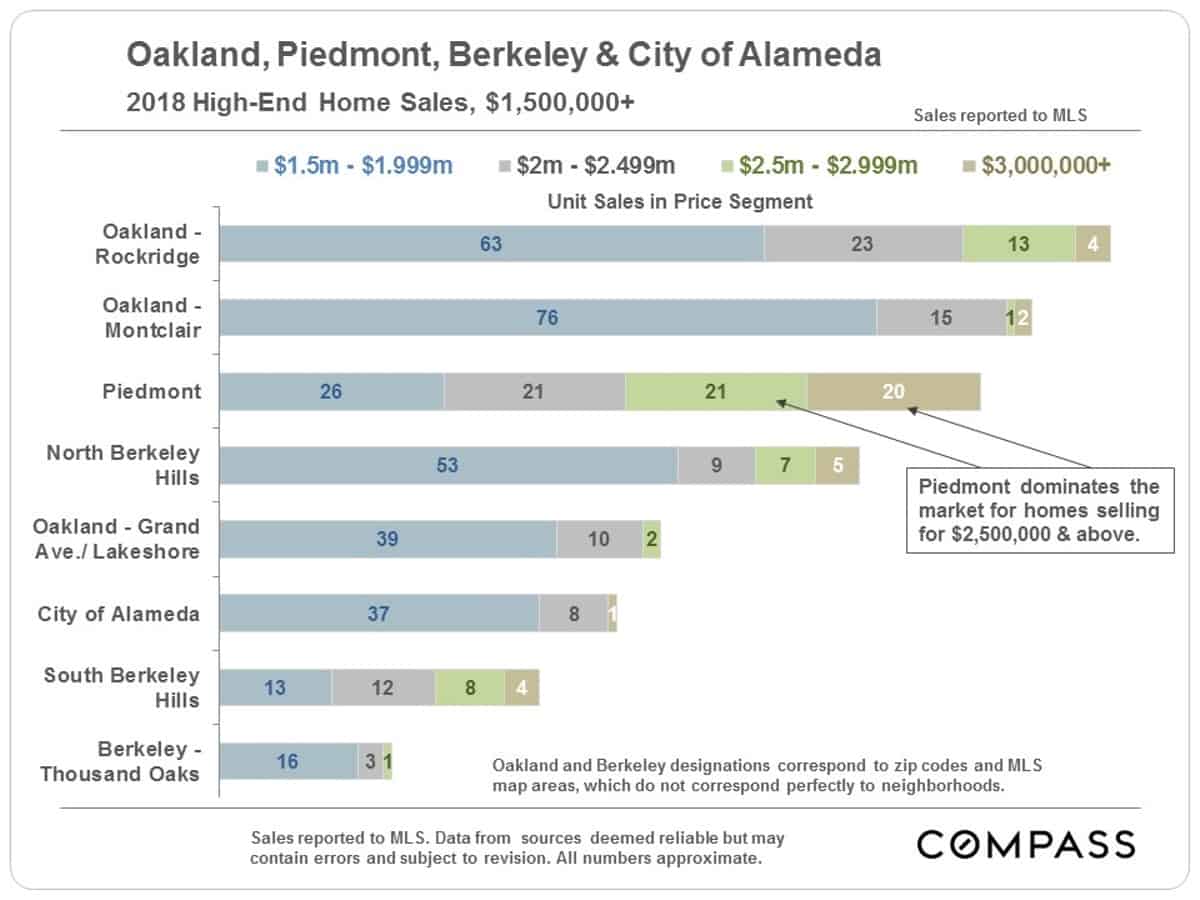
The neighborhoods delineated on the next chart are usually representative of larger MLS areas, which often contain parts of different neighborhoods. Still, the chart gives an idea of where luxury home sales are clustered. Piedmont is the highest priced home market in the East Bay.
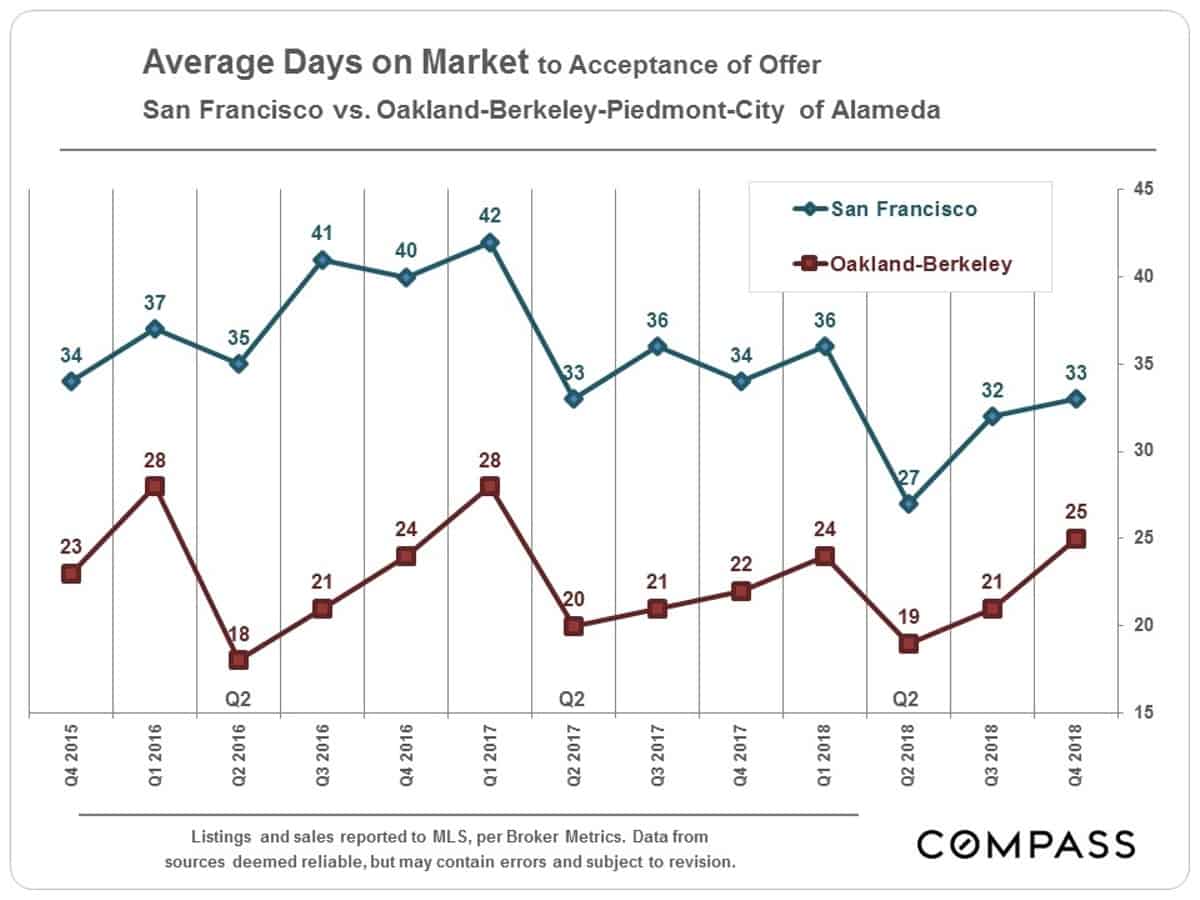
Average Days on Market As Compared to San Francisco
For the last few years, homes have been selling more quickly here than in San Francisco. Much of this has to do with the area’s much greater affordability, but, of course, many people simply prefer to live here for a variety of excellent reasons.
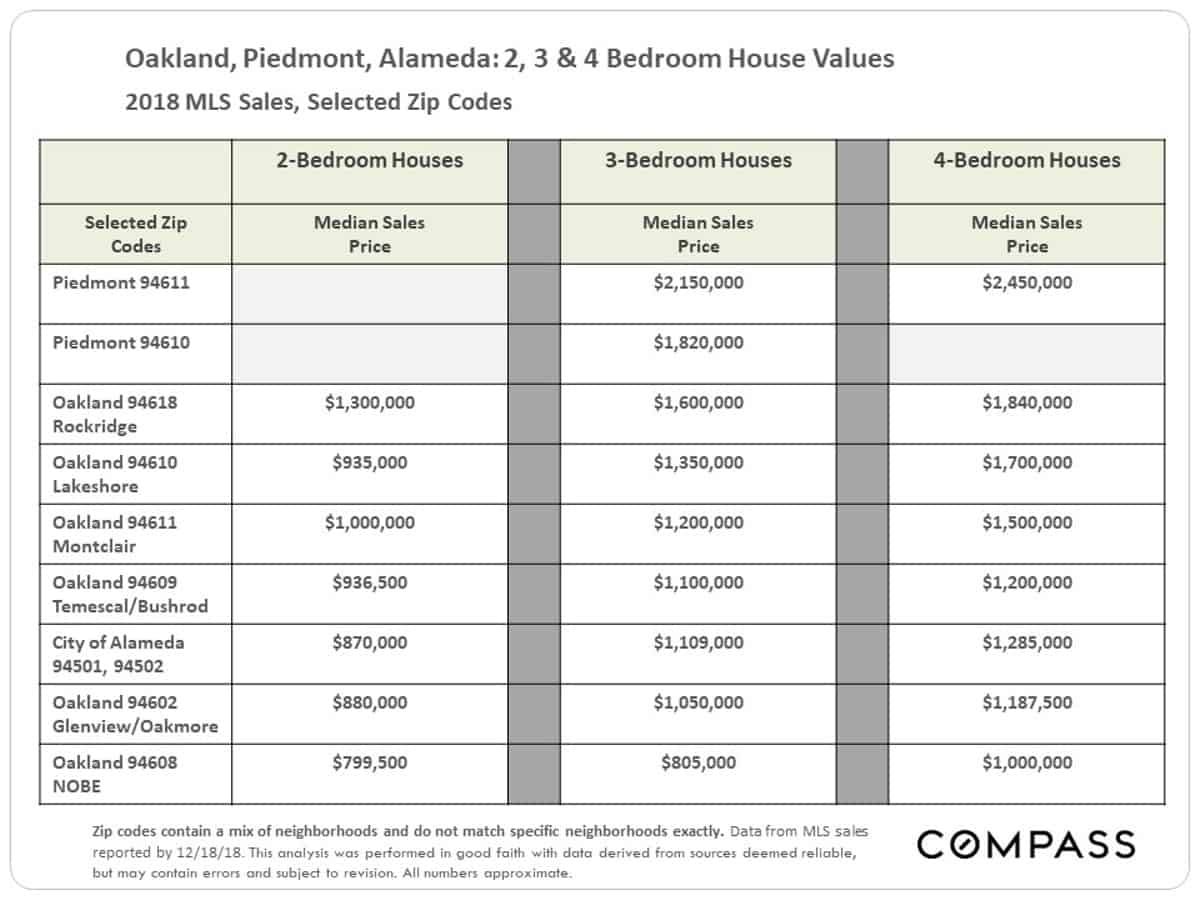
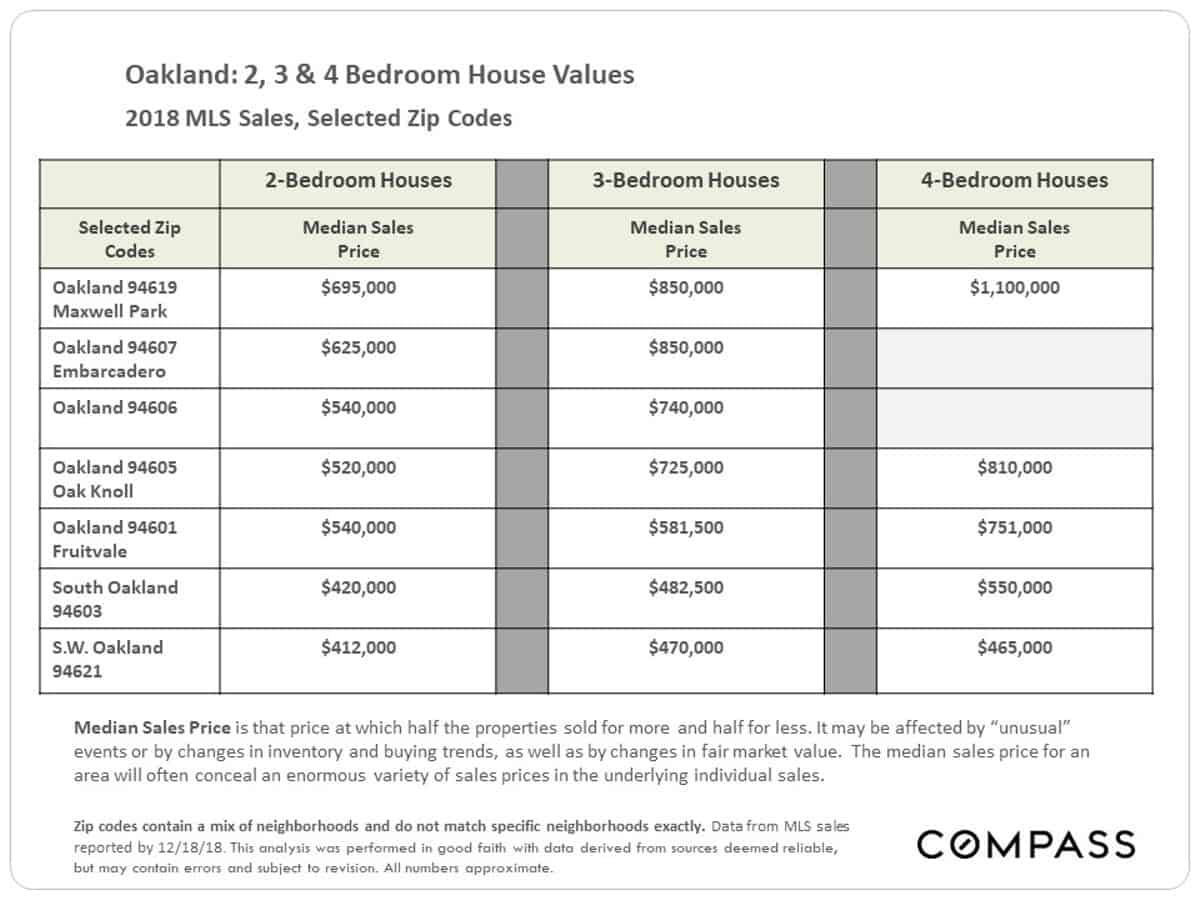
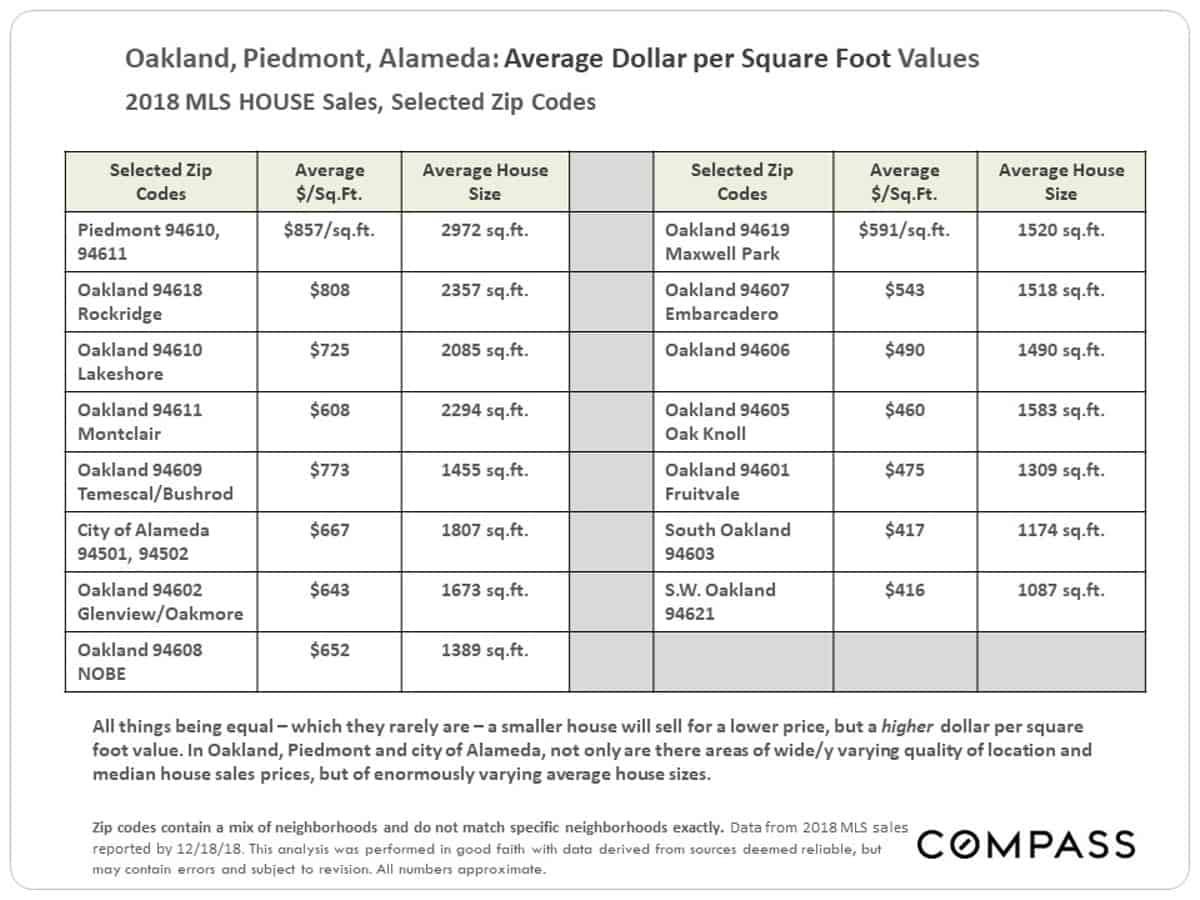
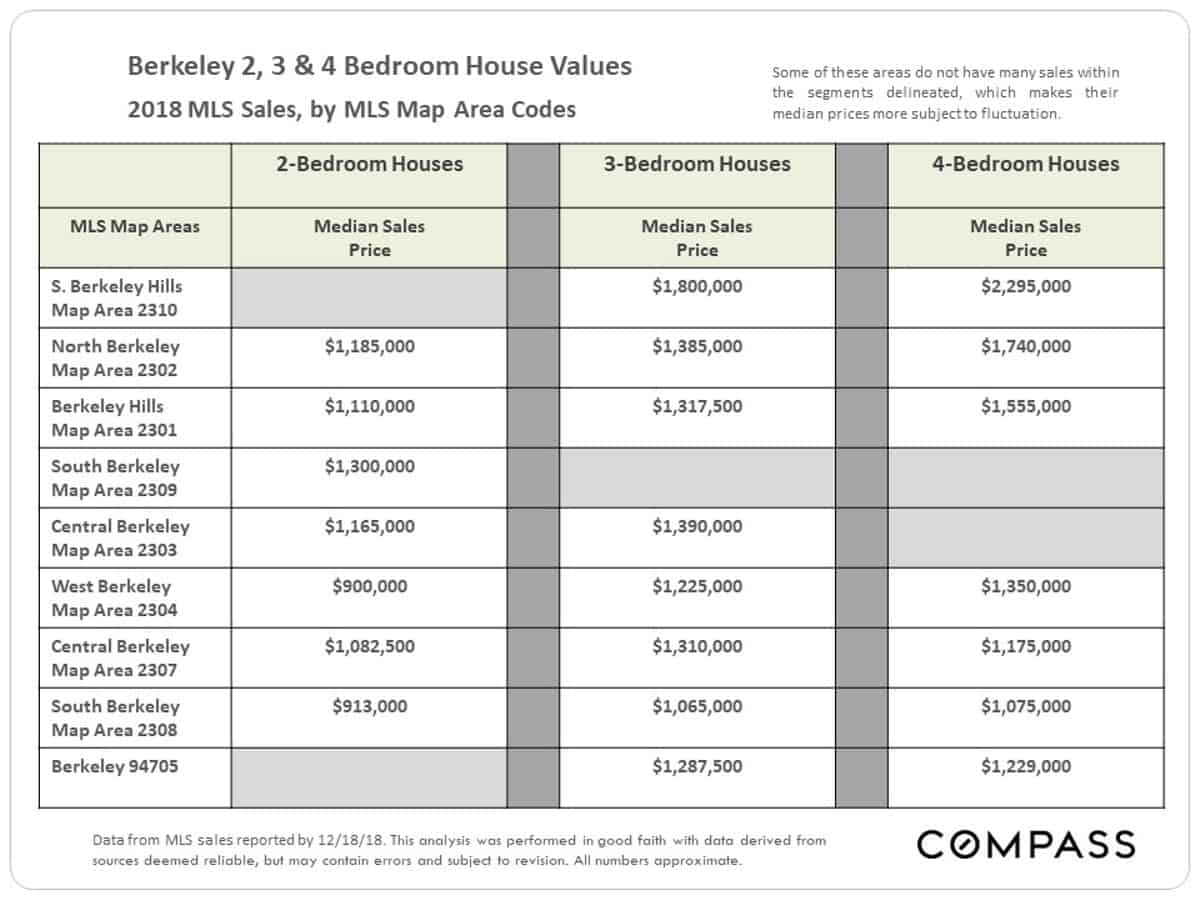
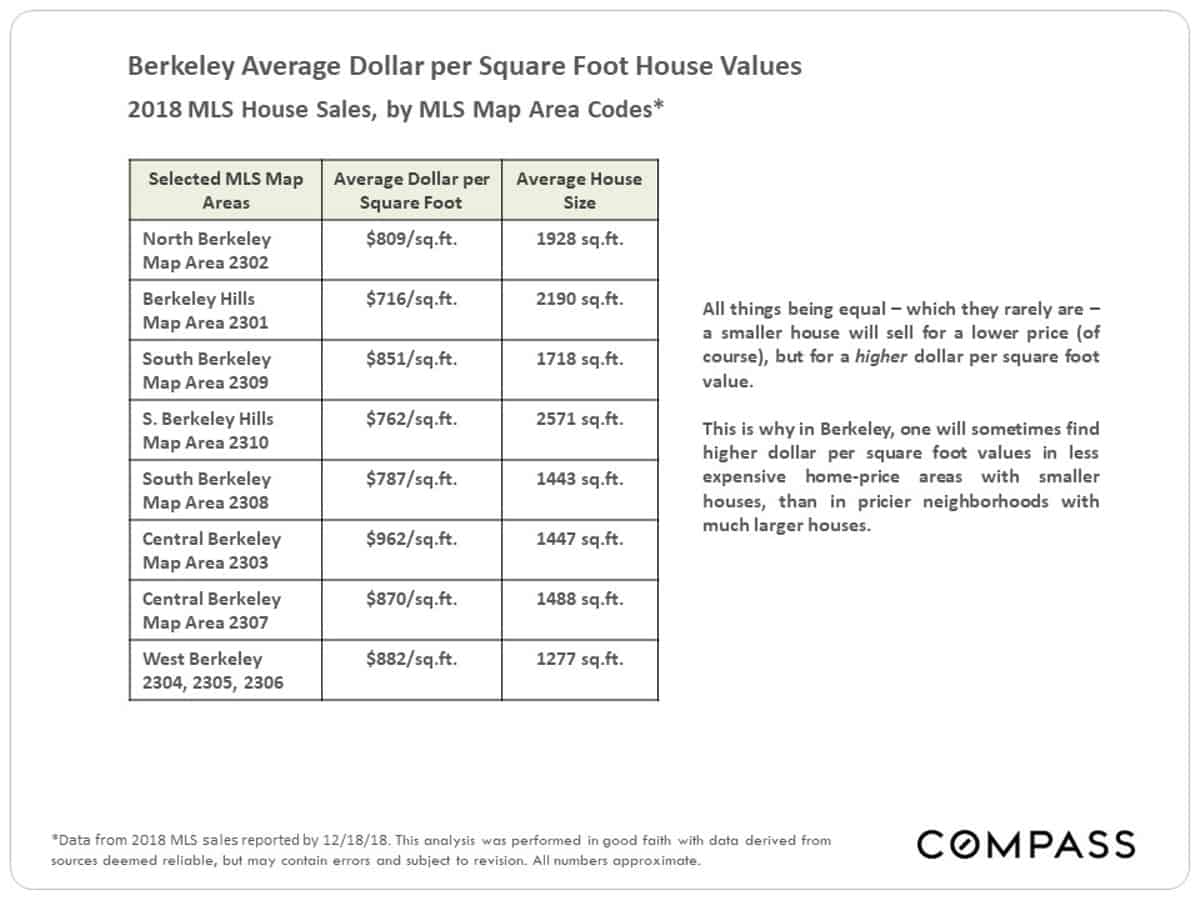
Home Value Tables
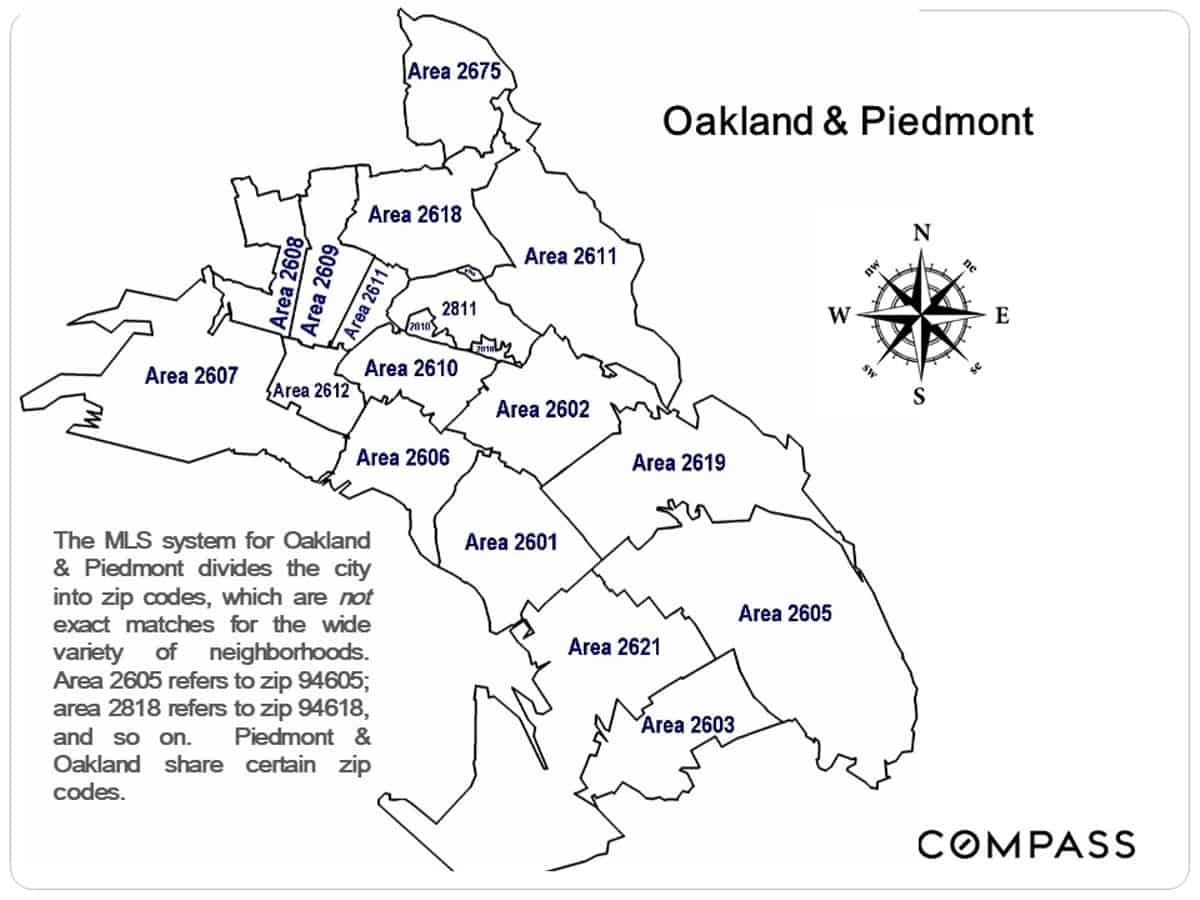
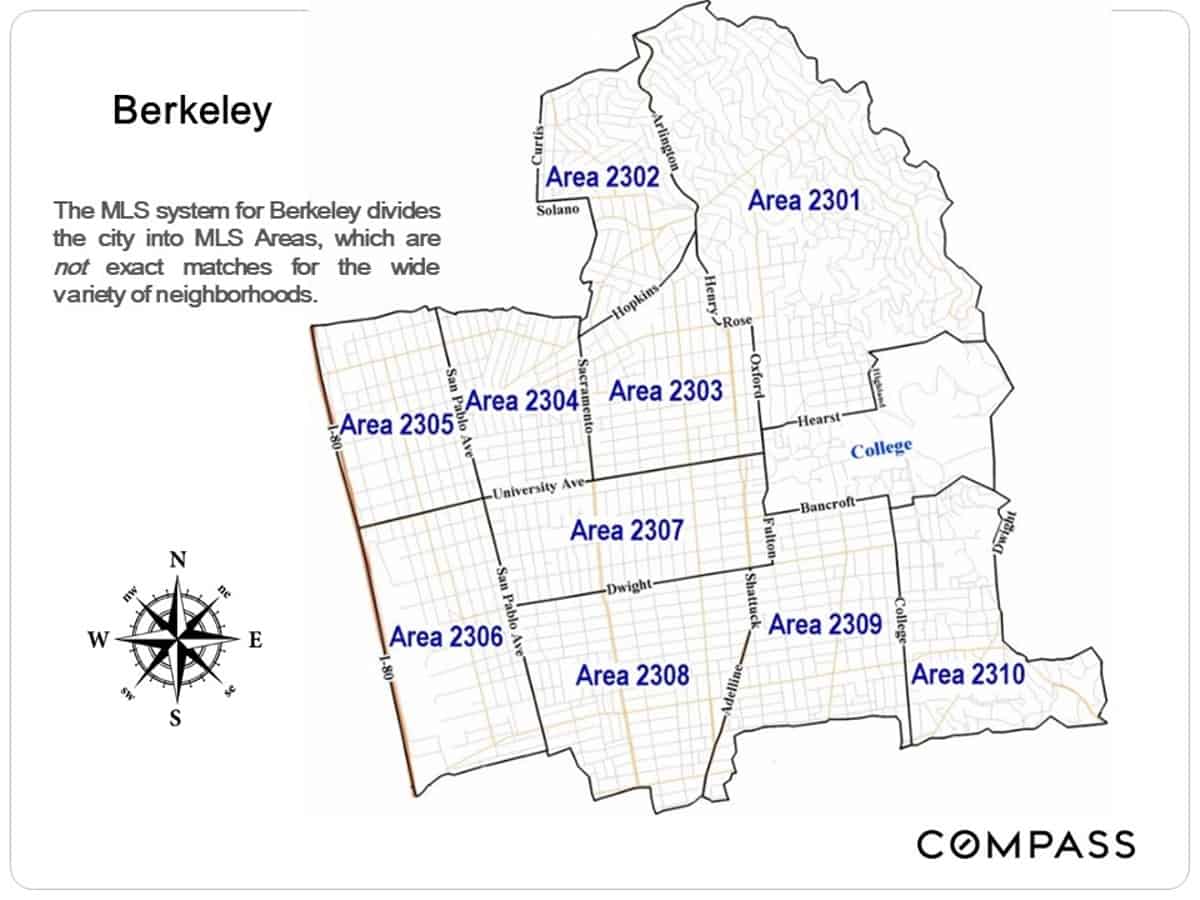
Instead of breaking the market into neighborhoods, East Bay MLS divides it into zip codes for Oakland, the city of Alameda and Piedmont, and into map areas for Berkeley. This is not ideal because much of the time these delineations don’t align particularly well with neighborhoods. But using the maps below, one can get a general idea of the widely varying home prices, average dollar per square foot values, and average home sizes by location within cities. But remember that the representative neighborhood names used for the MLS areas are inexact and incomplete.
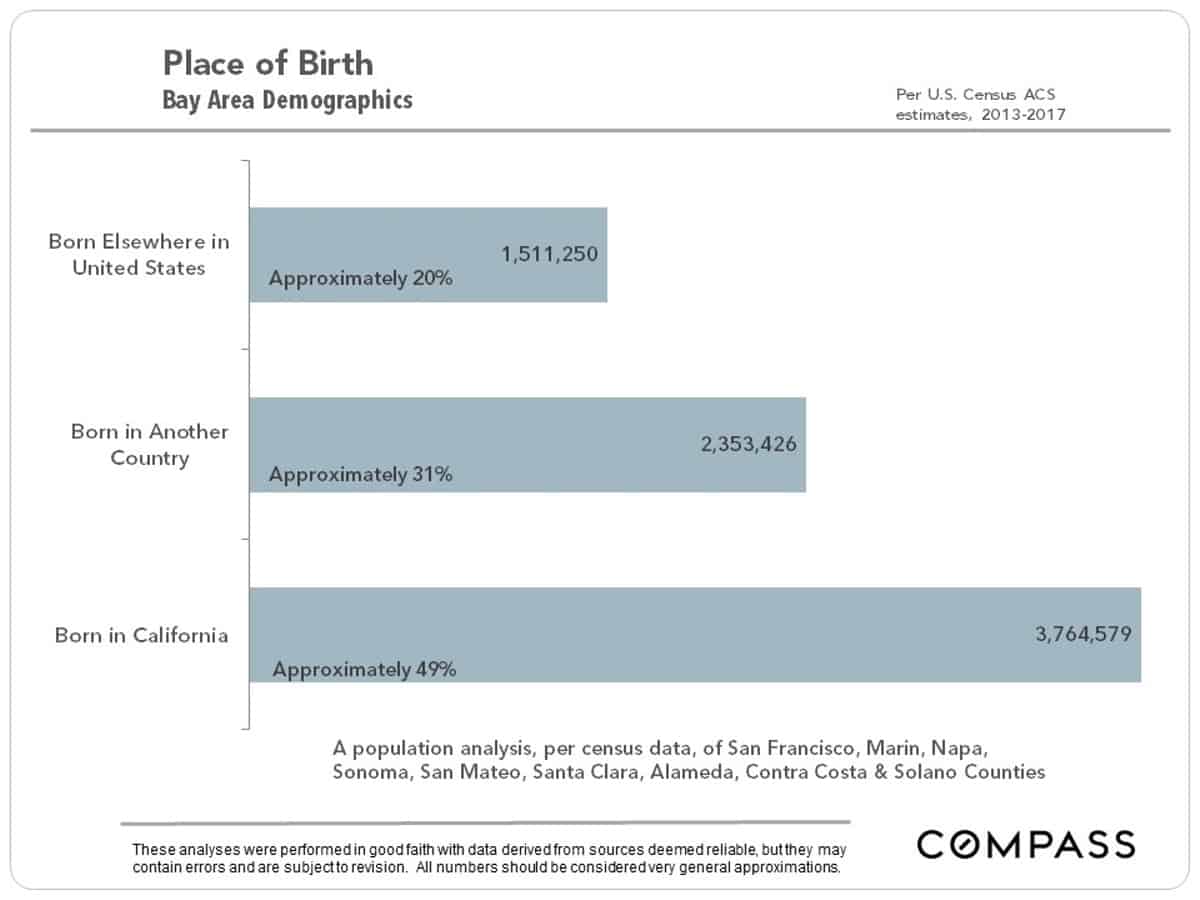
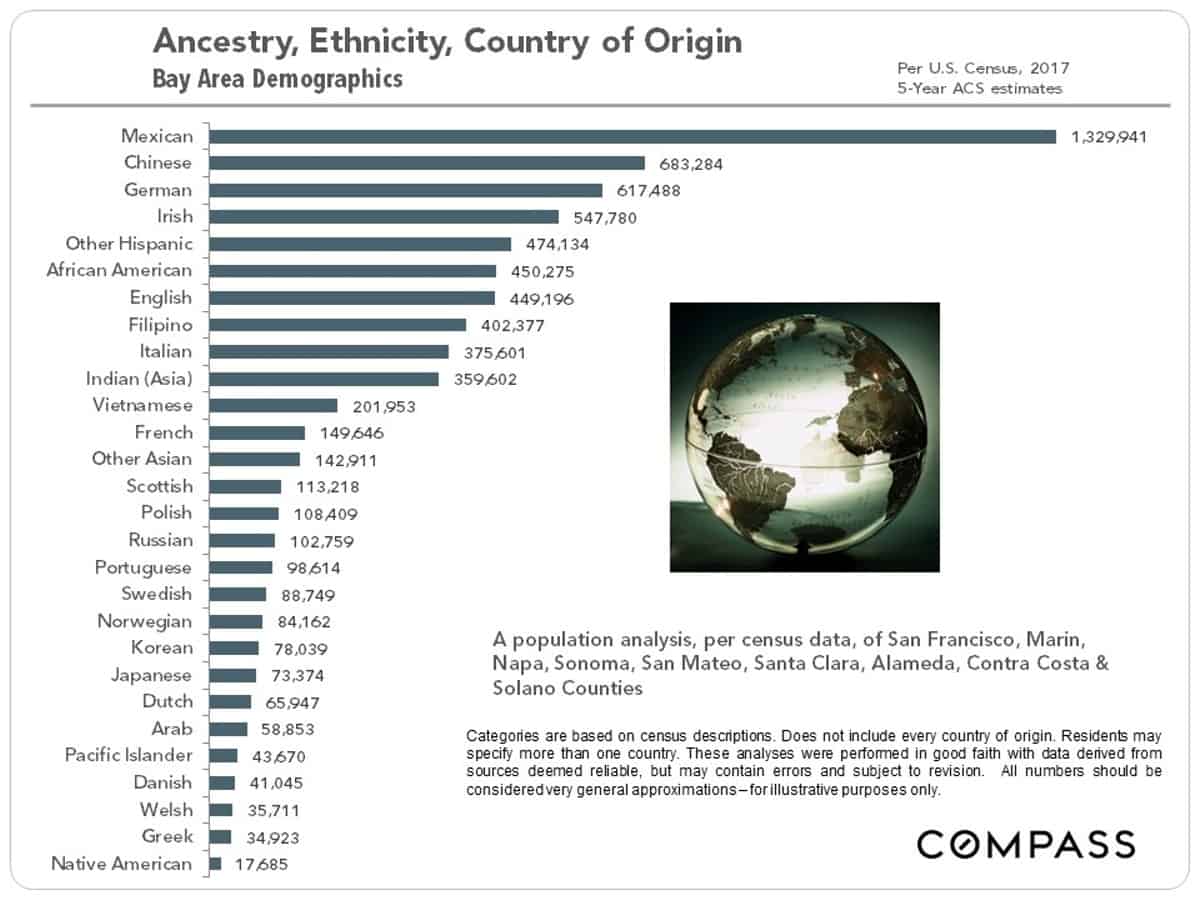
A Very Multi-Cultural Place – Bay Area Demographics
Before looking at the charts below, here is today’s demographics quiz question: What 4 nationalities account for the origin of the highest numbers of Bay Area residents?
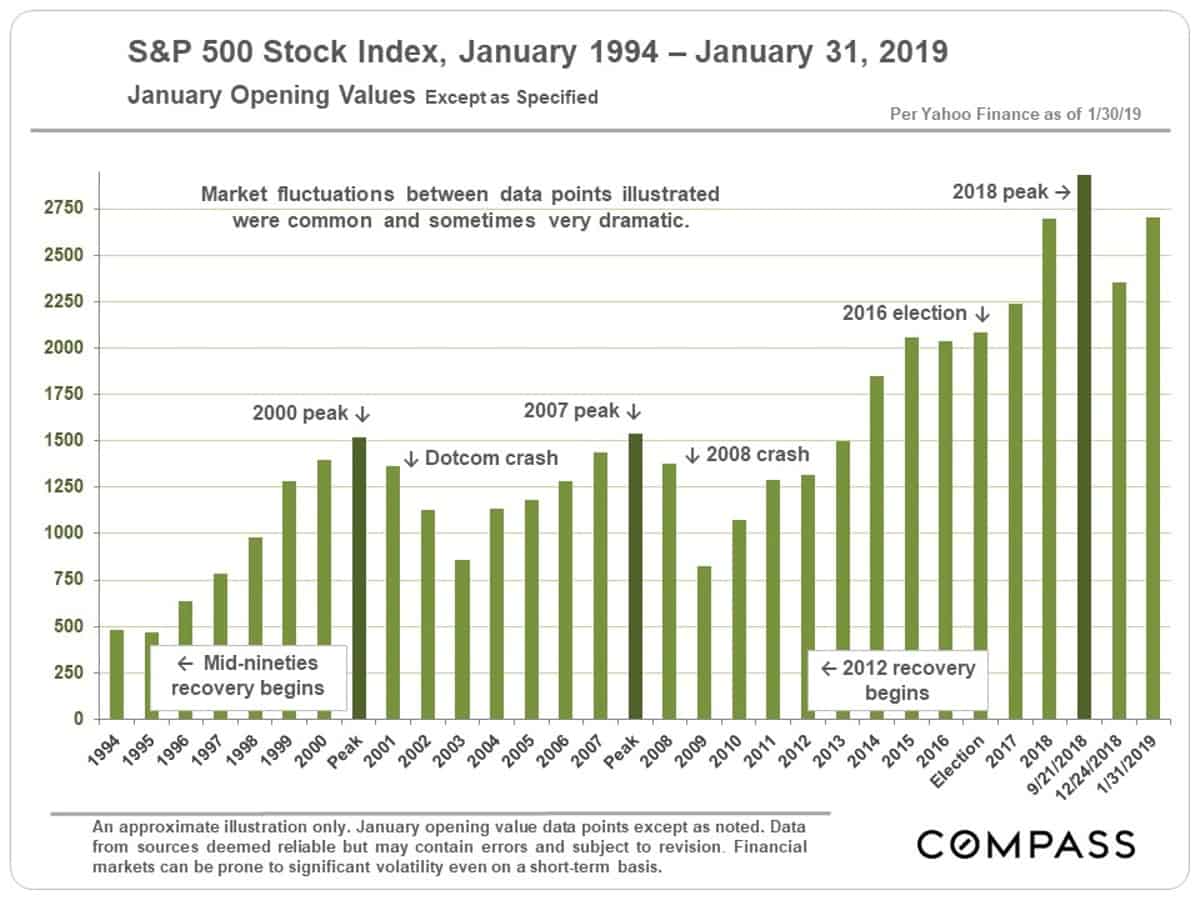
Stock Prices & Interest Rates
As seen in the first chart below, the changes in the S&P 500 Index have been very dramatic since the 2016 election, seeing an enormous jump to its most recent peak in September 2018 before entering a period of substantial volatility. Ups and downs and major volatility in financial markets – and their effects on household wealth – can play a large role in local real estate markets, especially in the higher price segments.
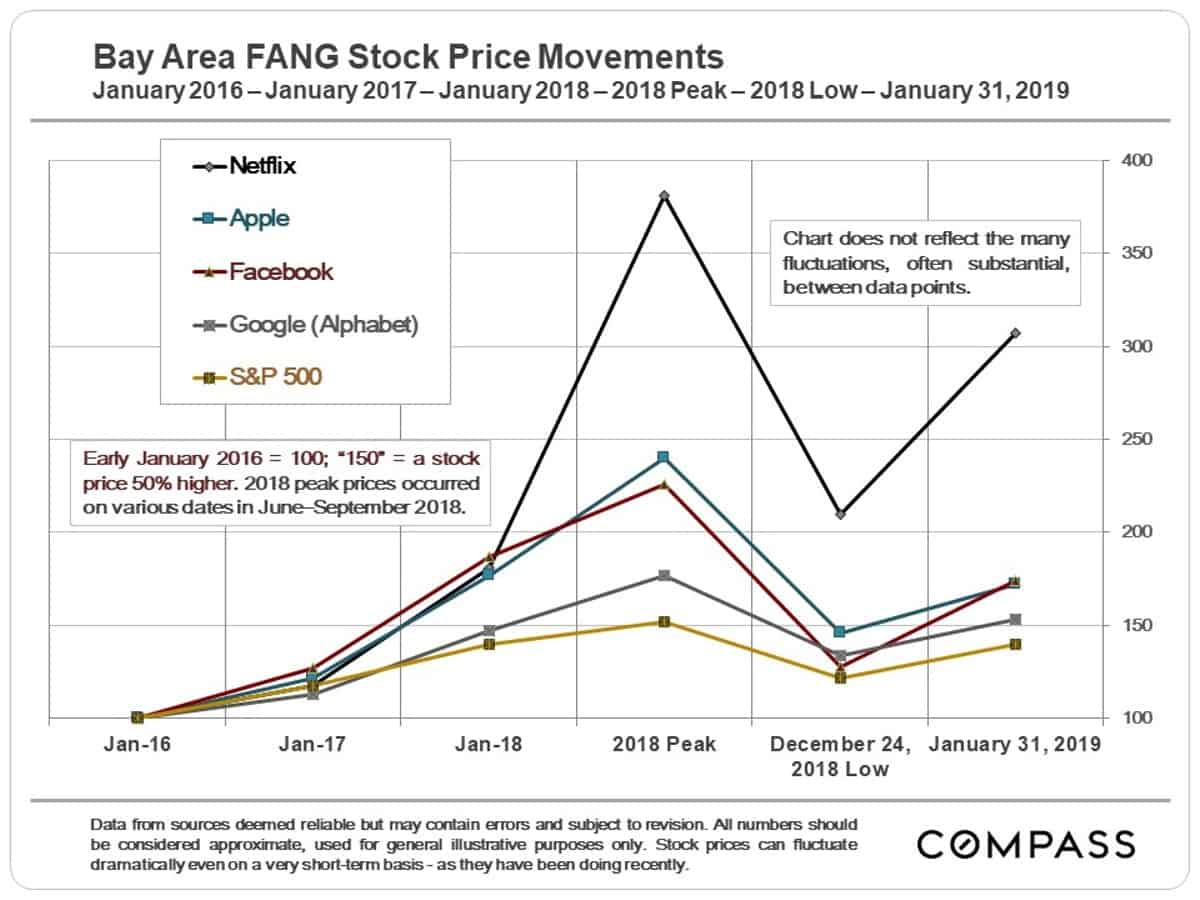
As illustrated in this next chart, the movements in the S&P 500 have been distinctly modest compared to the stock price changes of some of our local high-tech giants. It has been has been a wild, queasy ride for investors and stock-owning employees – and for many home buyers.
If the big, local unicorn IPOs go forward as expected, and the market greets them enthusiastically, that could play a substantial role in demand as thousands of employees suddenly feel considerably more affluent.
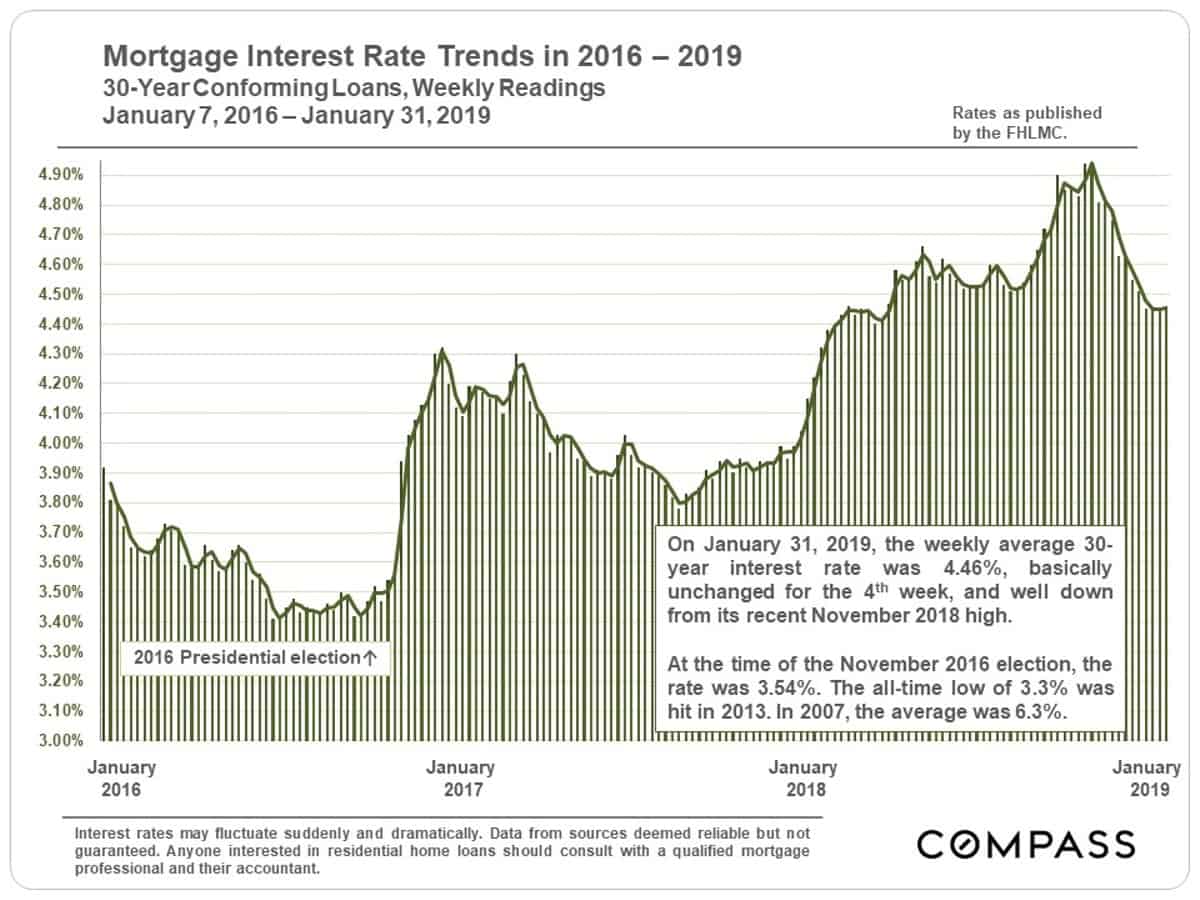
Interest rates are a major factor in housing costs and the ability to qualify for home loans. After hitting its most recent high in November, rates have dropped off considerably. Such declines sometimes spark renewed buyer motivation to move forward quickly.