Oakland, Berkeley, Piedmont and Alameda April Real Estate Market Report

Oakland, Berkeley, Piedmont & City of Alameda Real Estate
Home Prices, Sales & Statistics; Stock Markets; Interest Rates and Unicorns
April 2019, Q1 Report
A substantial portion of Q1 statistics reflect new listings and accepted offers occurring during the mid-winter market doldrums (Thanksgiving to mid-January). In November and December 2018, the stock market plunged drastically from its all-time high in September, and interest rates hit their highest point in years: these factors negatively affected buyer demand. Then both turned in dramatically positive directions in early 2019. So, Q1 statistics reflect economic conditions in both Q4 2018 (very negative) and Q1 2019 (very positive). It is also the quarter with the lowest sales volume.
Of all the Bay Area housing markets, the greater Oakland-Berkeley market has cooled the least over the past 3 quarters.
The spring selling season – whose data starts to show up in March, but is mostly reflected in Q2 – is the most active of the year, and often sees the highest rates of appreciation. As always, there are many economic factors at play impacting Bay Area markets, some of which are discussed below.
Year-over-Year & Longer-Term Trends
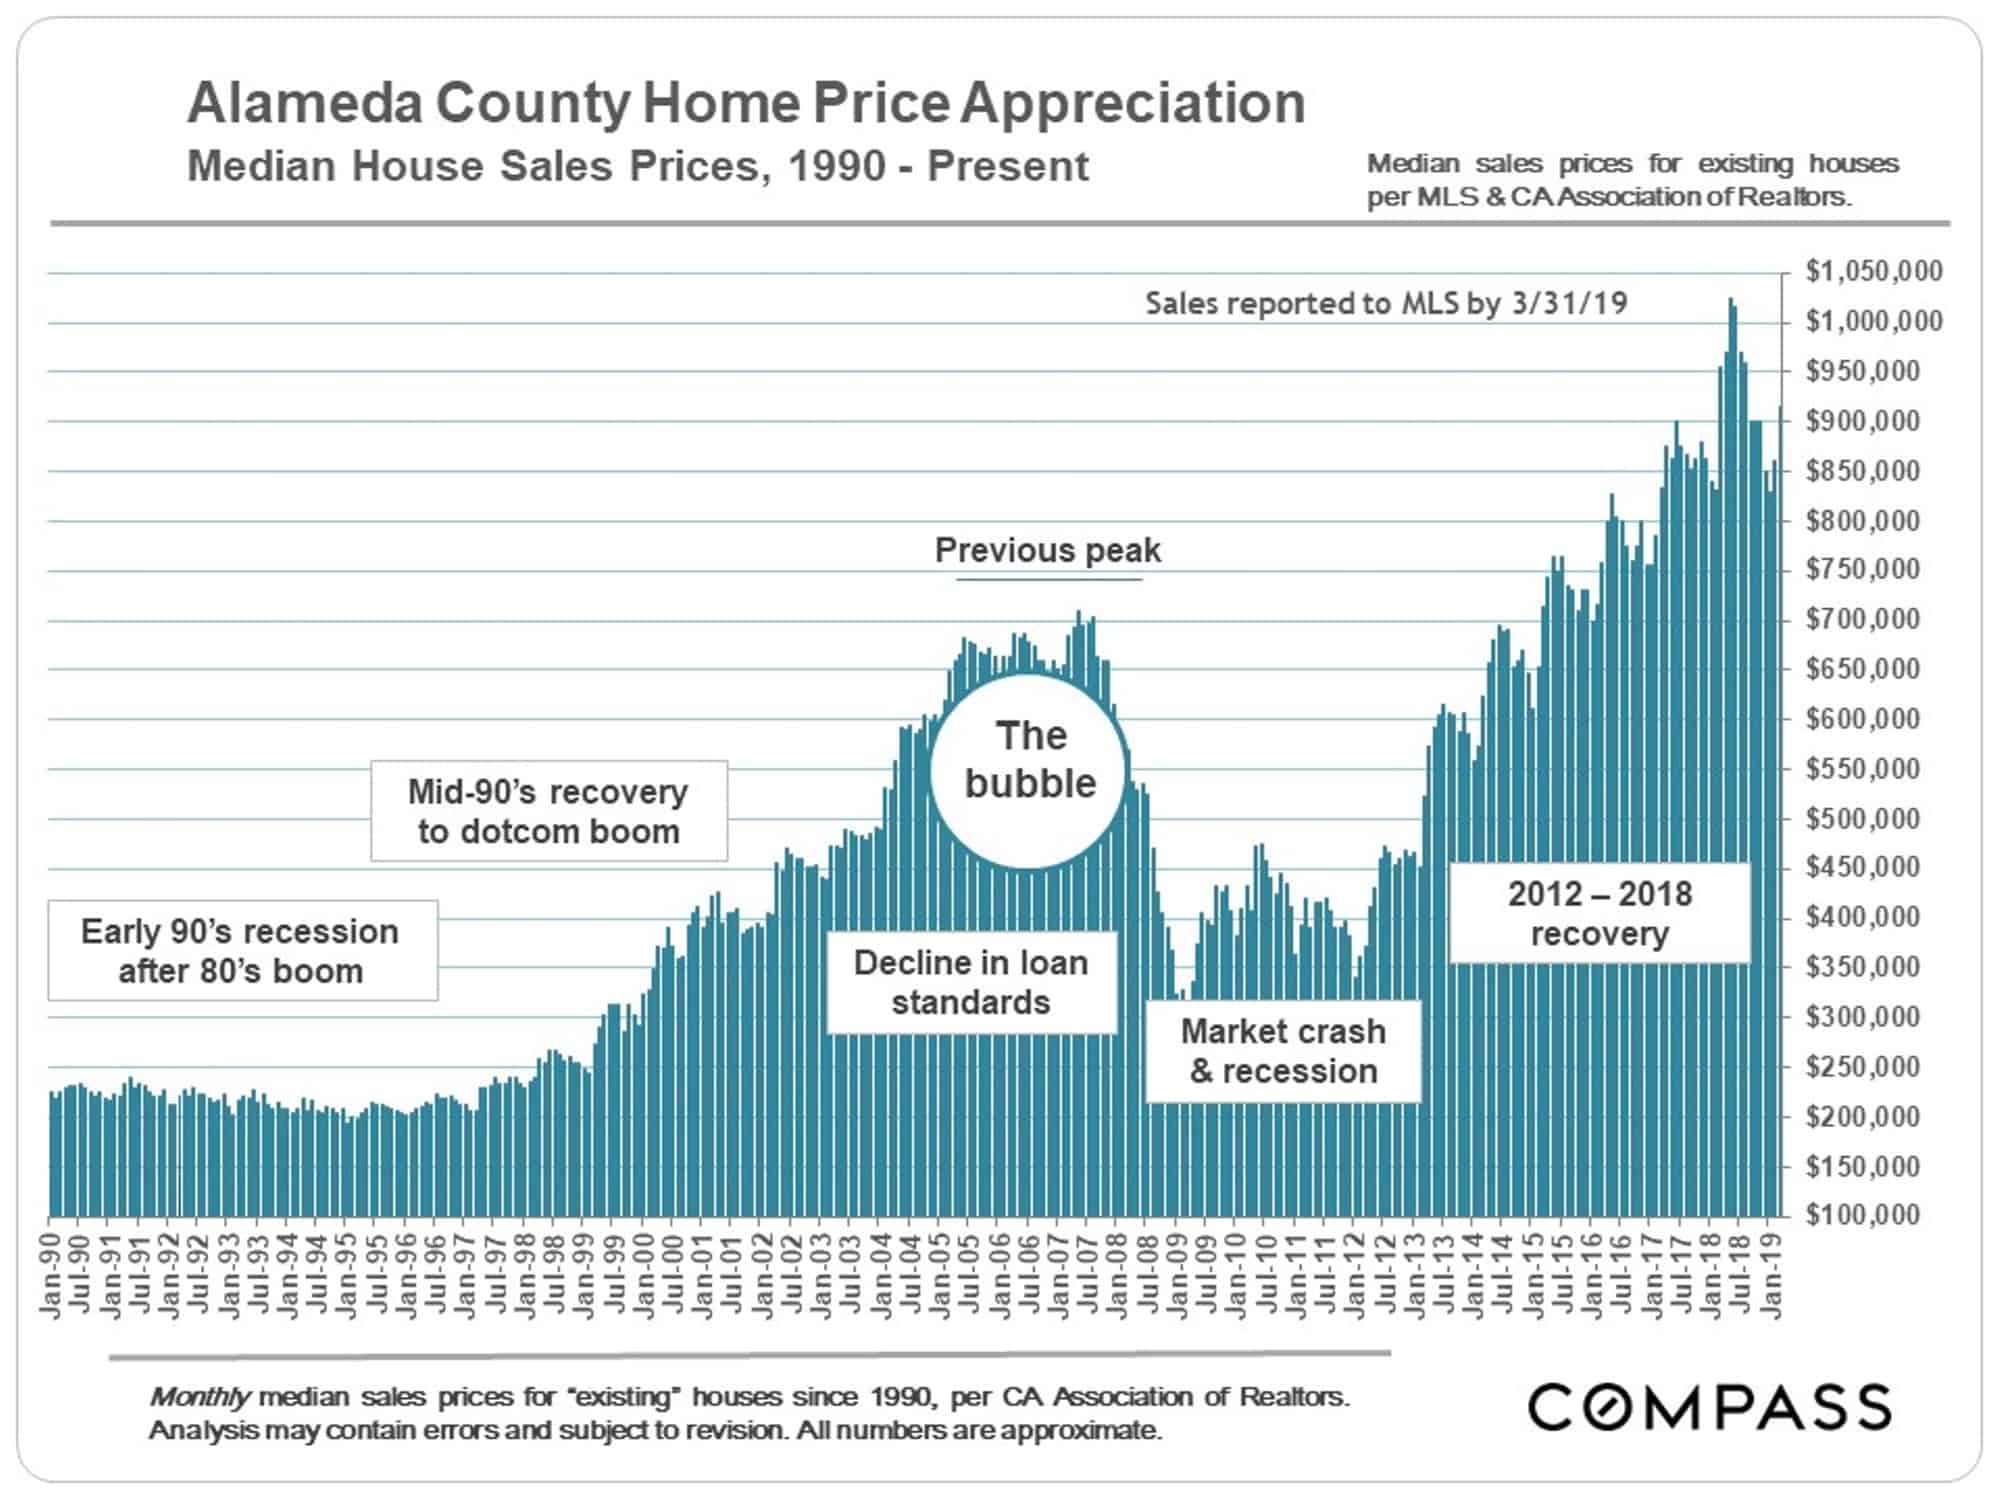
Median Sales Prices
This long-term median house sales price trend chart reflects the entire county of Alameda.
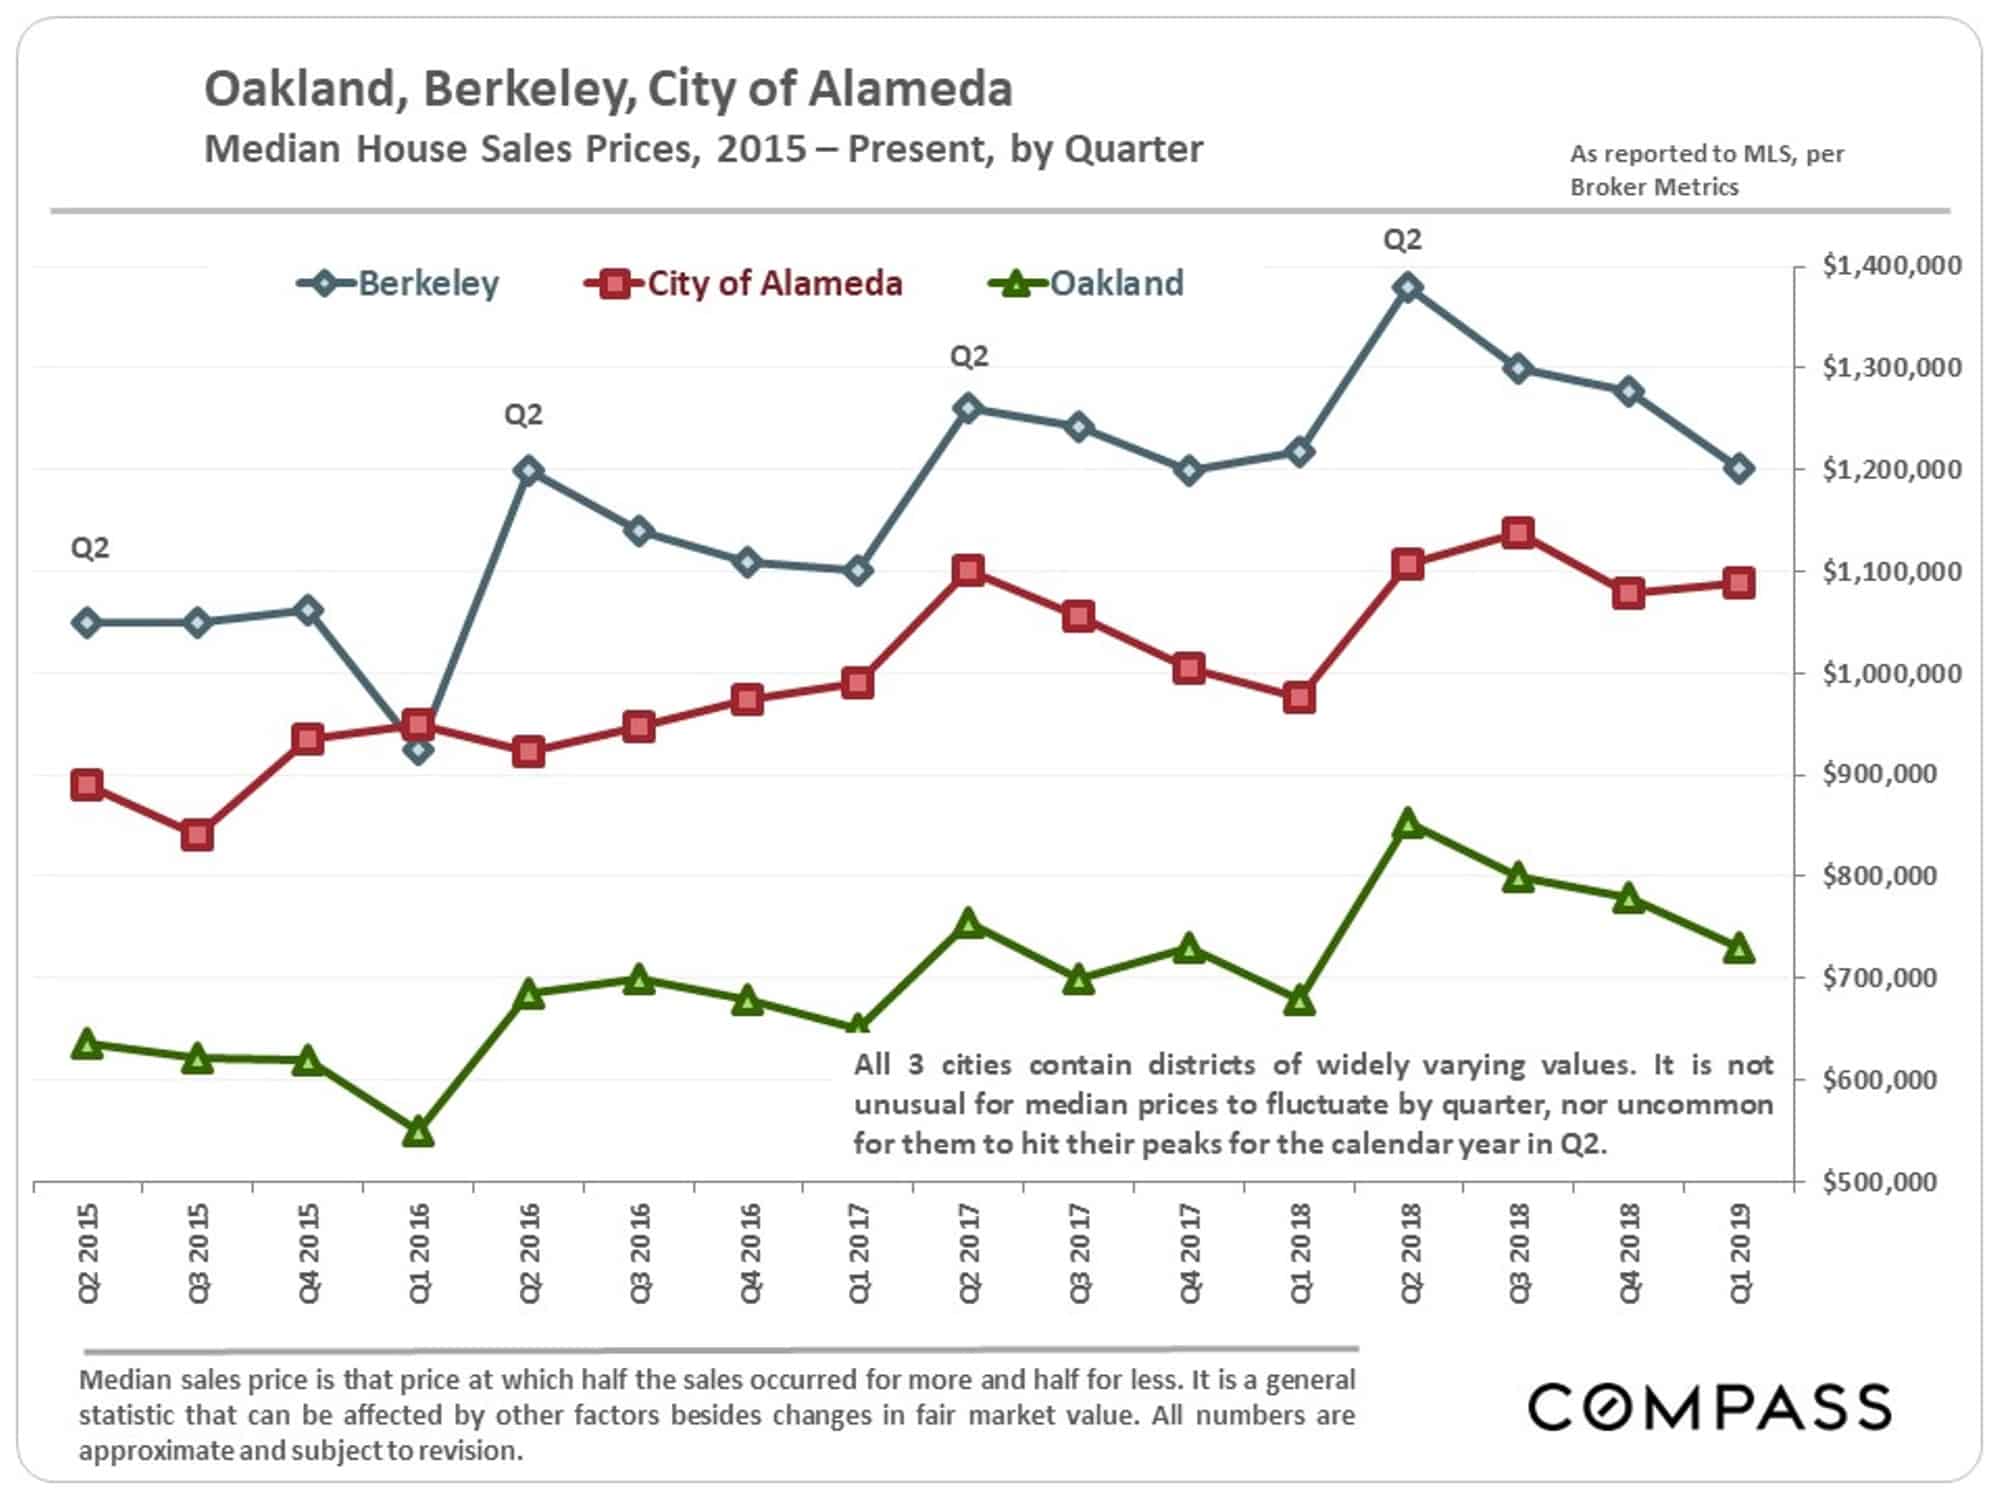
In the two charts below, we focus on the cities of Oakland, Berkeley and Alameda. Piedmont has a much higher median house sales price ($1 million higher than Berkeley) and a much lower quarterly volume of sales (sometimes 15 or fewer sales): the first means its dynamics are somewhat different than the other cities, and the second means its quarterly statistics are less reliable. However, we do have median price statistics specific to Piedmont if you are interested.
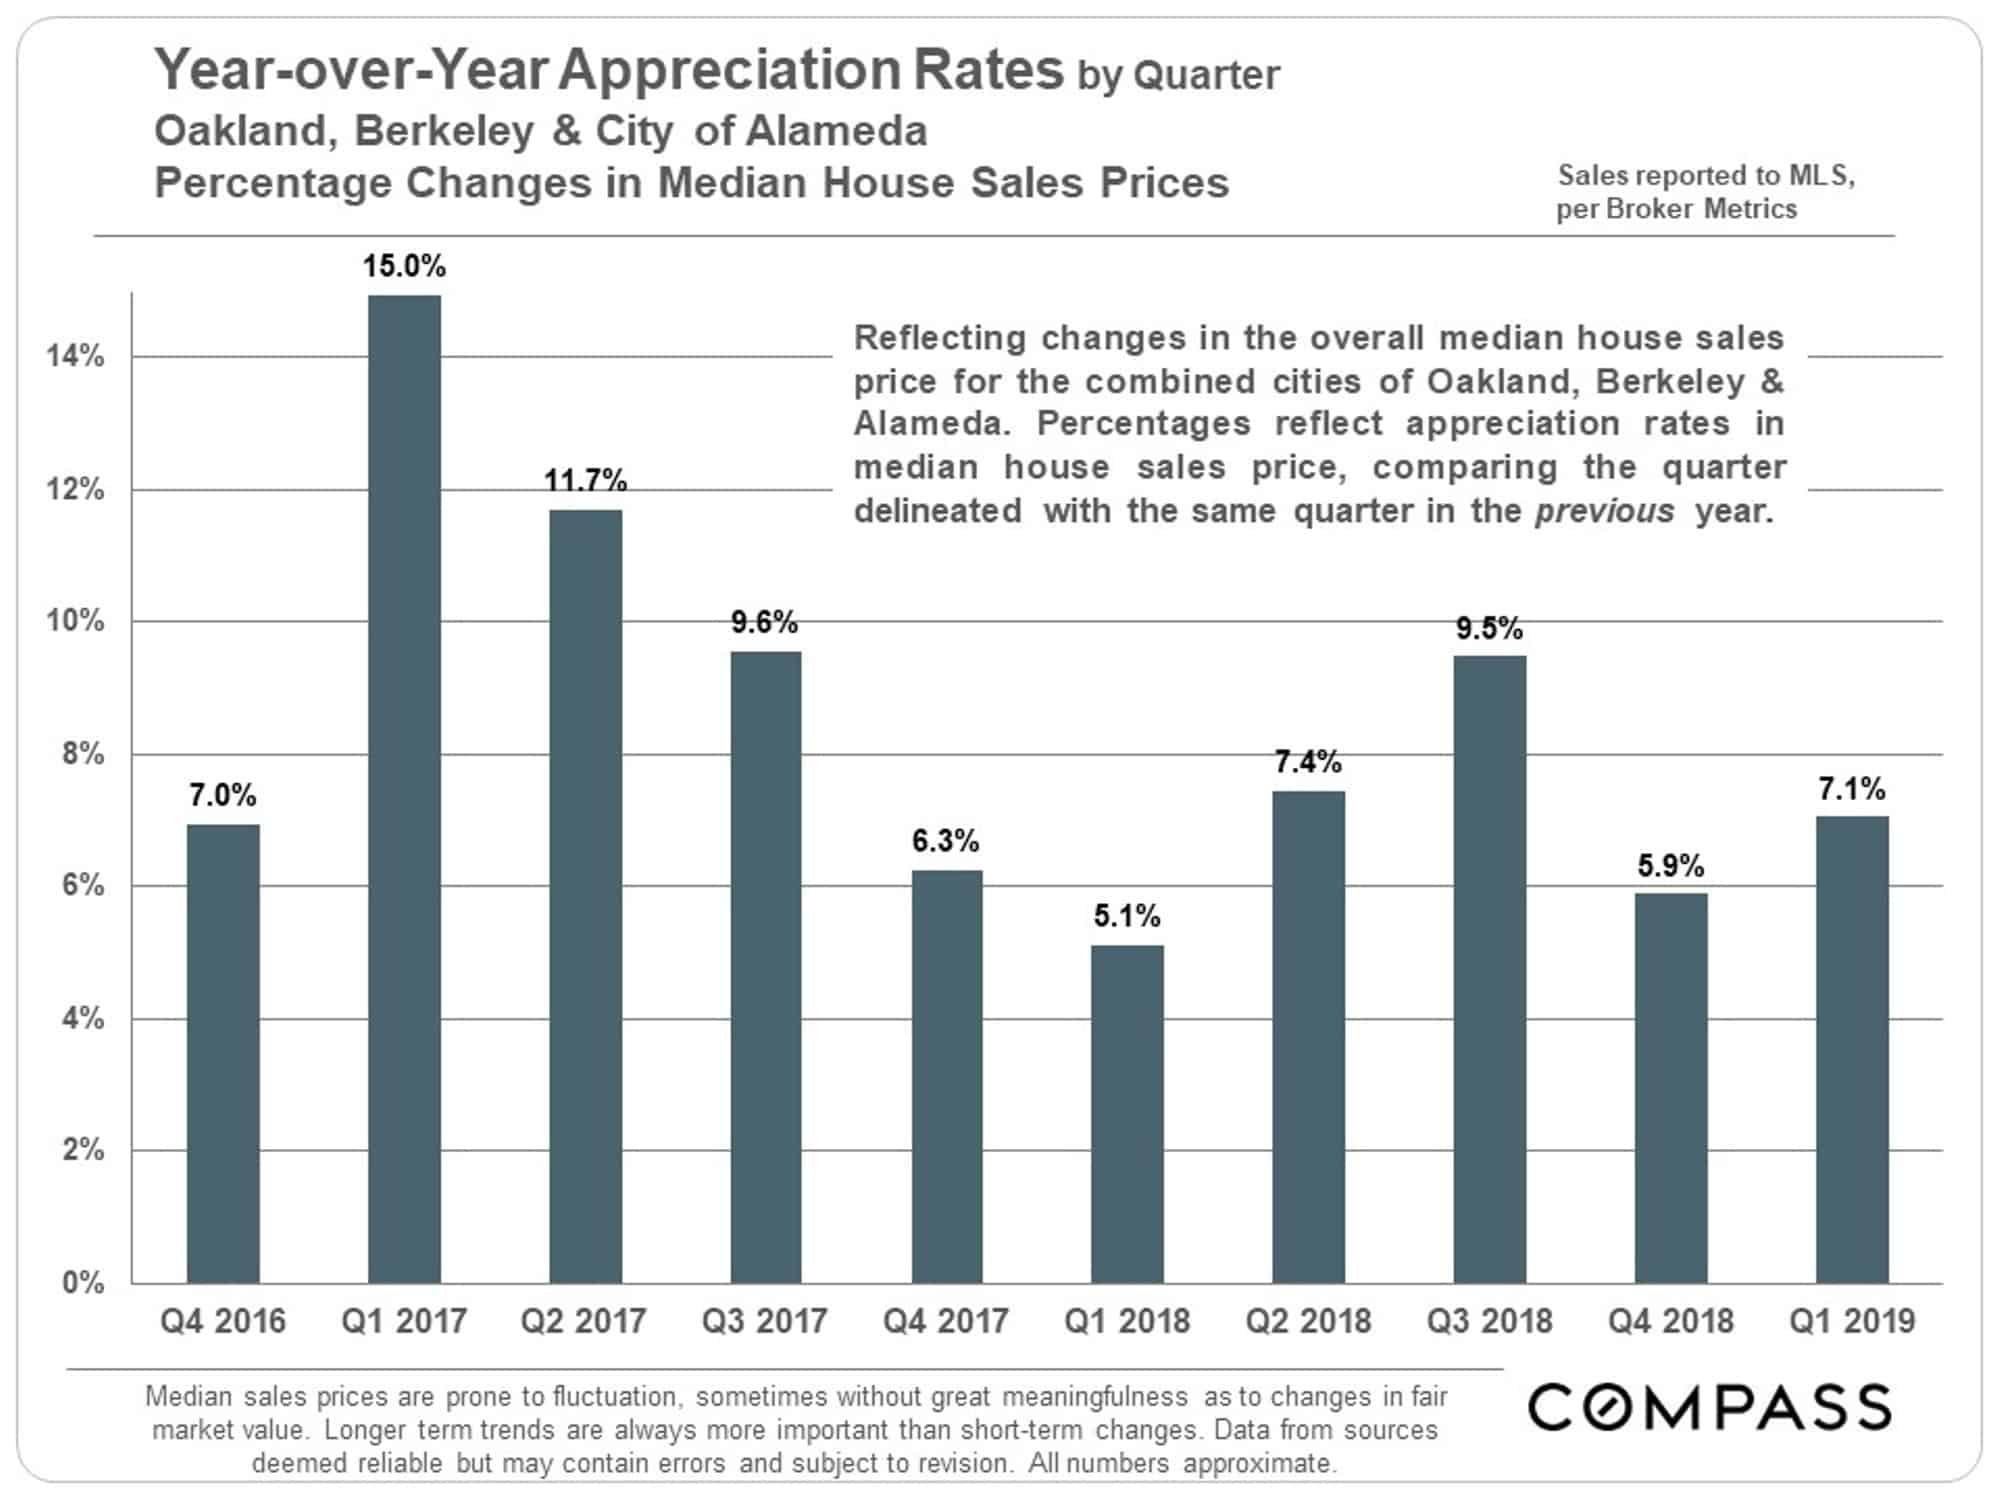
Year-over-year quarterly appreciation rates remain extremely strong. In many other Bay Area counties,y-o-y appreciation has dropped to zero, or even turned negative – i.e. their Q1 2019 median prices were below Q1 2018 prices.
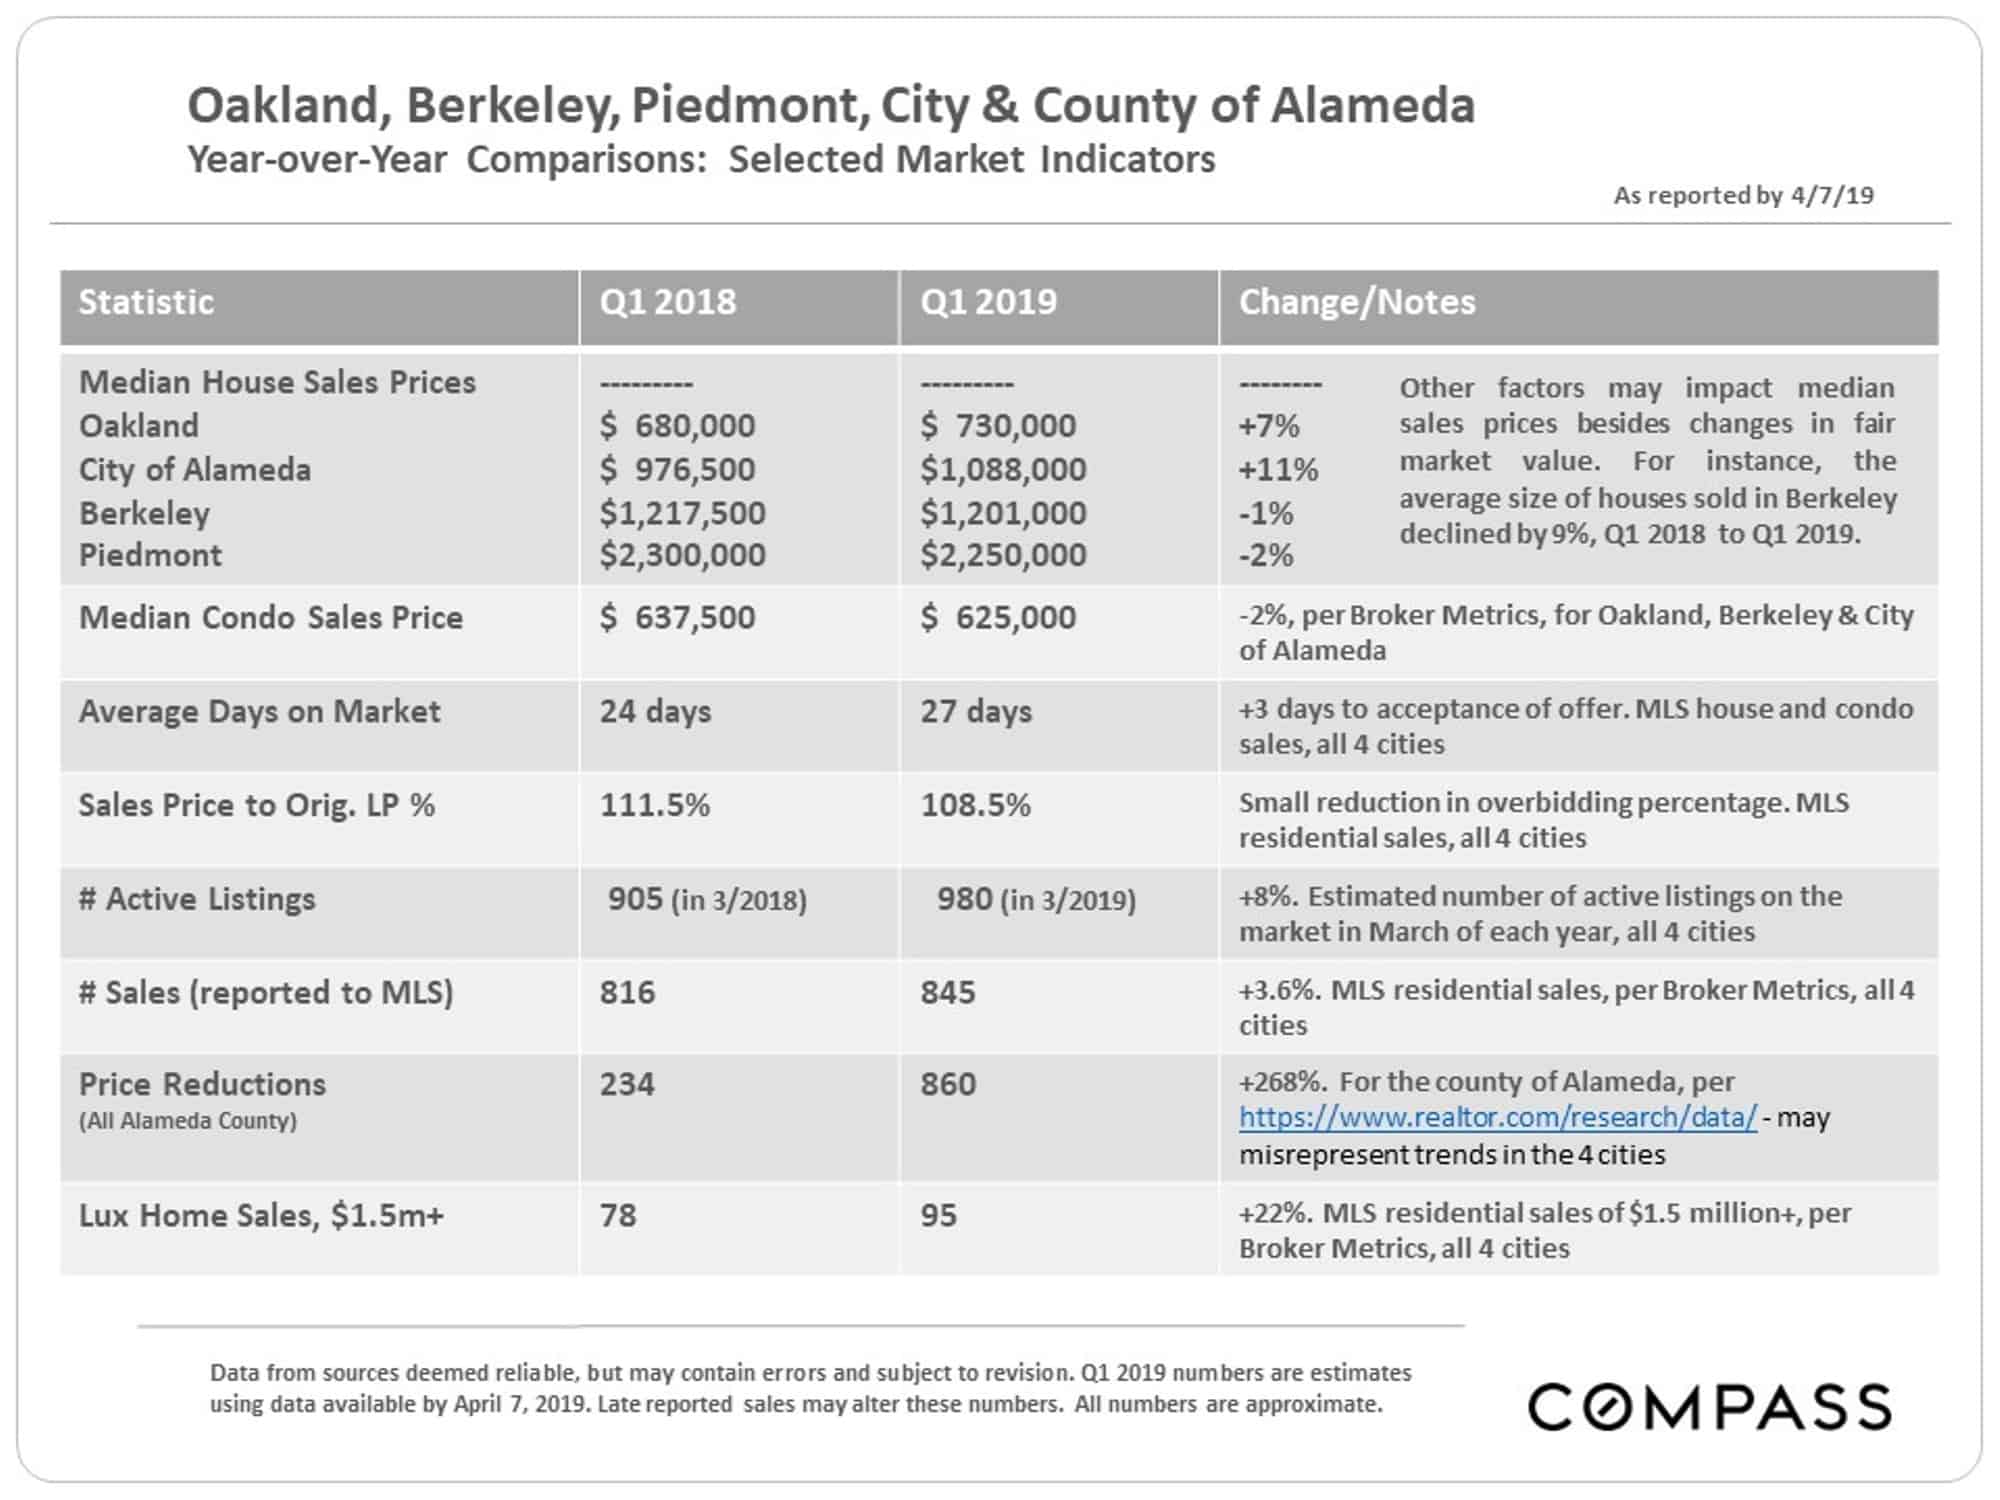
Selected Market Indicators
Overall, our market area has seen much less significant changes in standard statistics of supply and demand than other Bay Area regions. Which does not mean our market is immune to larger economic trends at play around the Bay. Q2 will give us critical data regarding the market’s direction.
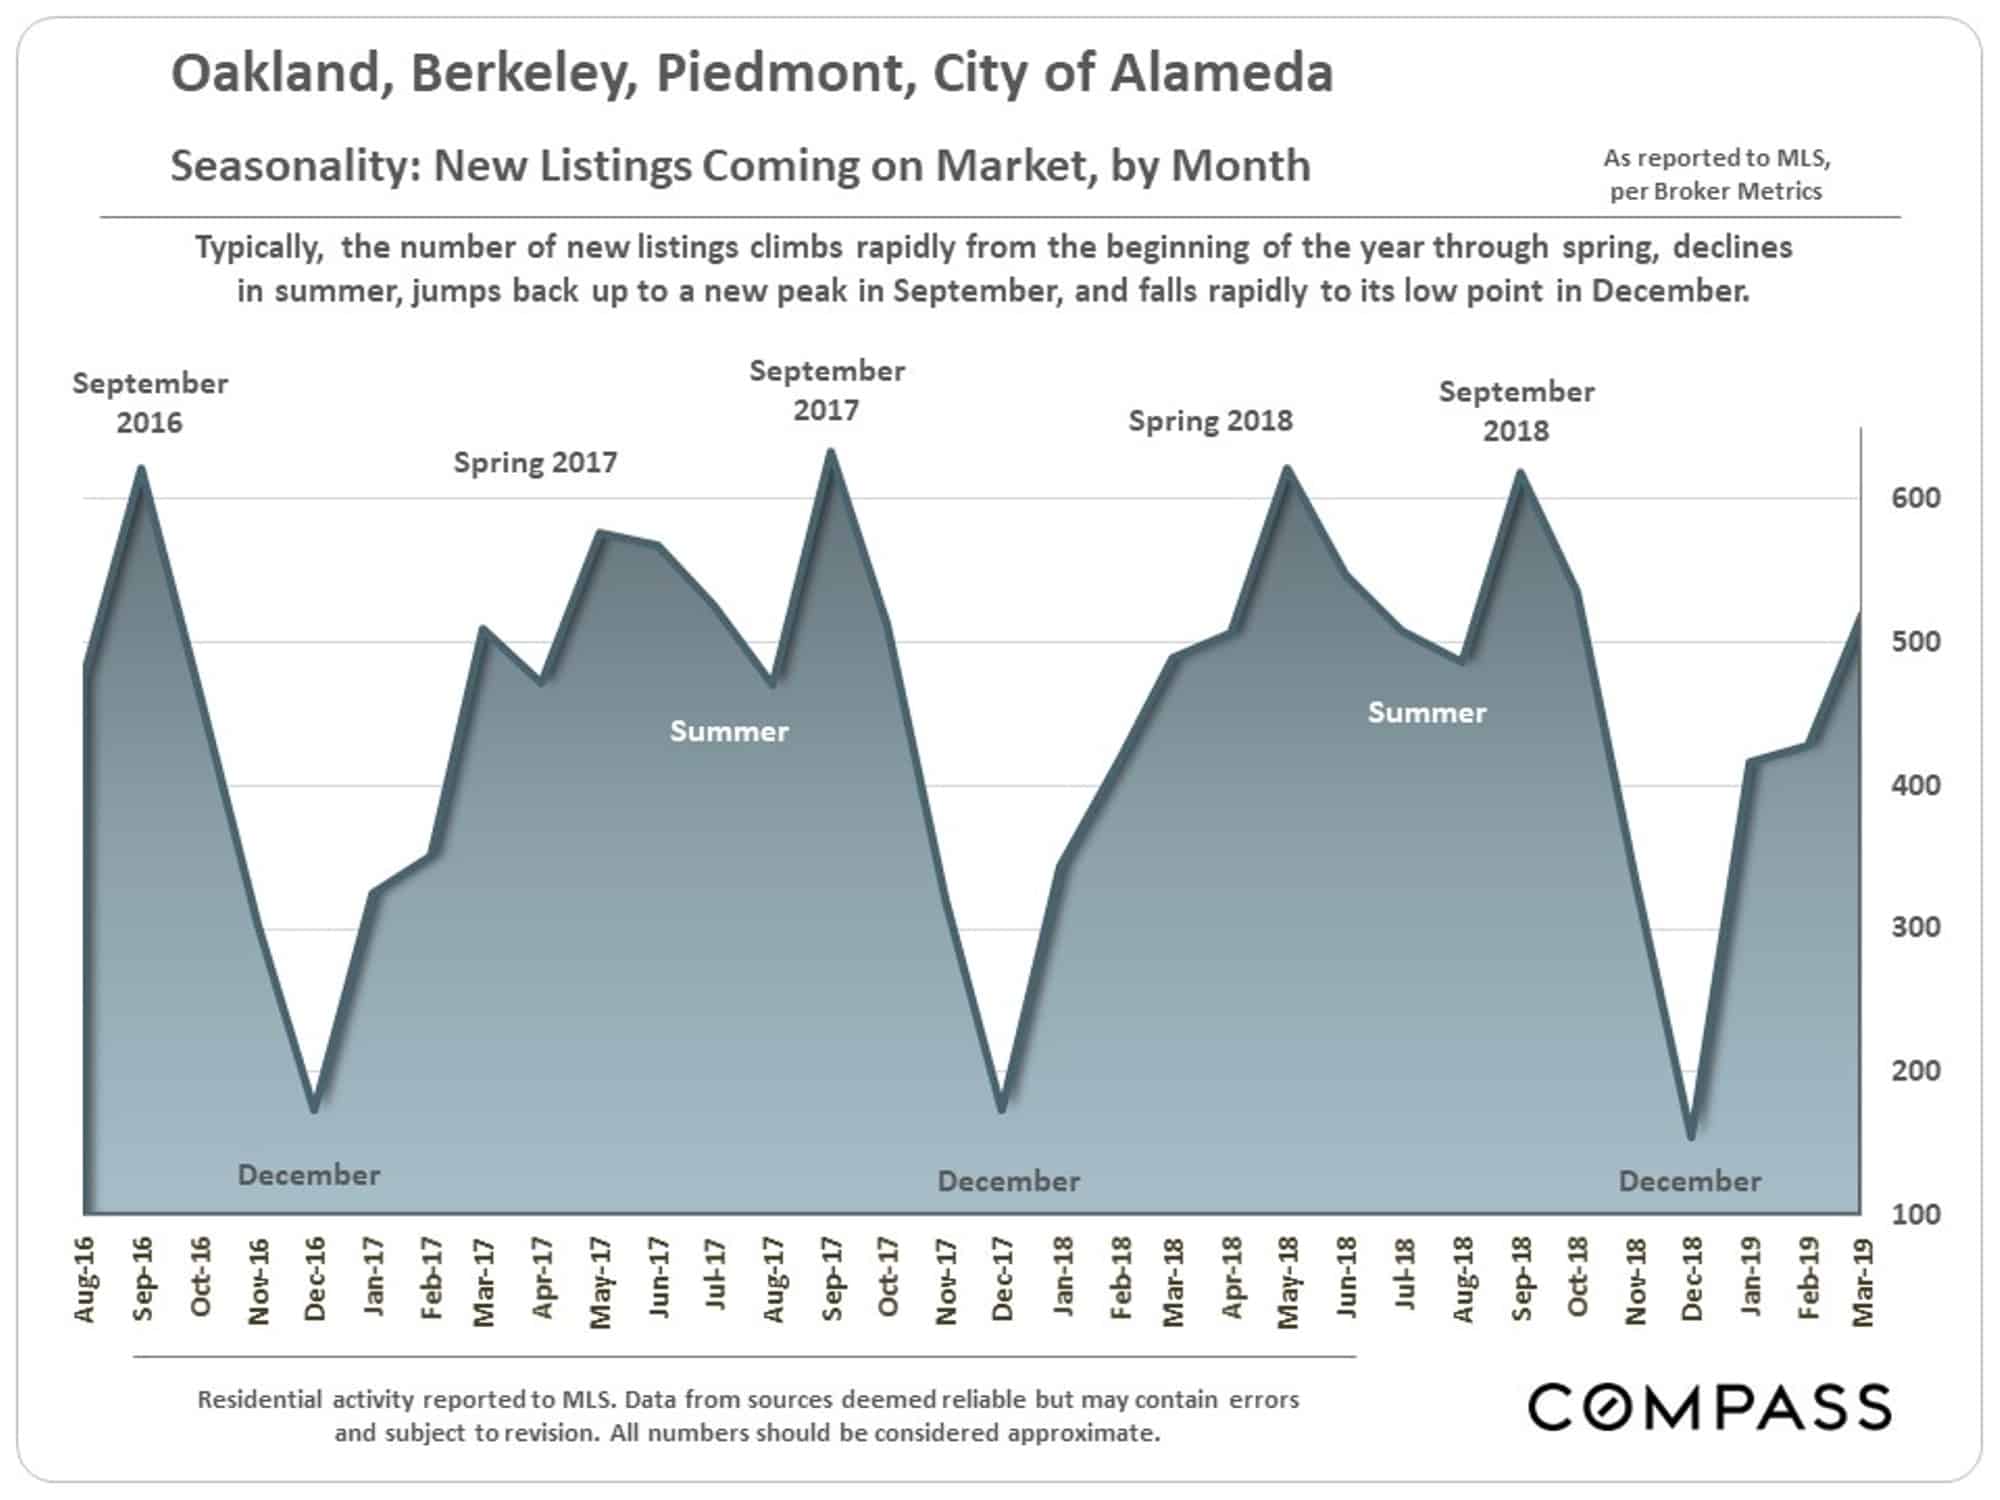
The charts below are not only indicators of historical trends, but illustrations of the considerable role seasonality plays in the market.
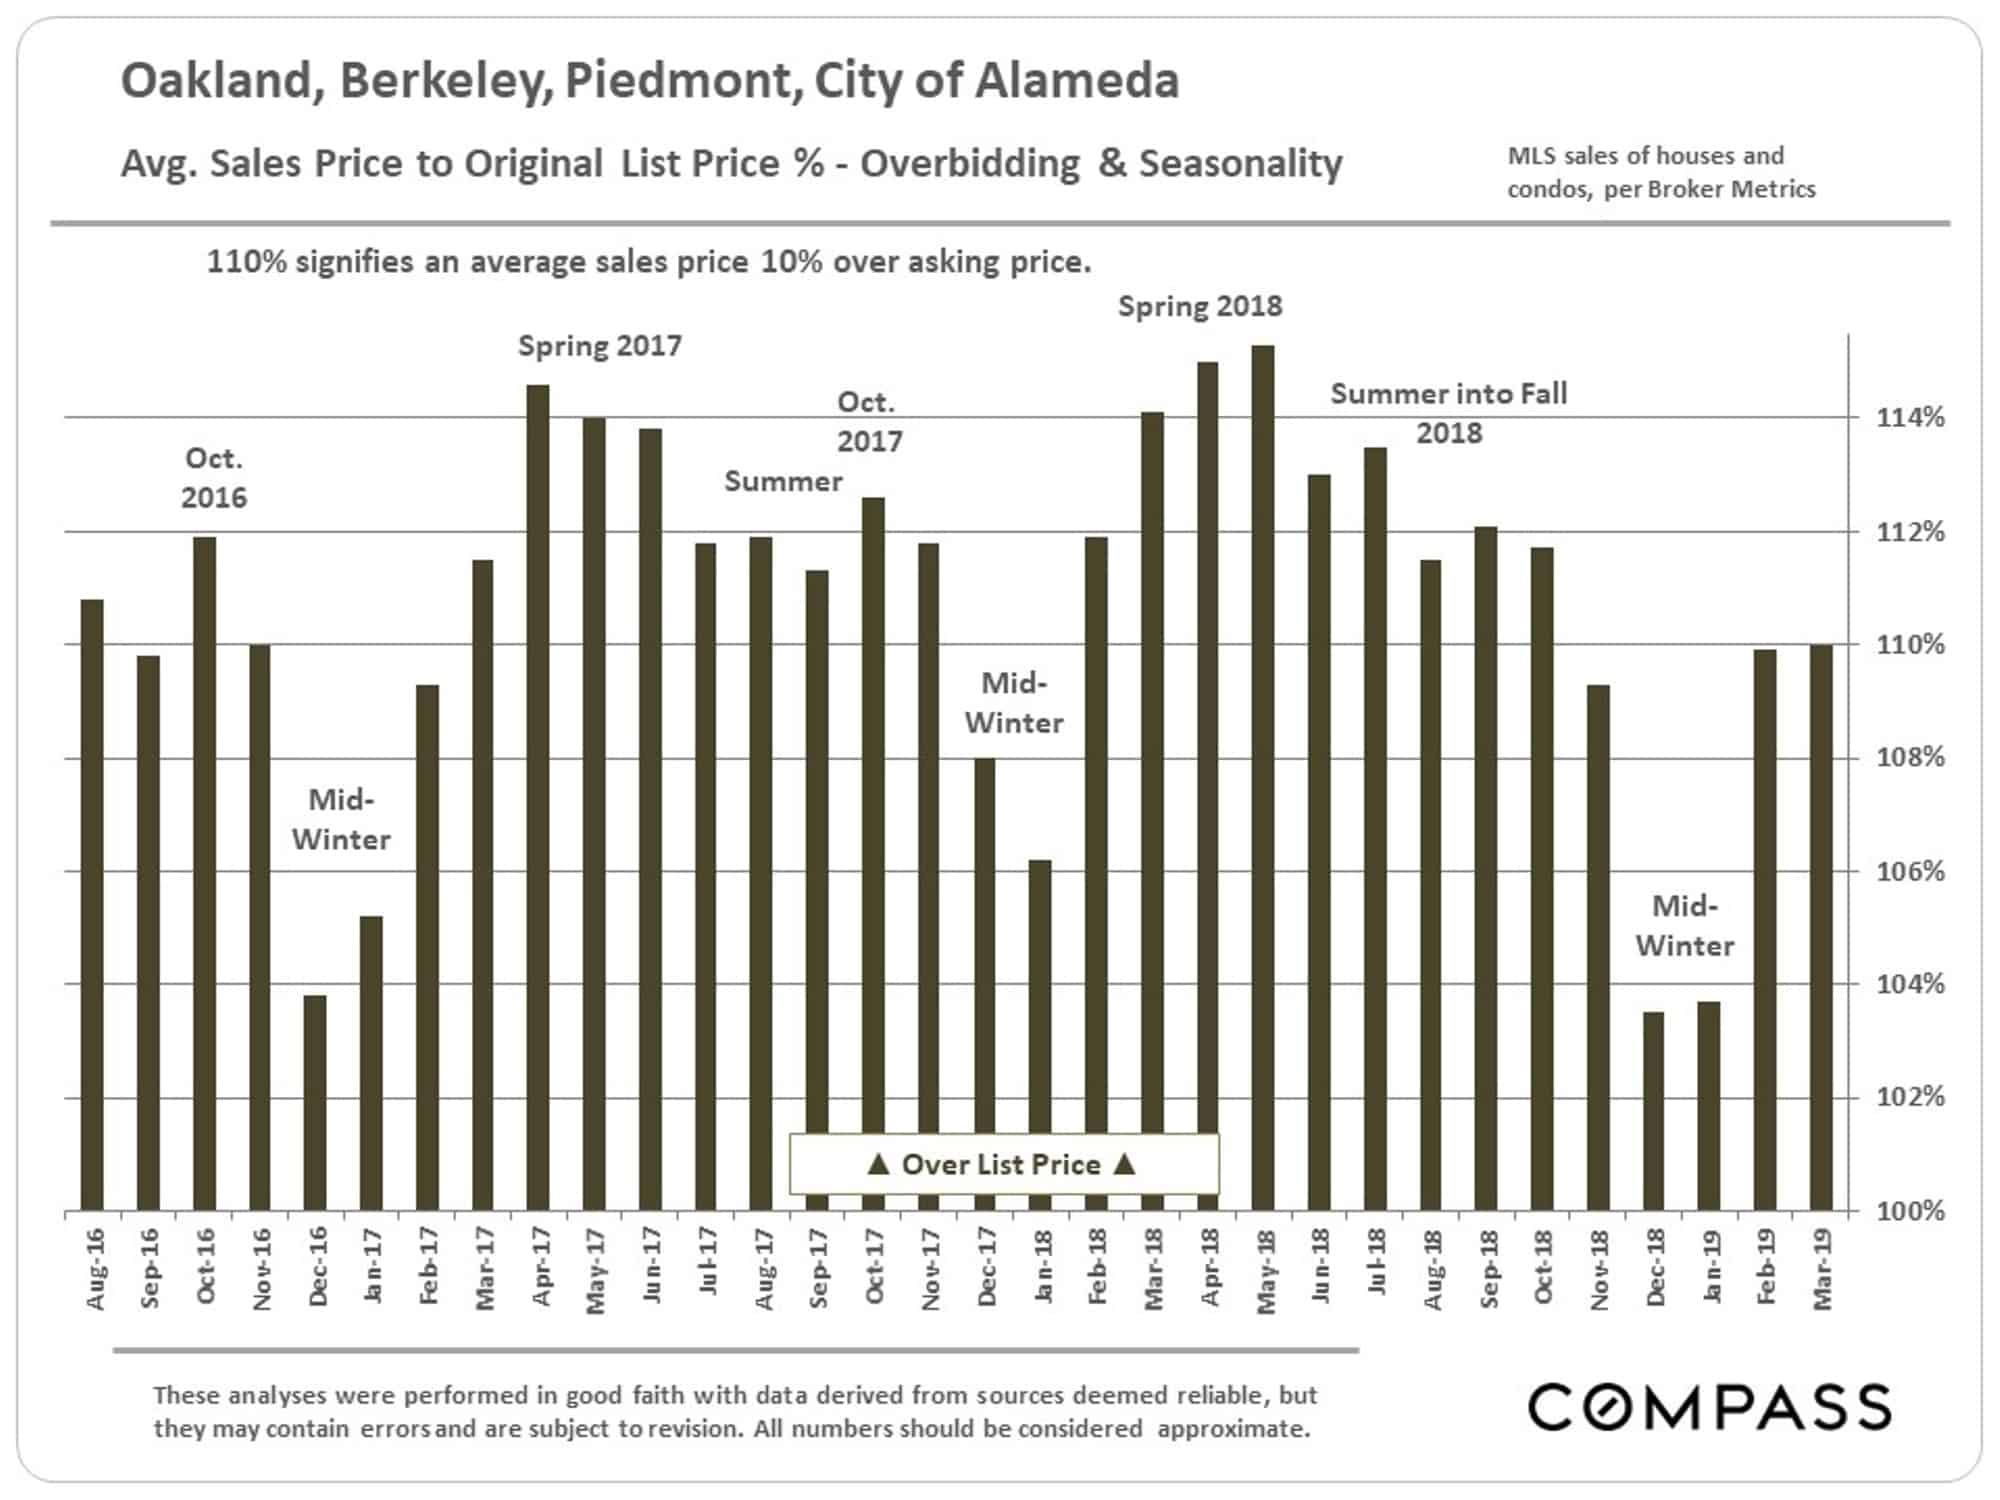
Our overbidding percentages are the highest in the Bay Area – in many other counties, sales prices are now averaging below asking prices. Sales price to list price percentages typically peak during the spring selling season when buyer demand is usually strongest.
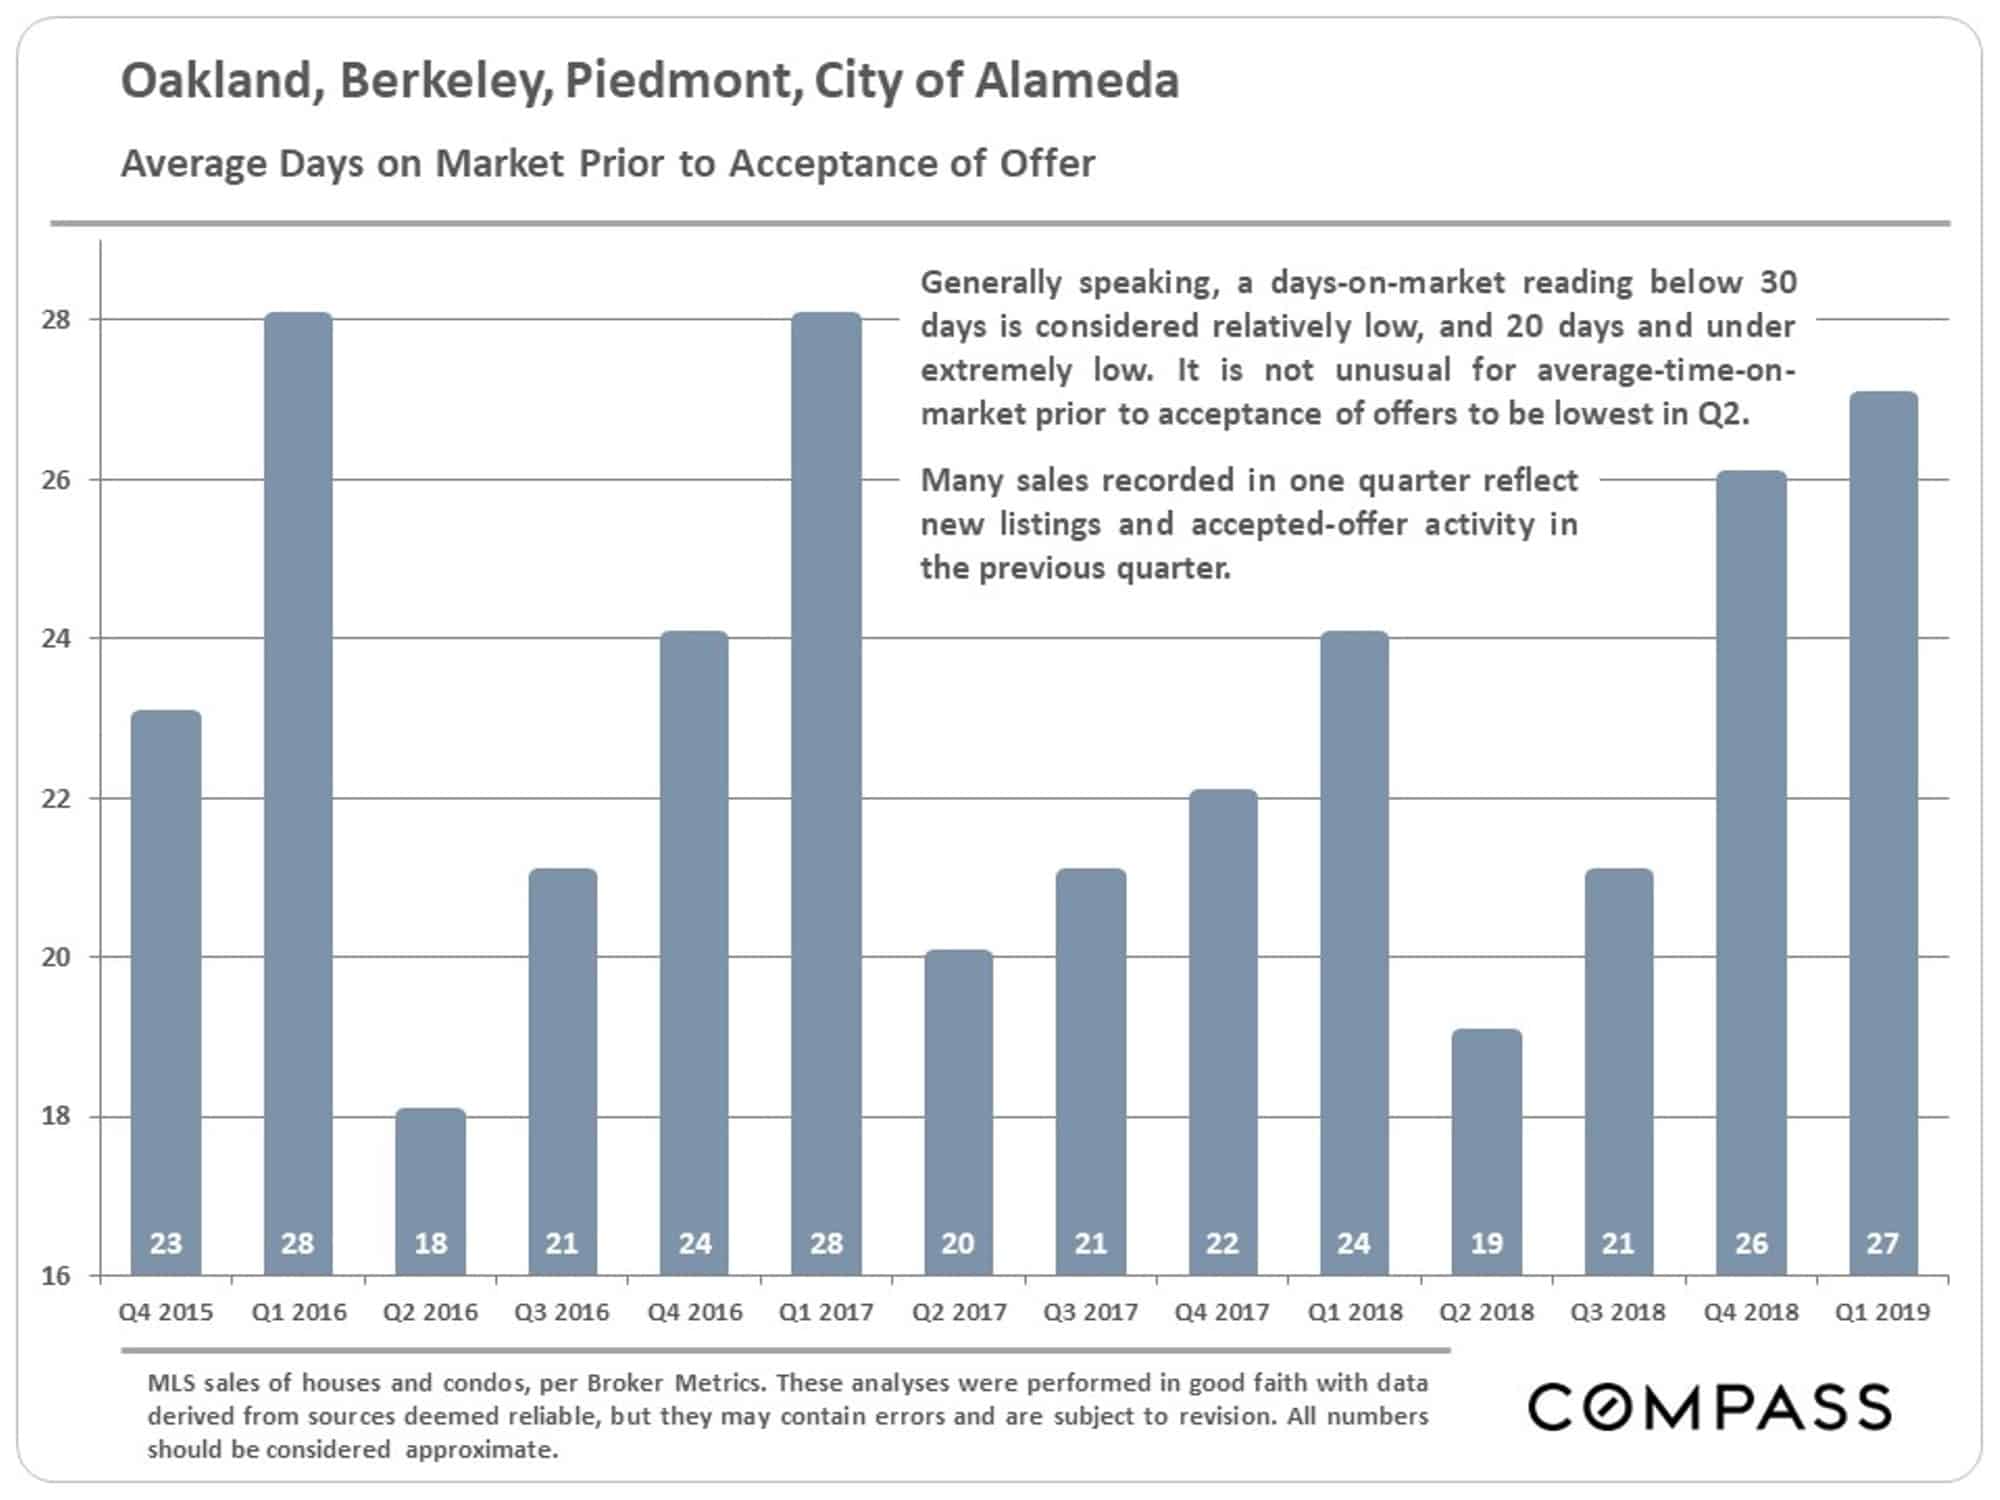
Against state and national norms, average days on market here in recent years have ranged from relatively low – during the mid-winter slowdown period – to extremely low during the spring selling season.
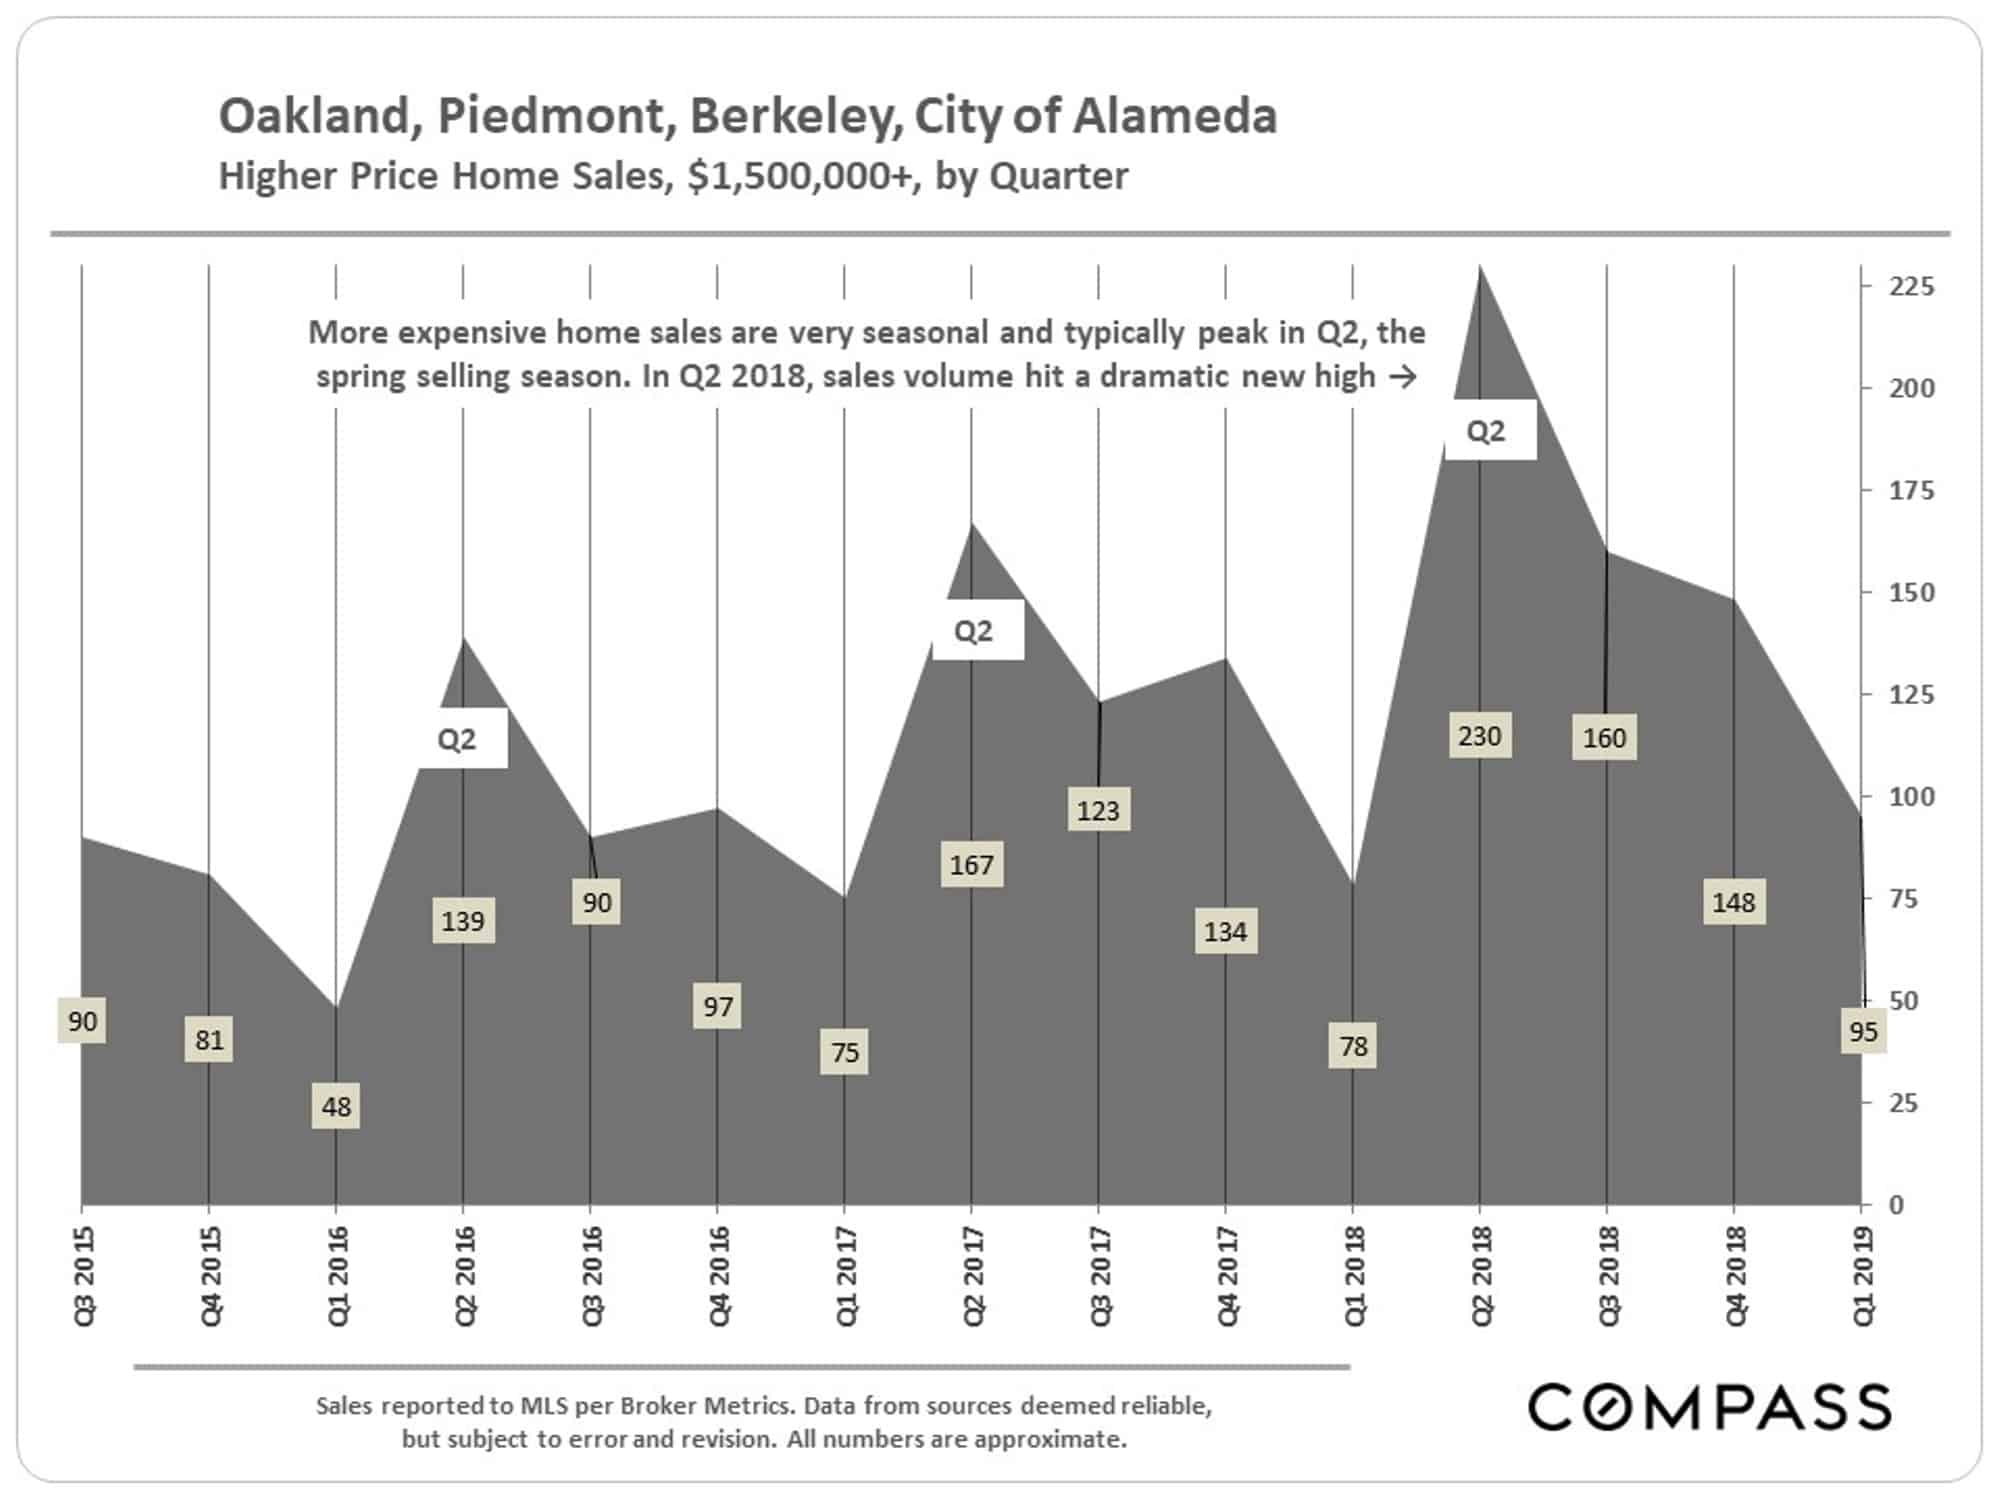
Homes Selling for $1,500,000+
Selected Economic Factors
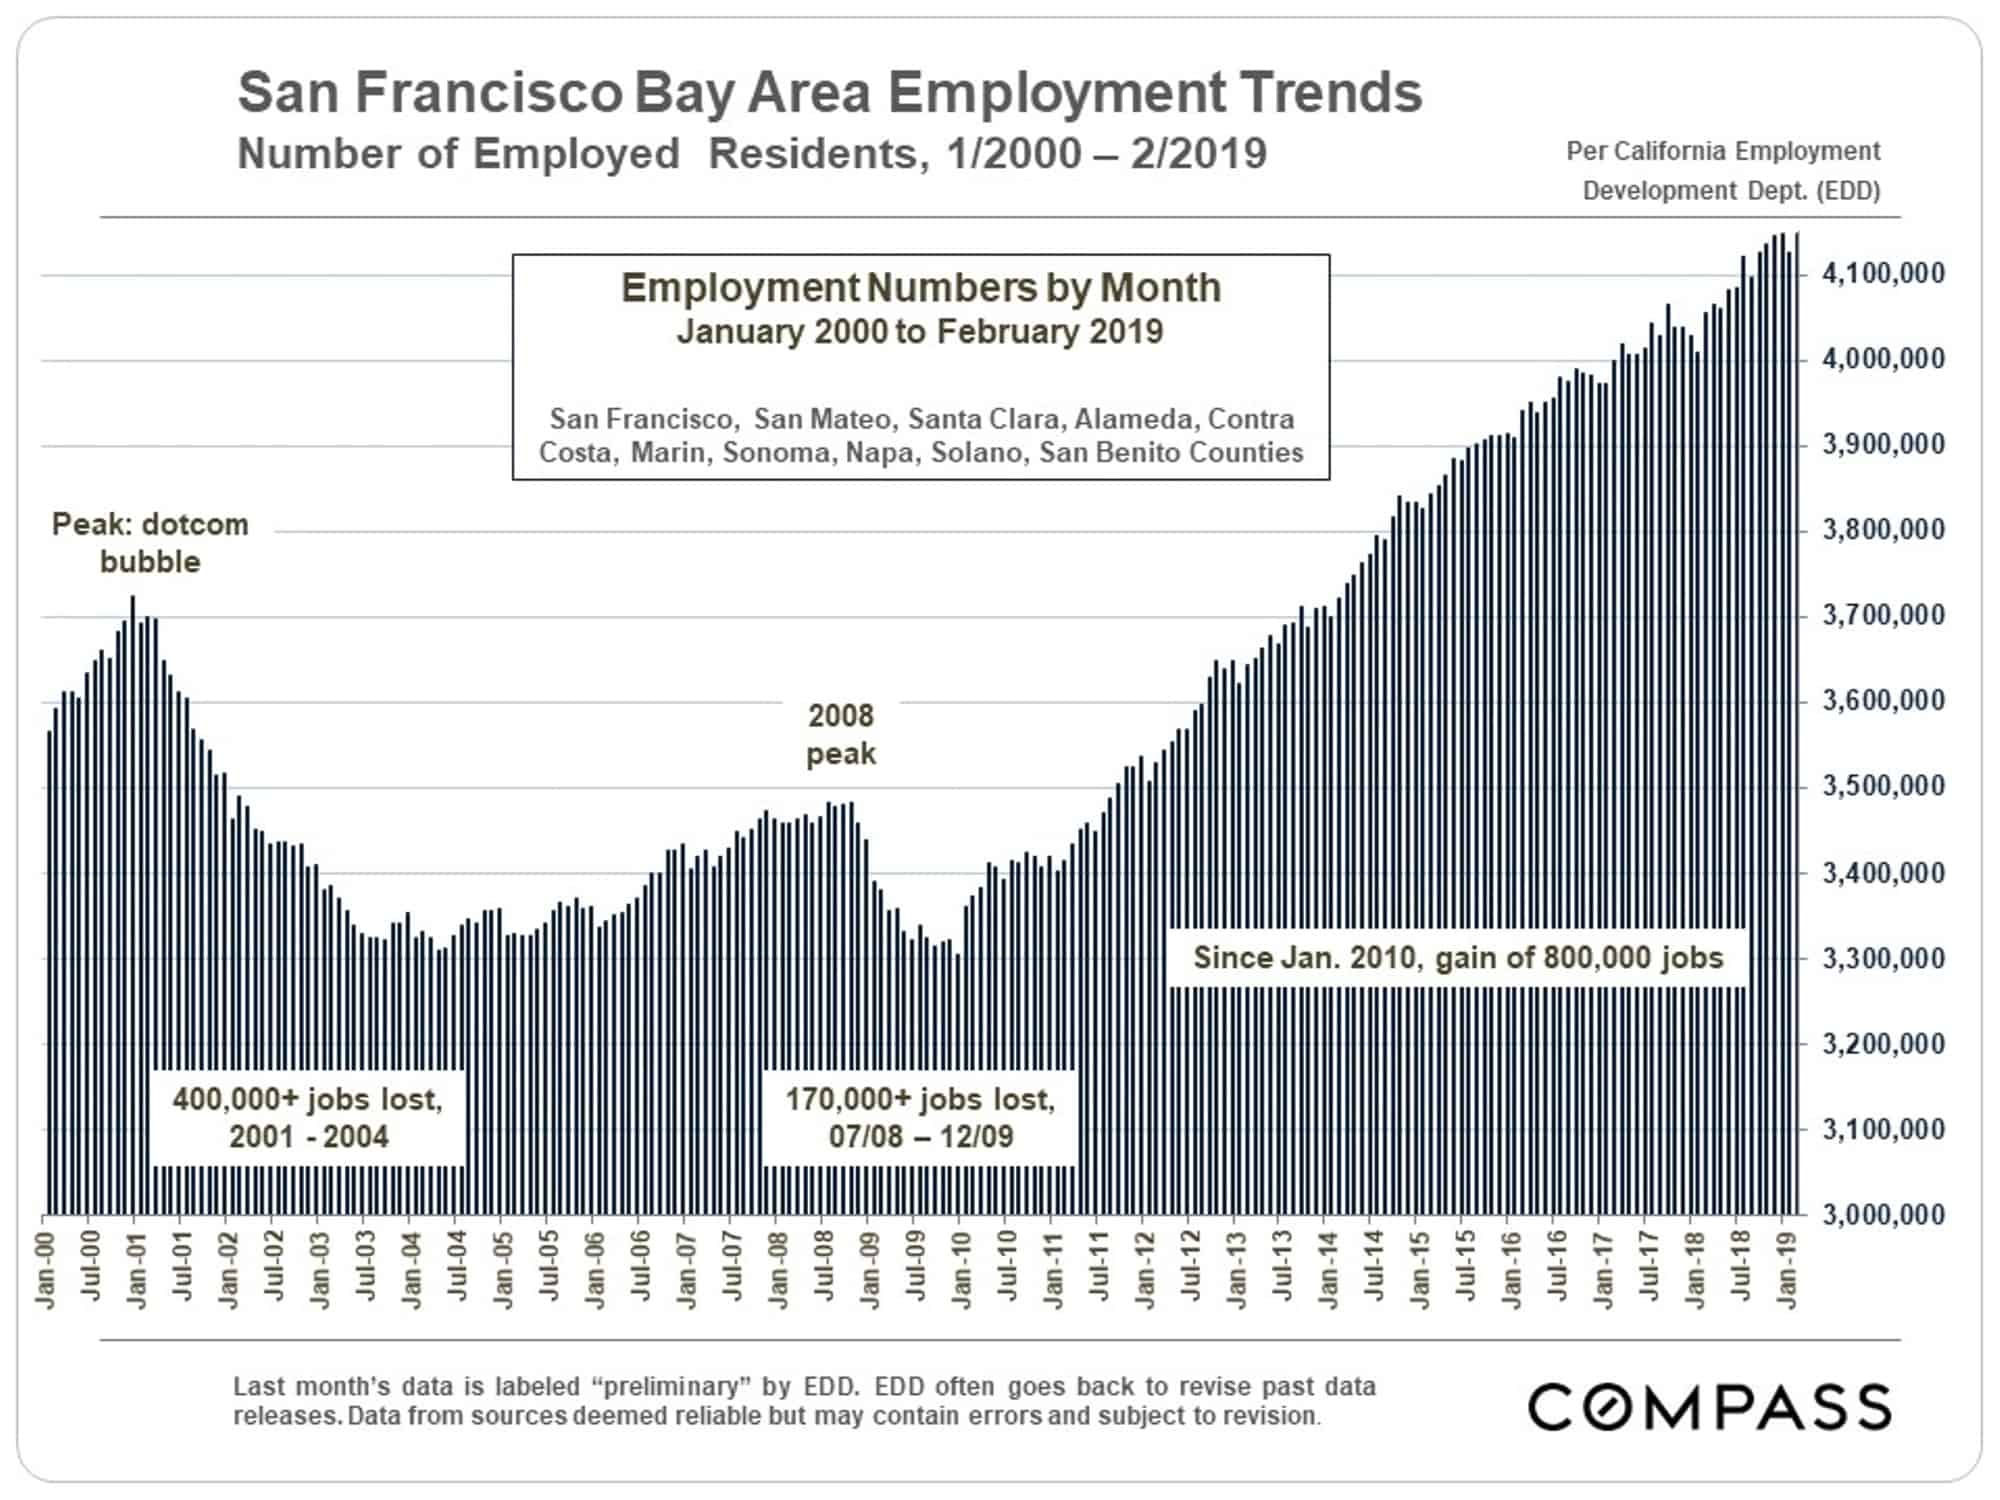
A major factor underlying Bay Area housing markets has been the staggering increase in employed residents since 2010. Outward-bound migration trends of residents and businesses – often citing housing costs as one major motivator – have been an increasing concern in recent years, but for the time being, employment numbers have continued to grow.
Financial Markets
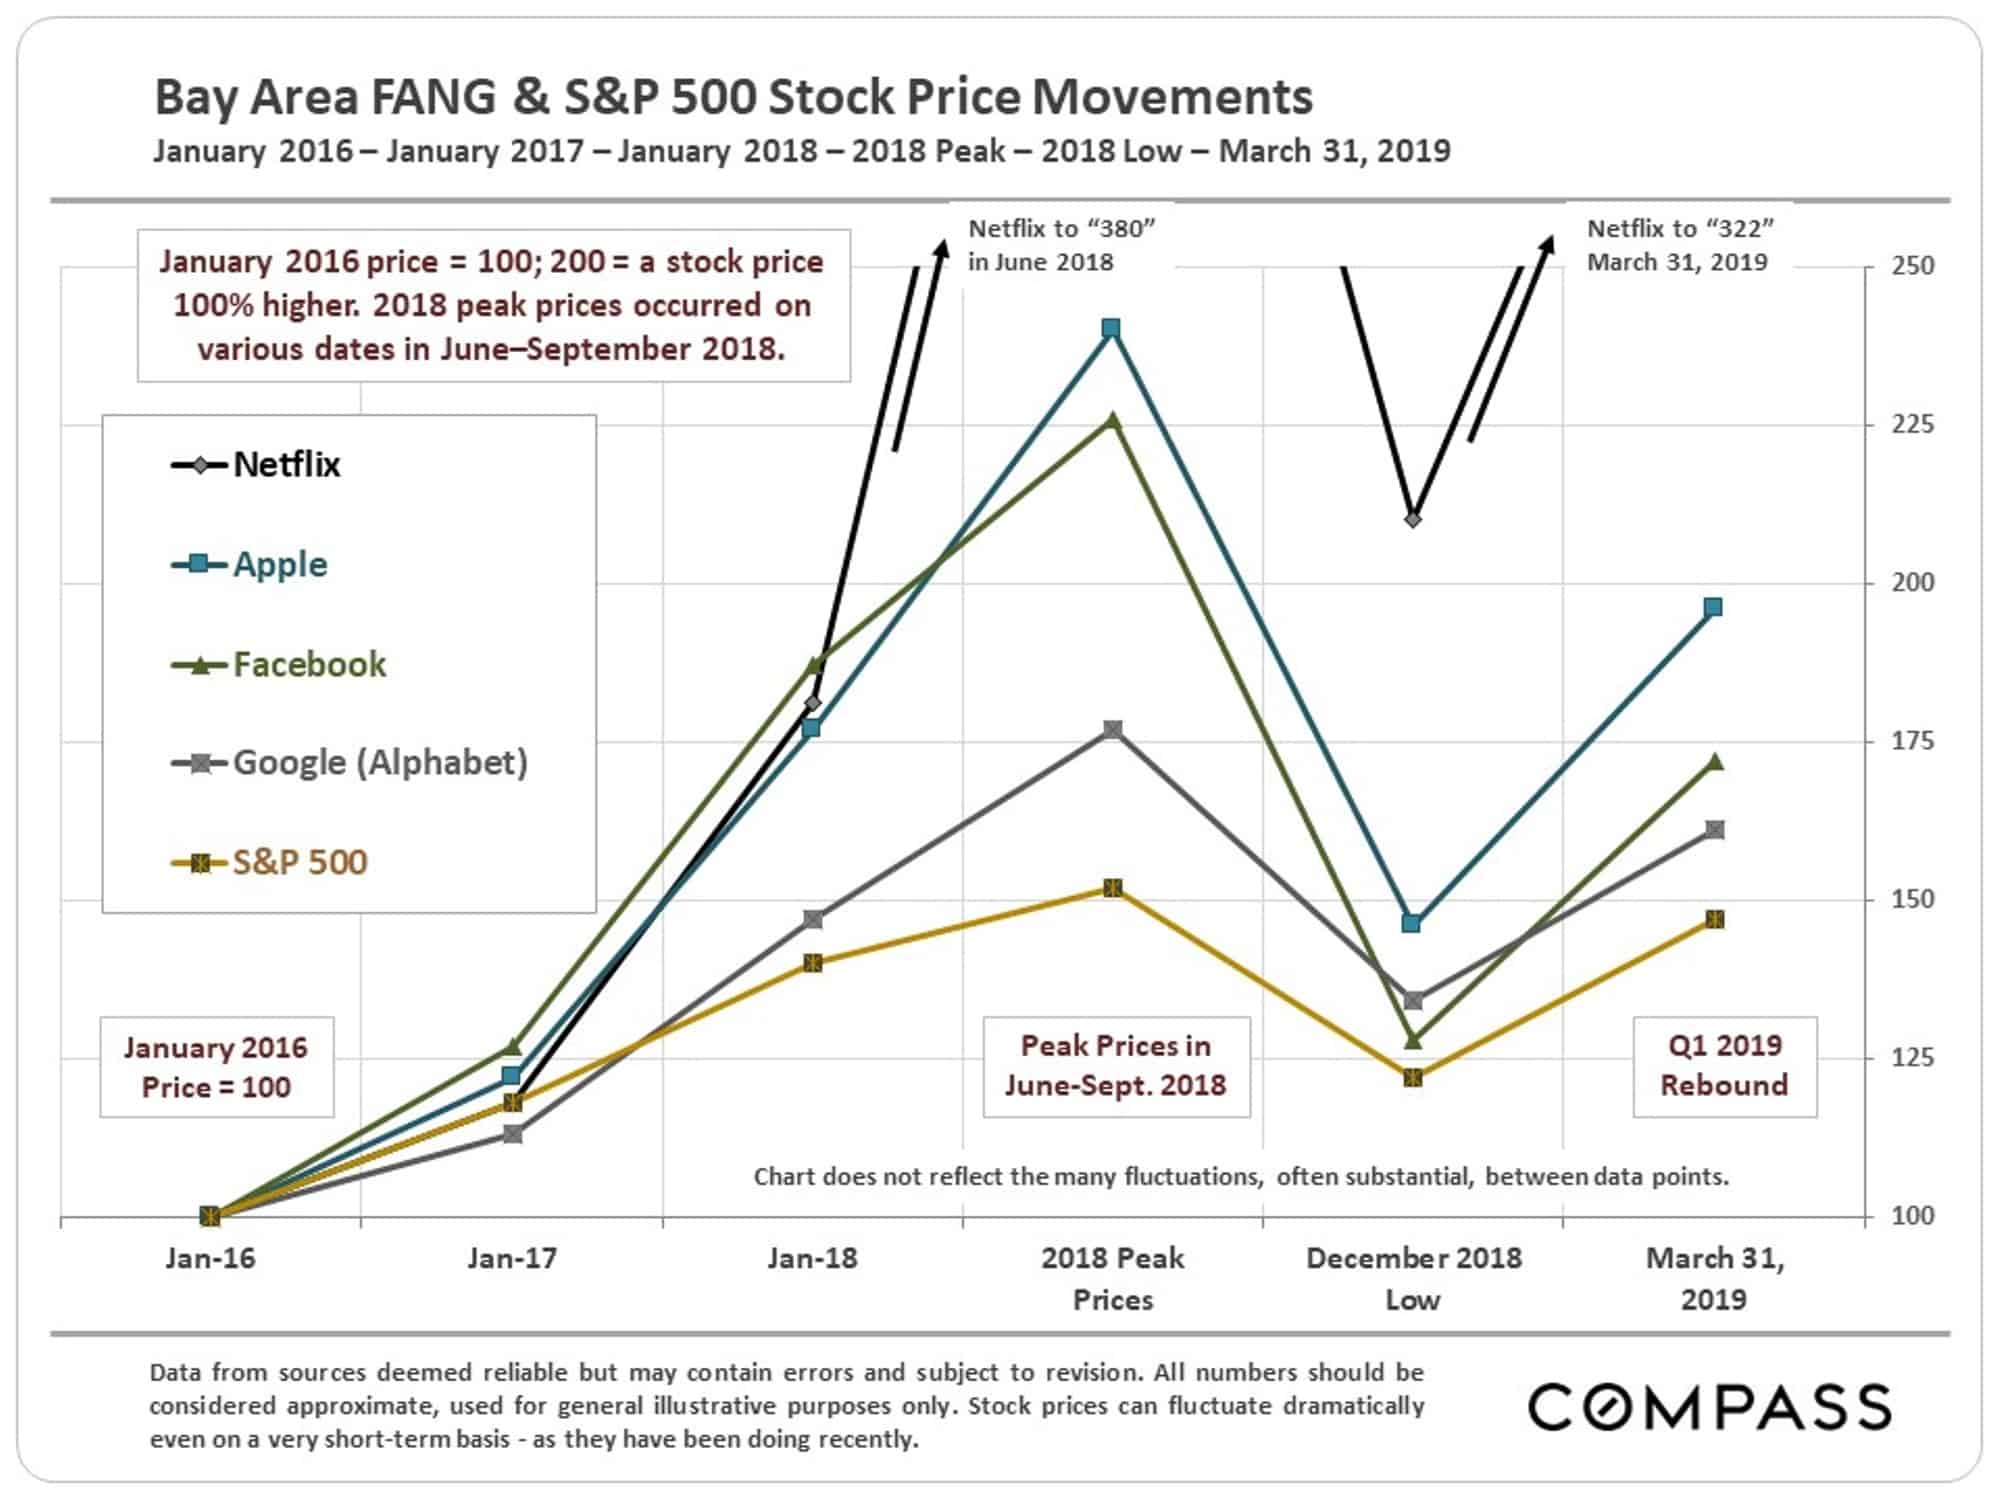
A wild ride in stock prices, particularly in high-tech: Prices soared to new peaks in summer-early autumn 2018, plunged drastically in Q4 2018, and then saw the biggest Q1 jump in 20 years. Huge amounts of wealth appearing, disappearing and reappearing – another major influence on consumer confidence and home-buyer demand.
A new surge of large, high-tech unicorn IPOs – mostly of firms headquartered in SF – has just started to roll out. IPOs have historically created vast quantities of new wealth in the Bay Area, though the magnitude of effect of this new wave on specific local housing markets is yet unknown. However, if there is a large impact in SF, there will probably also be a substantial effect in our markets.
New Construction
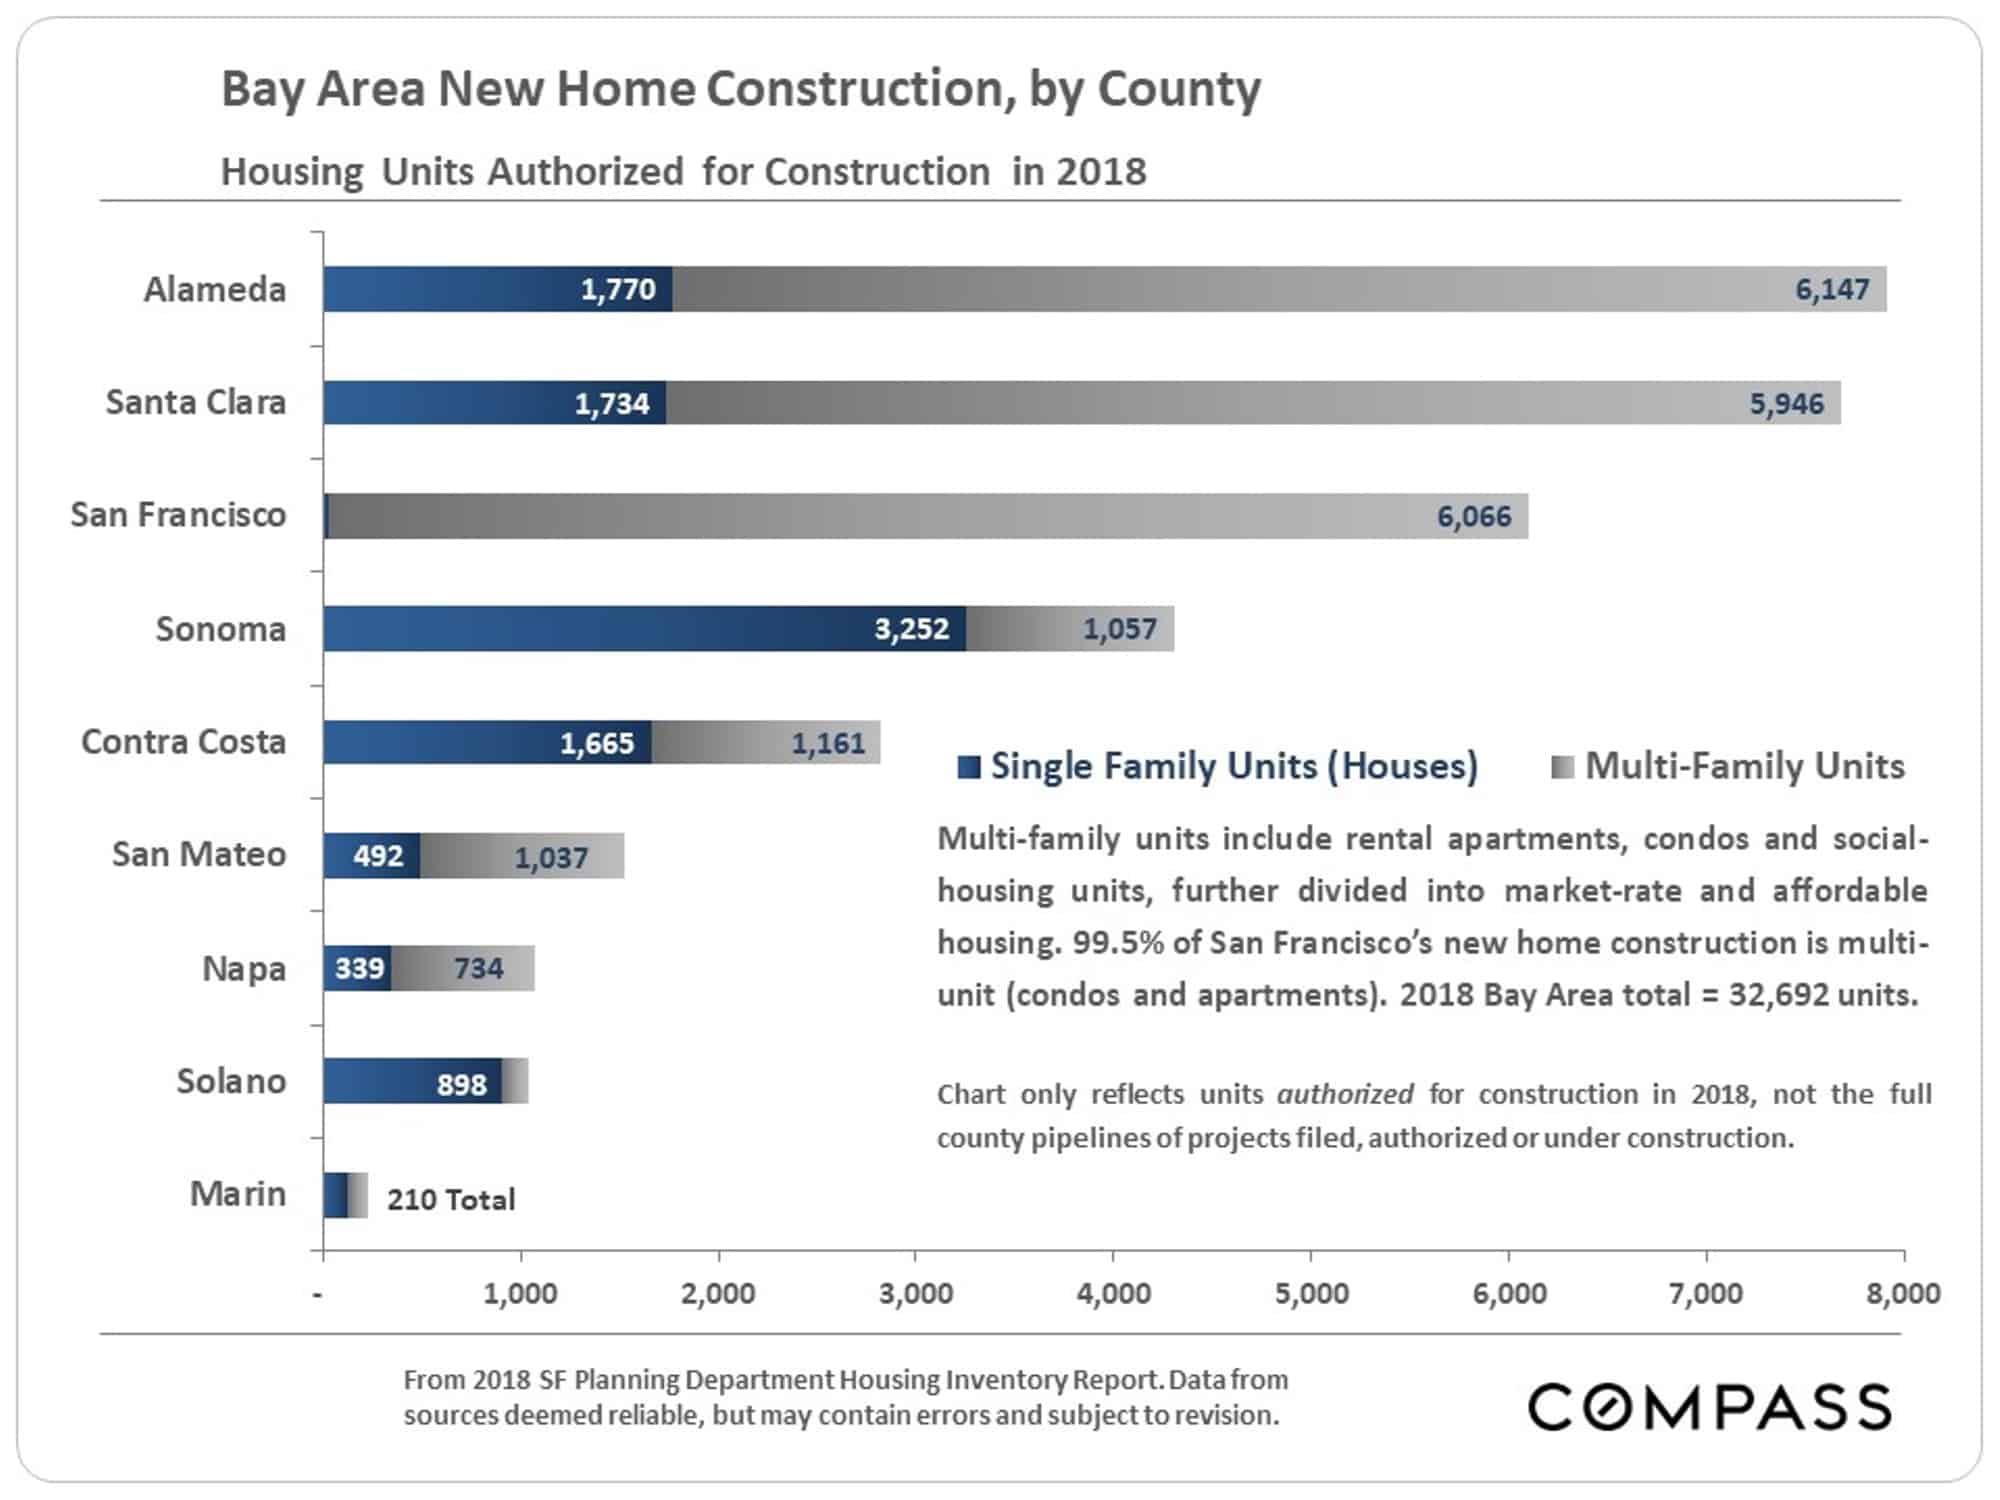
Alameda County took the lead in 2018 for Bay Area homes authorized for construction – most of which are in multi-family projects (apartments and condos). Oakland, in particular, is in the midst of a construction boom. As larger quantities of new housing units are built – there can be a substantial lag between authorization and completion – it affects the supply and demand dynamic in the market.
Interest Rates
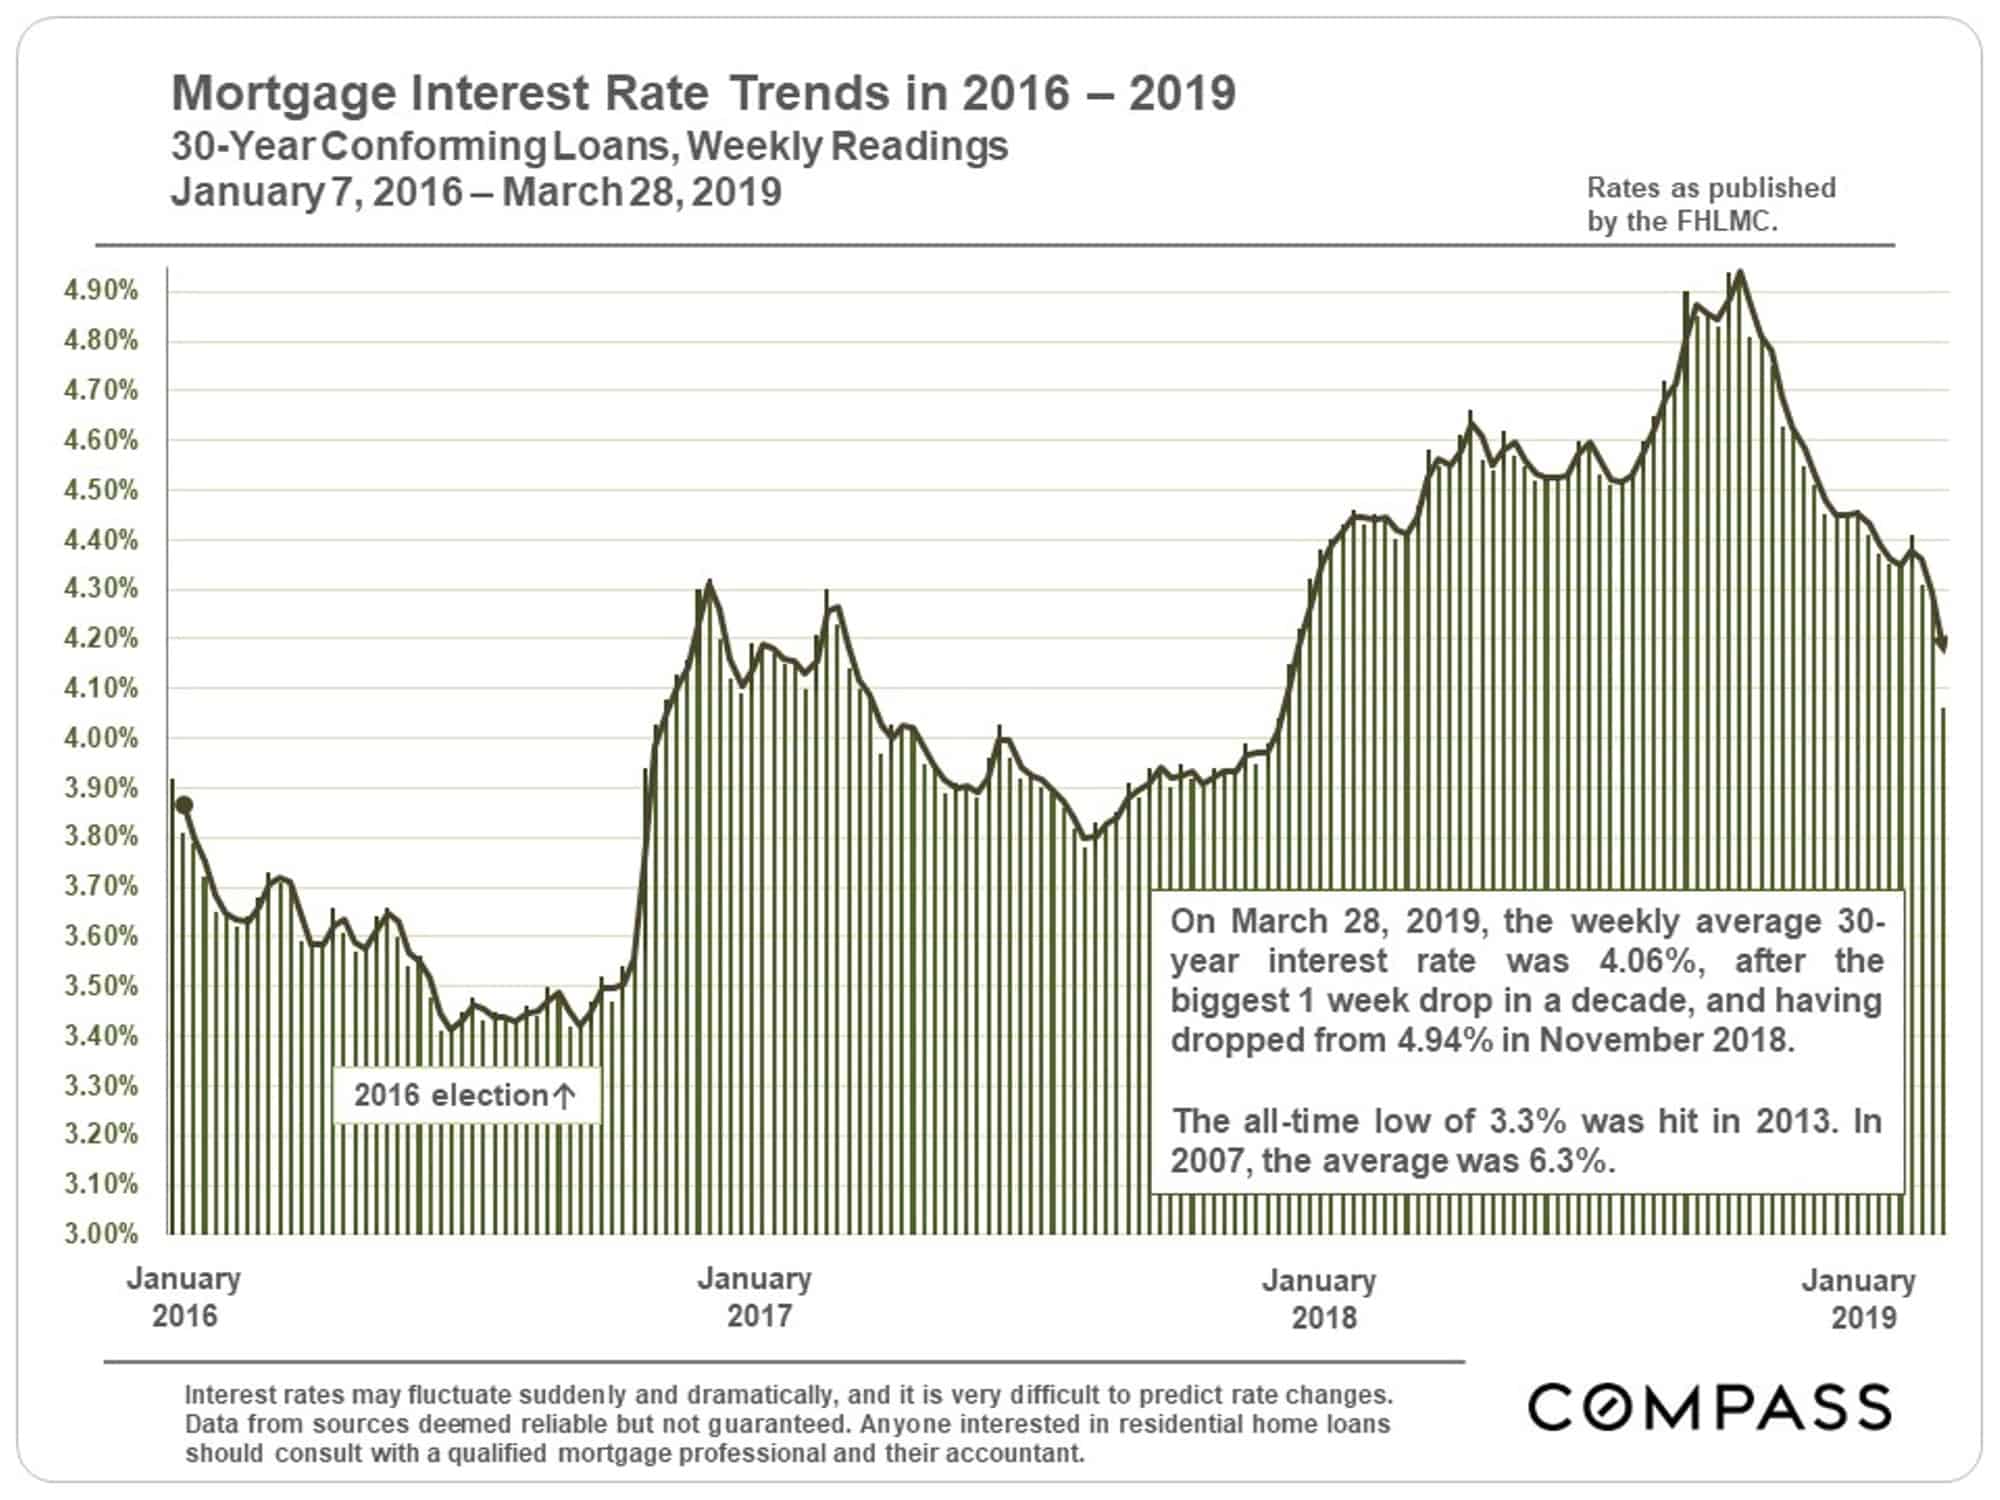
There has been a stunning decline in mortgage interest rates from mid-November 2018 through the end of March, from 4.94% to 4.06% – to the enormous advantage to buyers. Big drops such as this have helped to recharge buyer demand in the past.
Housing Affordability & Household Incomes
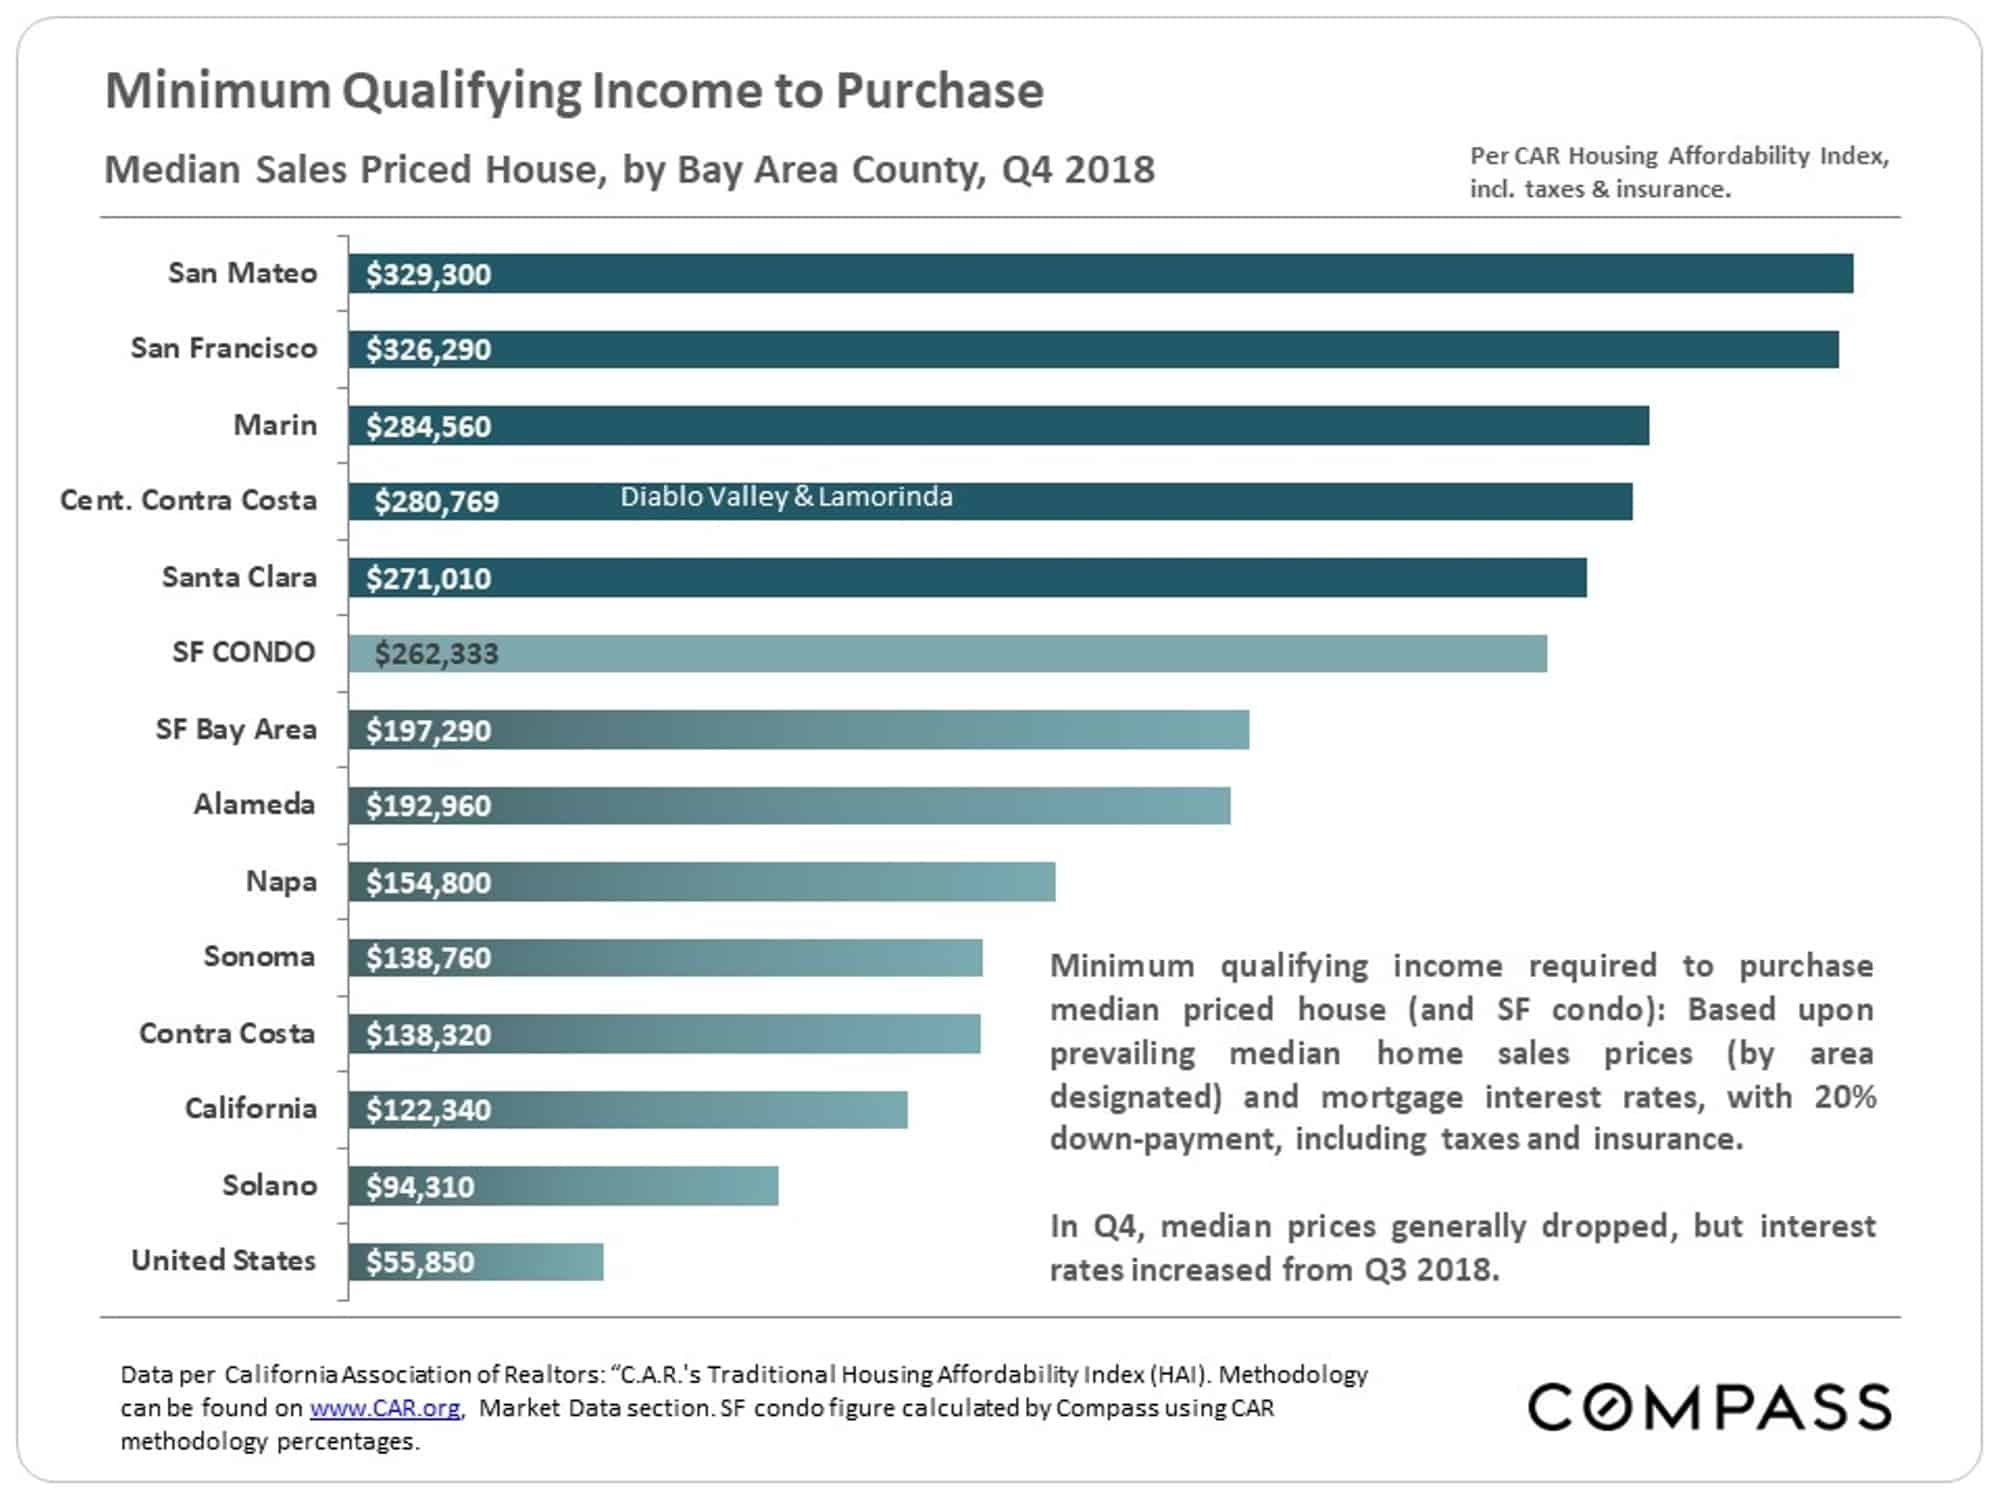
This chart calculates the income required to buy a median-price house in Q4 2018. Median condo prices are substantially less in every county and would require lower incomes. One of the critical factors in our real estate market is its relative affordability compared to nearby SF, San Mateo and Santa Clara Counties.
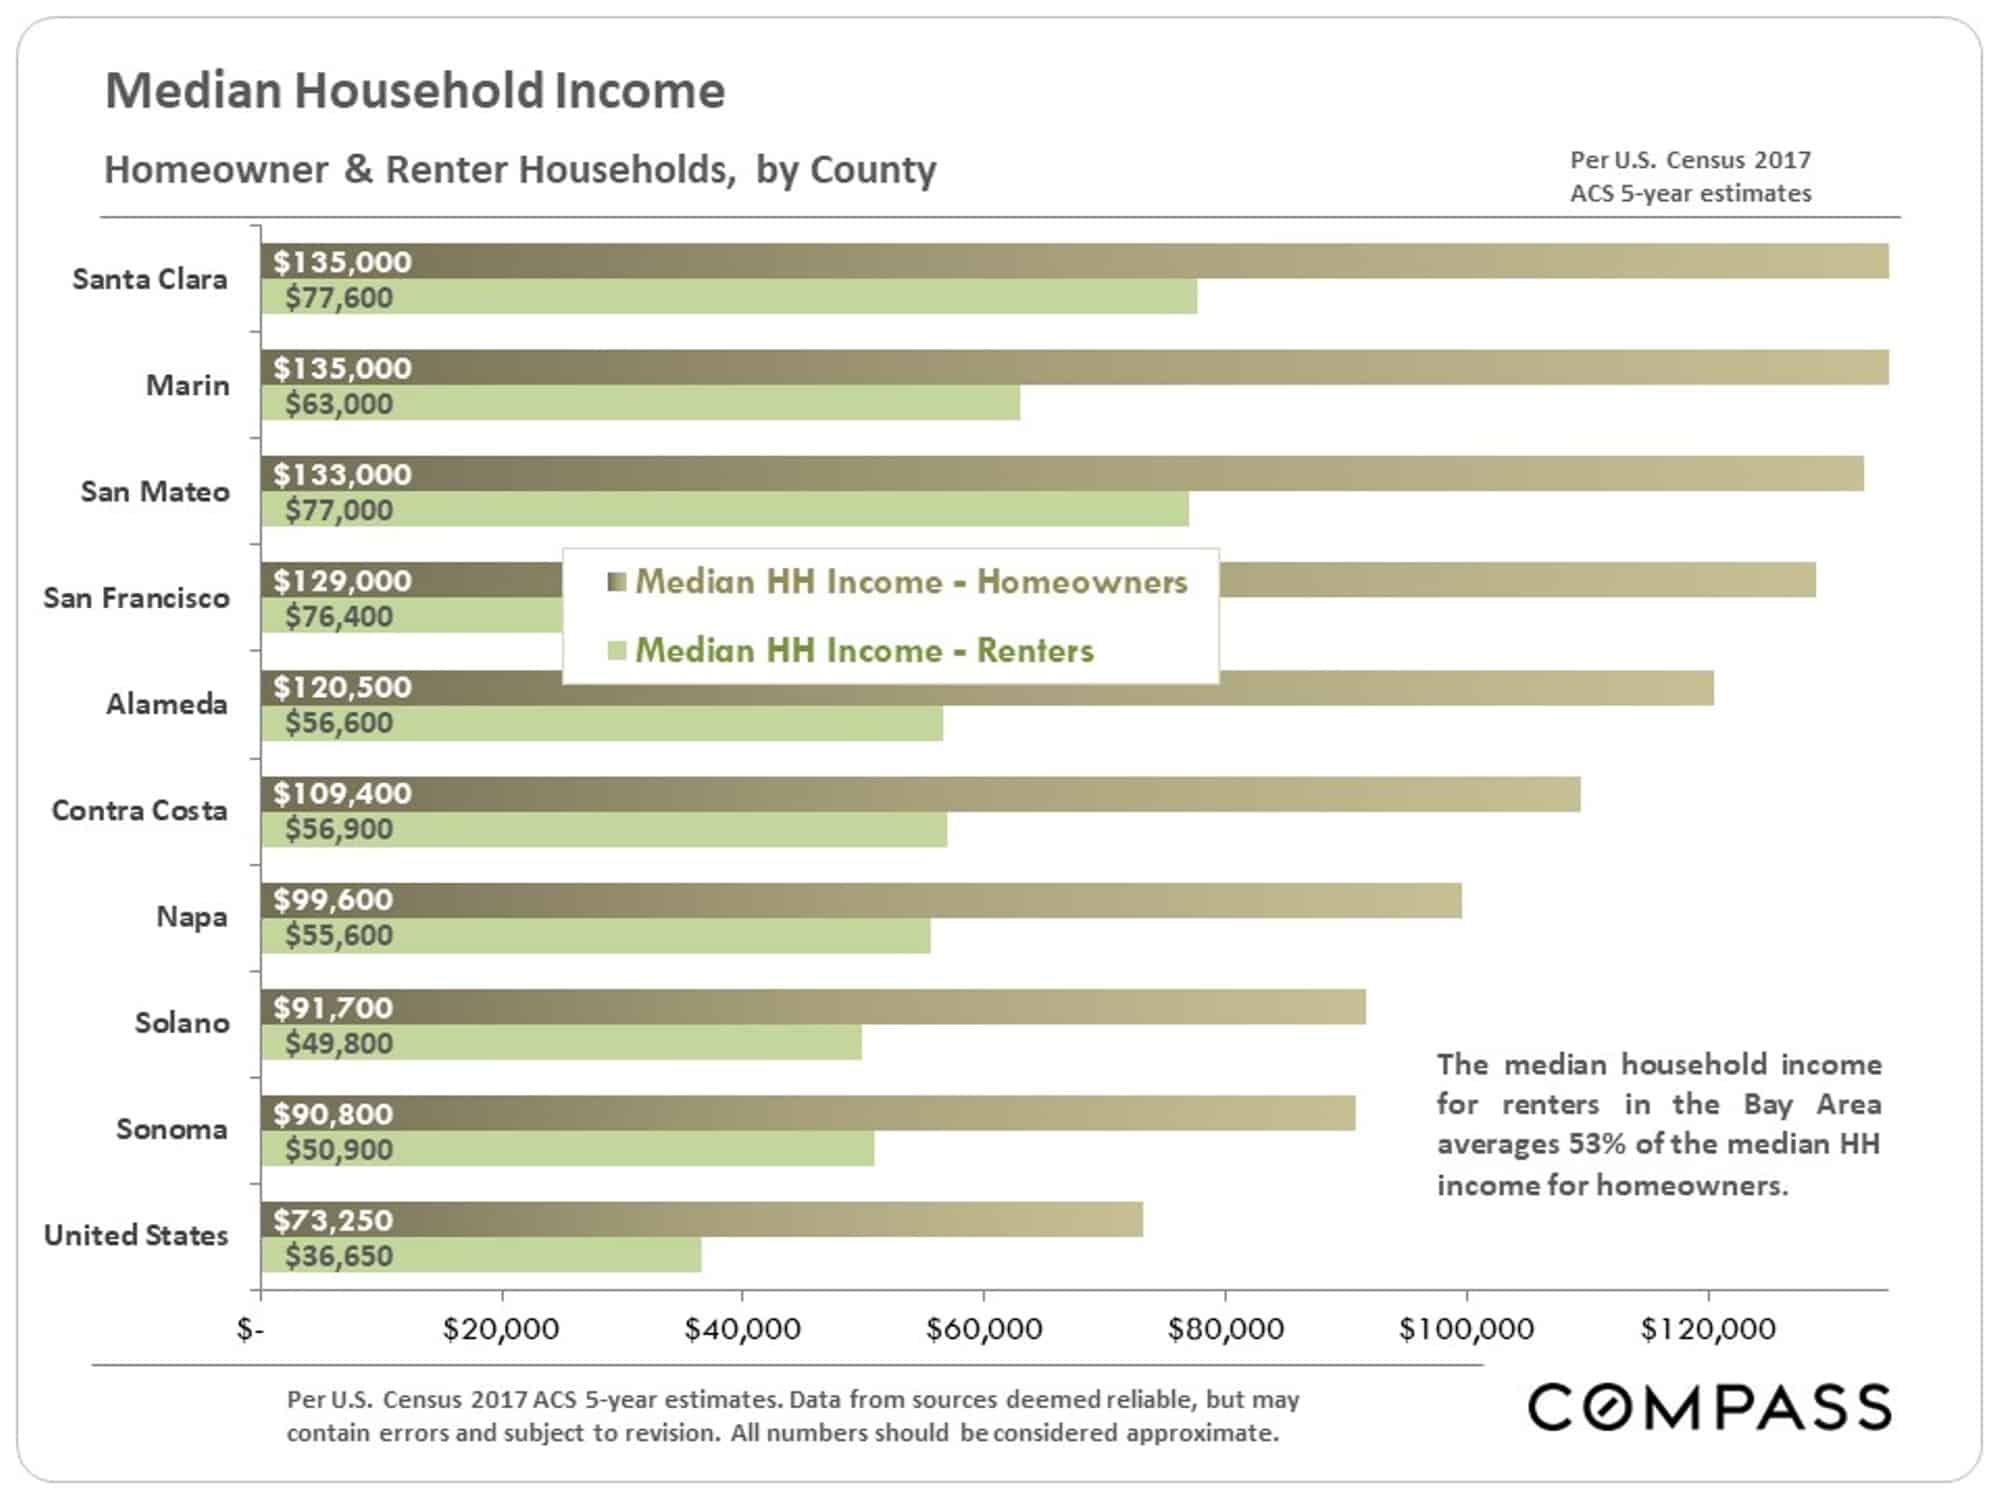
County median household incomes are broken out below for homeowners and tenants. Comparing the chart below to the one above illustrates the disparity between prevailing incomes and the incomes required to purchase in the Bay Area.
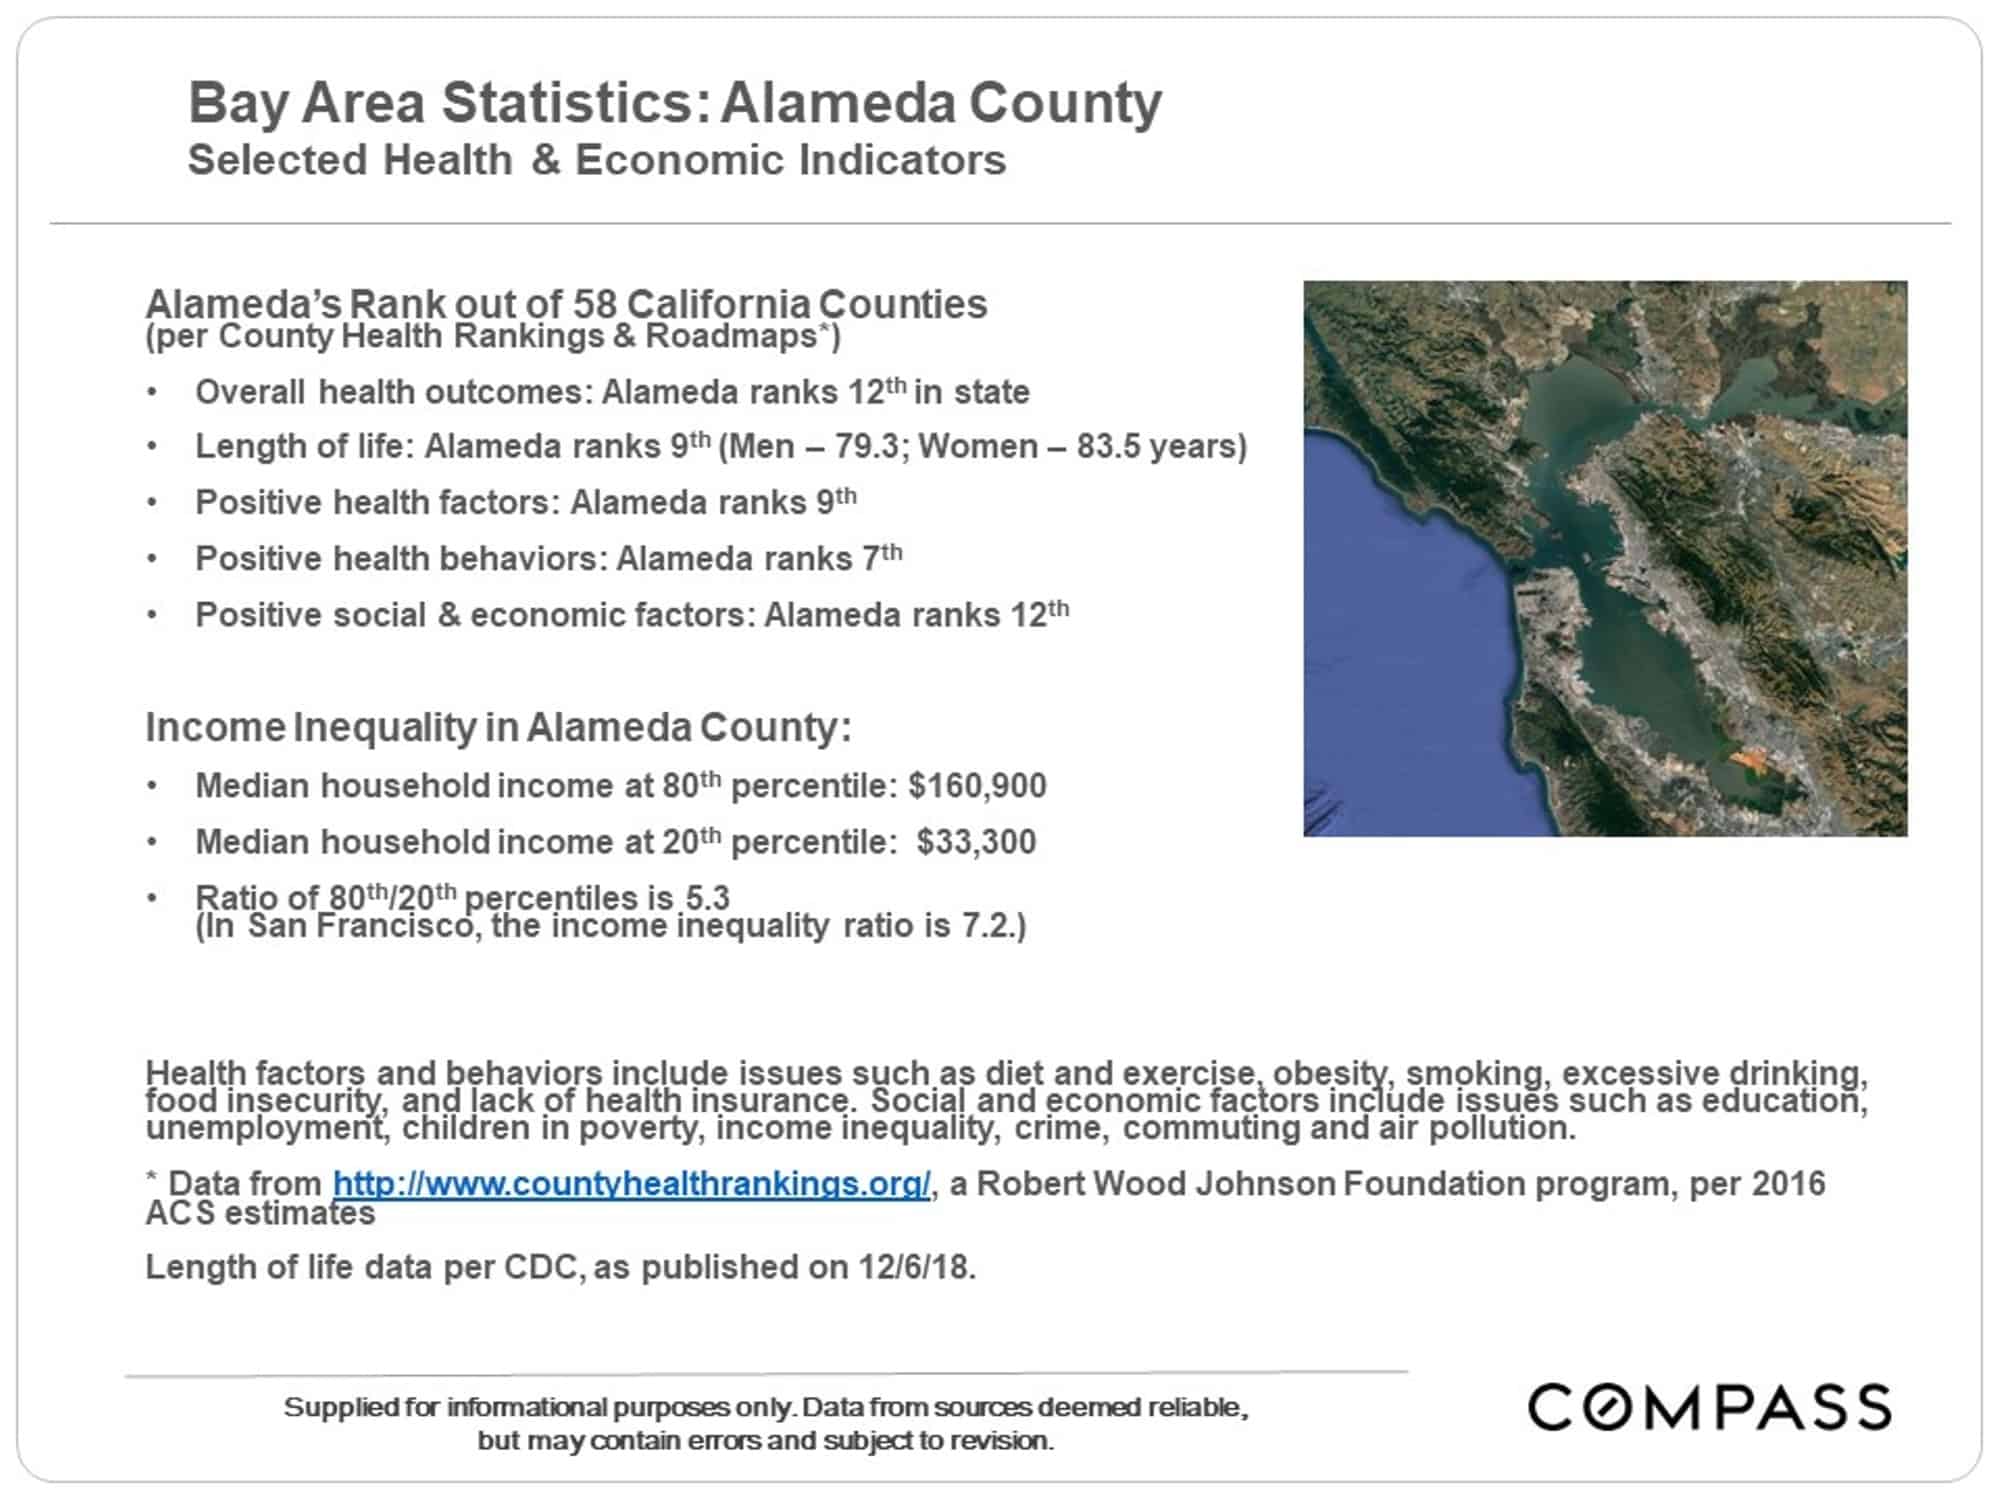
Health & Economic Indicators
According to CountyHealthRankings.org, Bay Area counties are at the top of the list within CA for Overall Health Outcomes: Marin, San Mateo and Santa Clara rank 1, 2 & 3, while Alameda County ranks 12th. (Within larger regions, it is not unusual for more urban areas to have lower rankings than more suburban ones.)