Marin May Real Estate Market Report

Marin County Real Estate
Year-over-Year, Spring Market is Cooler as Median House Sales Price Remains Steady
May 2019 Report
With April’s end, we now have 2 months of spring season data unaffected by market activity at the end of 2018, when financial markets plunged. As of early May 2019, stock markets have recovered to hit new highs, interest rates are far lower than last year’s peak, and unicorn IPOs have begun to roll out after a media frenzy regarding their potential effects on real estate markets.
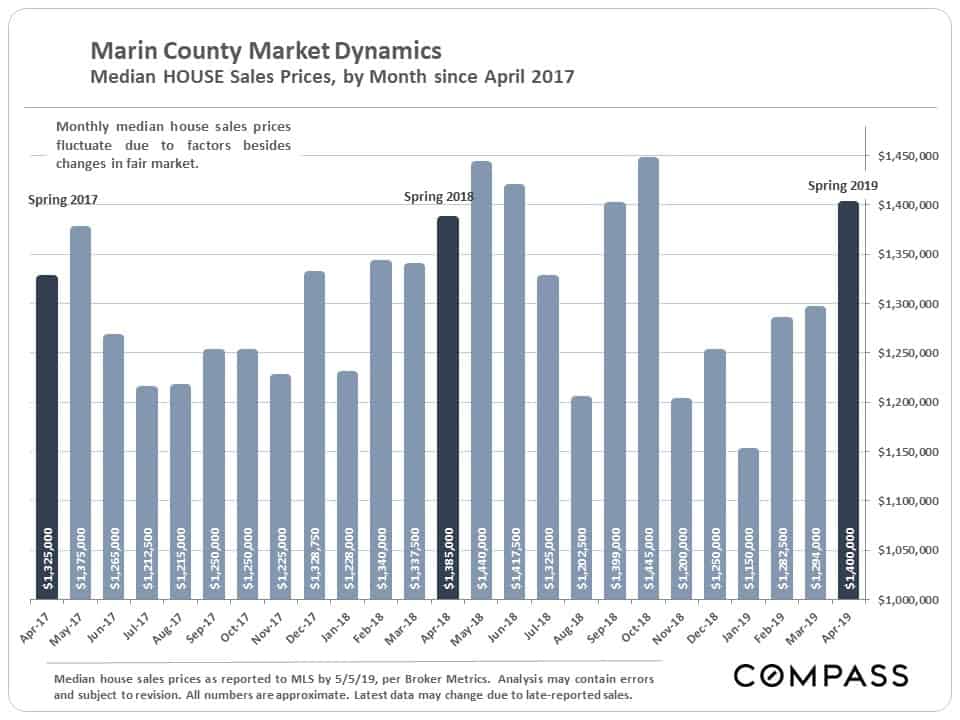
Marin’s median house sales price is about the same on a year-over-year basis, but in 2018, the May and June prices were higher than in April. There are still 2 months of spring selling season to go and we may see further increases. Generally speaking, supply and demand dynamics are cooler than the market of spring 2018, but some other Bay Area counties have seen larger changes, such as median sales price declines.
Monthly Median House Sales Prices – 2 Years
Marin’s monthly median sales prices tend to fluctuate more dramatically than in other counties – which is why we prefer using quarterly or longer period data – but the below chart illustrates the trend over the past 2 years, including the common effect of seasonality.
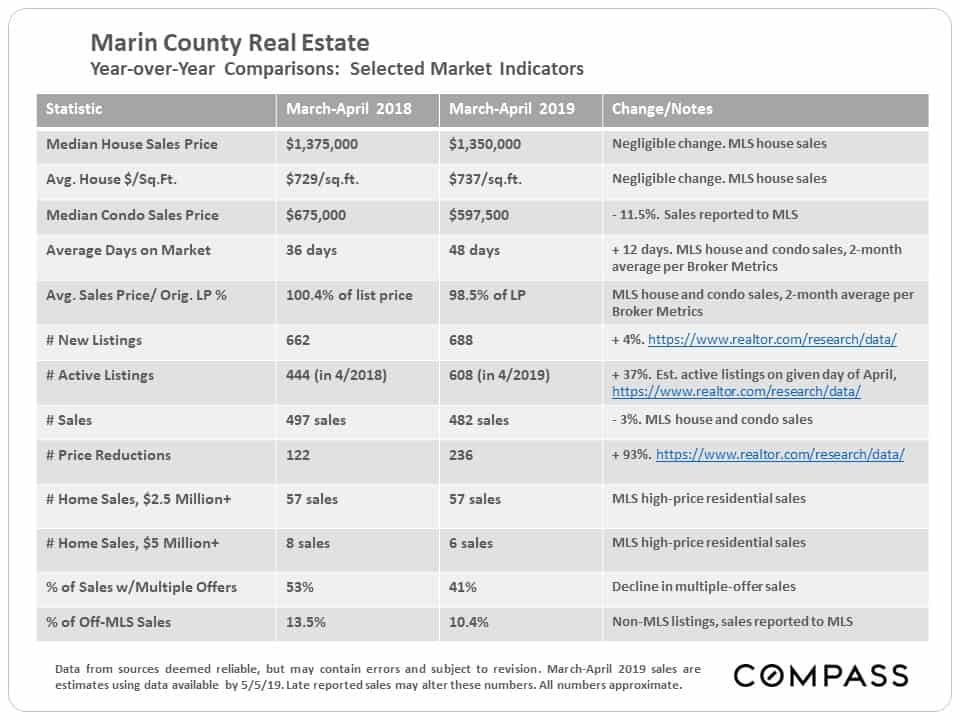
This table compares the March-April market statistics of 2018 and 2019. Many of the year-over-year changes are relatively minor – and 2 months data should still be considered short term until substantiated over the longer term. The data for the full second quarter, April through June, will be a more definitive indicator.
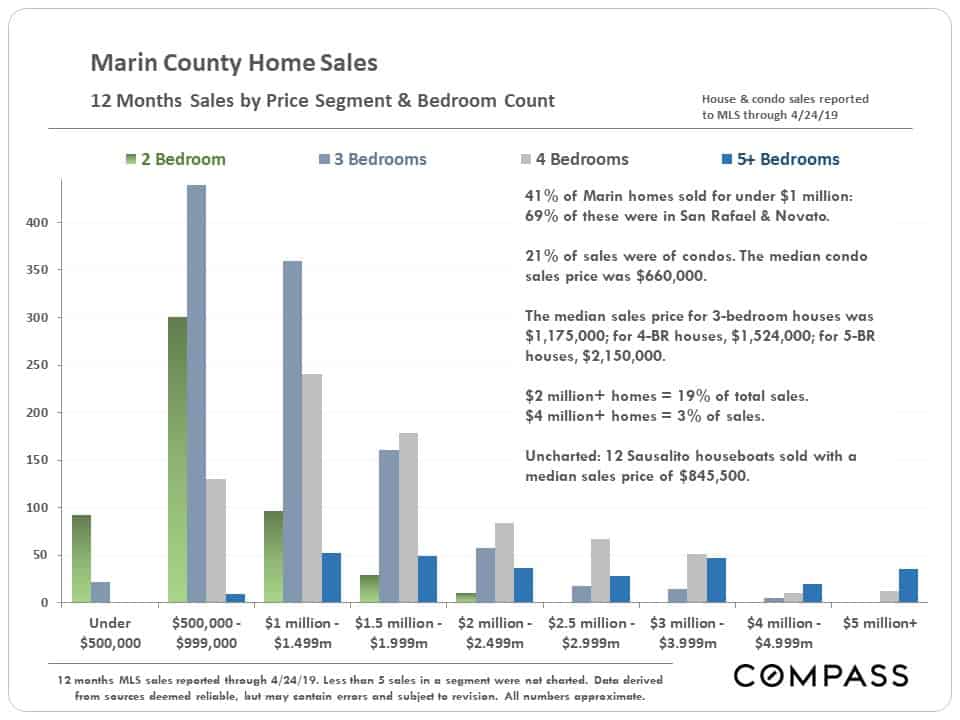
Home Sales by Price Segment & Bedroom Count
An illustration of the last 12 months of house and condo sales broken out by price range and number of bedrooms.
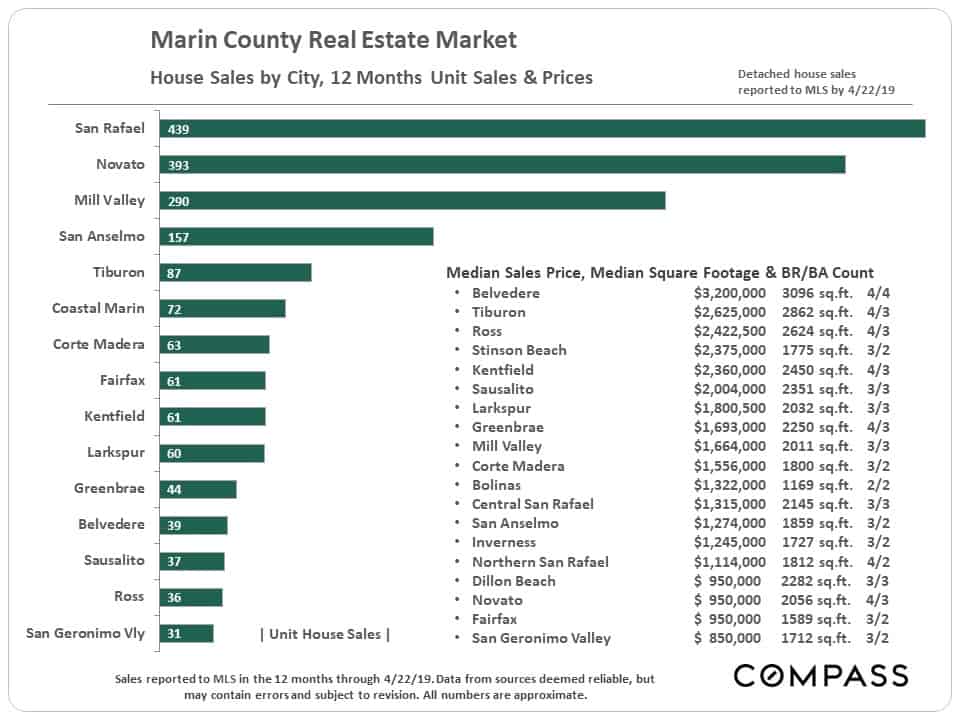
House Sales Volumes, Median Prices & Median Sizes
The next chart breaks out the number of house sales over the past 12 months by city, with median house sales prices, median square footage, and median bedroom/ bathroom count. (Median means half the sales were for more, or larger size, and half for less, or smaller size.)
Many of Marin’s cities and towns are relatively small markets. Belvedere had the highest median sales price and largest median house size, but relatively few sales.
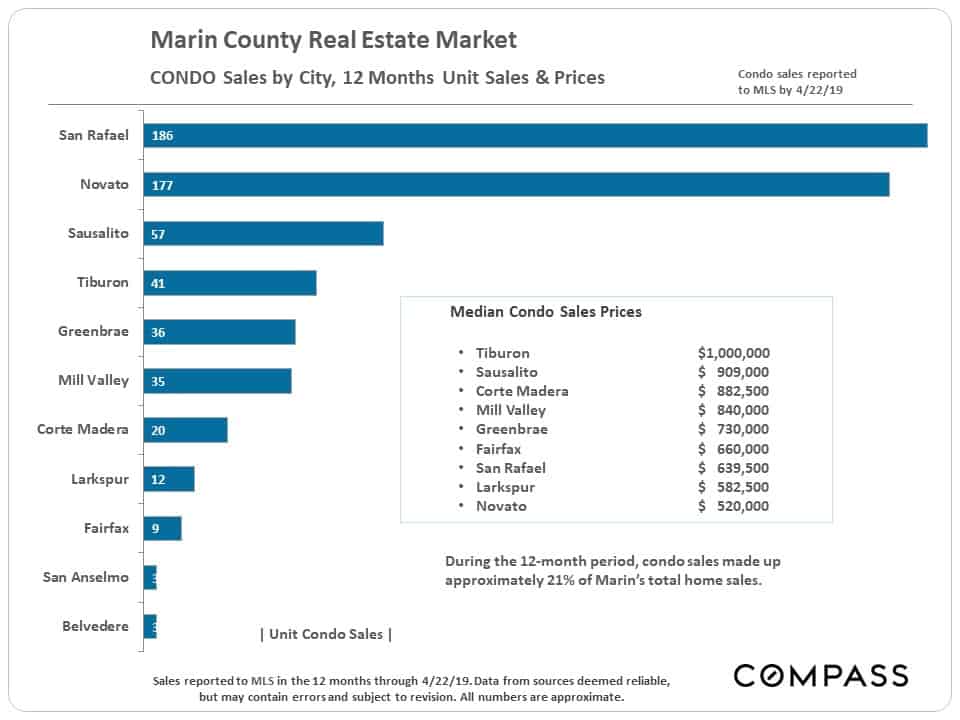
Condo Sales Volumes & Median Prices by City
The median condo sales price in Marin – $660,000 – runs about half of the median house sales price.
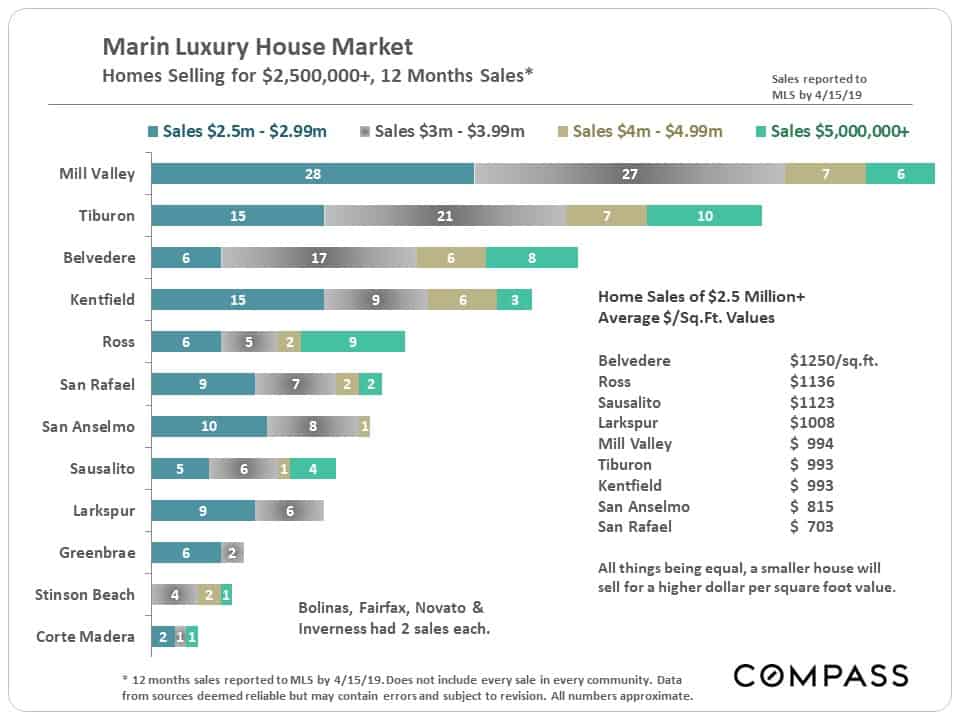
Luxury Home Sales & $/Sq.Ft Values
We typically consider the luxury home market in Marin to begin somewhere in the $2.5m to $3 million range – constituting the top 10% of house sales – though what one buys for any price varies radically by location. The biggest luxury markets are exactly where one would expect: Belvedere, Ross, Tiburon, Kentfield and Mill Valley (not in that order by sales volume), though large, beautiful, expensive homes can be found throughout the county.
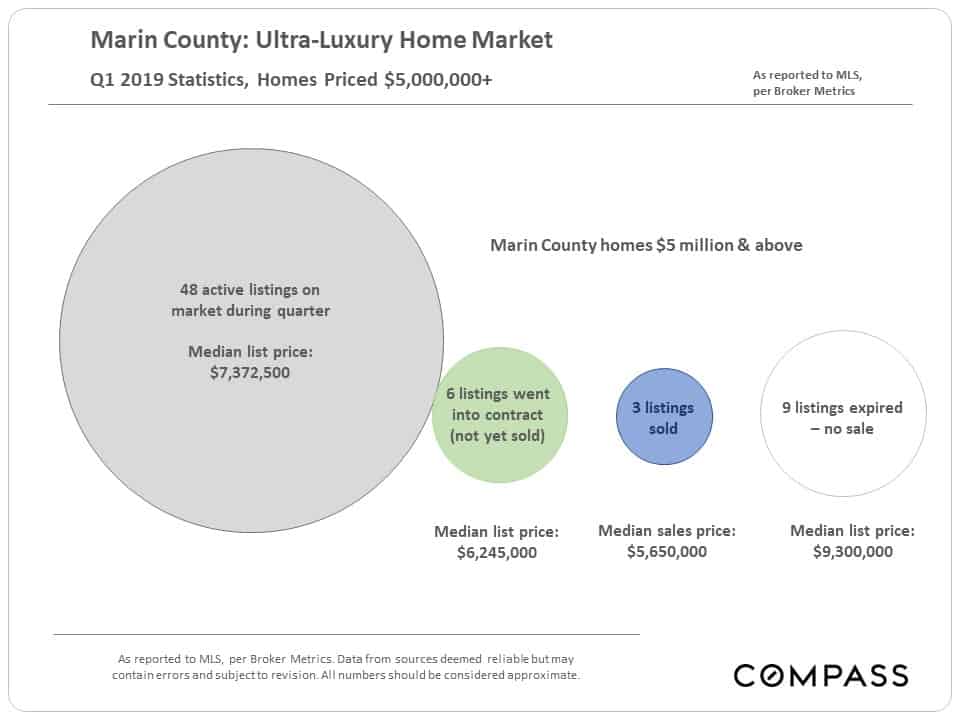
Q1 2019 “Ultra-Luxury” Homes Market
The softest segment of the market is the highest priced – $5 million+ – where the pool of potential buyers is smallest. In the 1st quarter, as many of these listings expired without selling, as went into contract or closed sale. Note the differential between the median list prices of the various categories and the final median sales price: Correct pricing is a critical issue for these homes.
The second quarter is typically the most active of the year for luxury and ultra-luxury home sales.
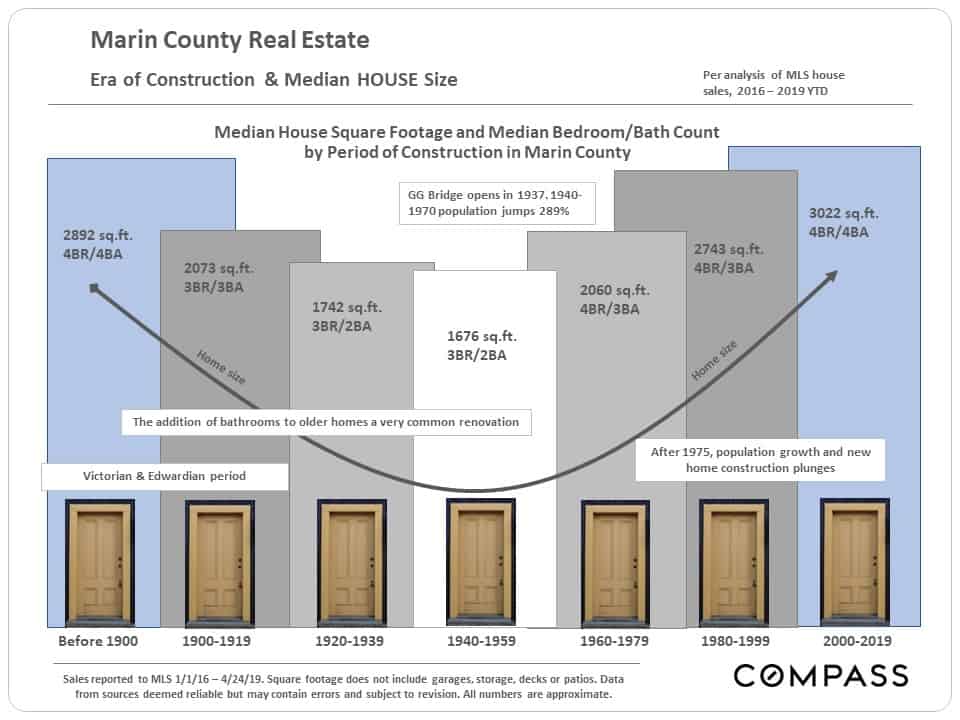
Home Size & Era of Construction
Many factors influence home construction size during any particular period: Affluence, economic conditions, household size, buyer age, land costs, population growth, bridge construction, natural disasters, etc. Generally speaking, the median size of Marin houses built during the Victorian and Edwardian eras was substantially larger than those built 1920 – 1959, with new home construction surging after WWII. Sizes then started increasing until now they are larger than ever – however, new house construction has generally plummeted since 1975.
Note that the figures below are based on recent home sales, and that over the intervening years since original construction, adding a second bathroom to older homes was a very popular renovation.
Over the past few decades, condos have become a major alternative for people purchasing homes of smaller size.
Selected Demographic & Economic Factors
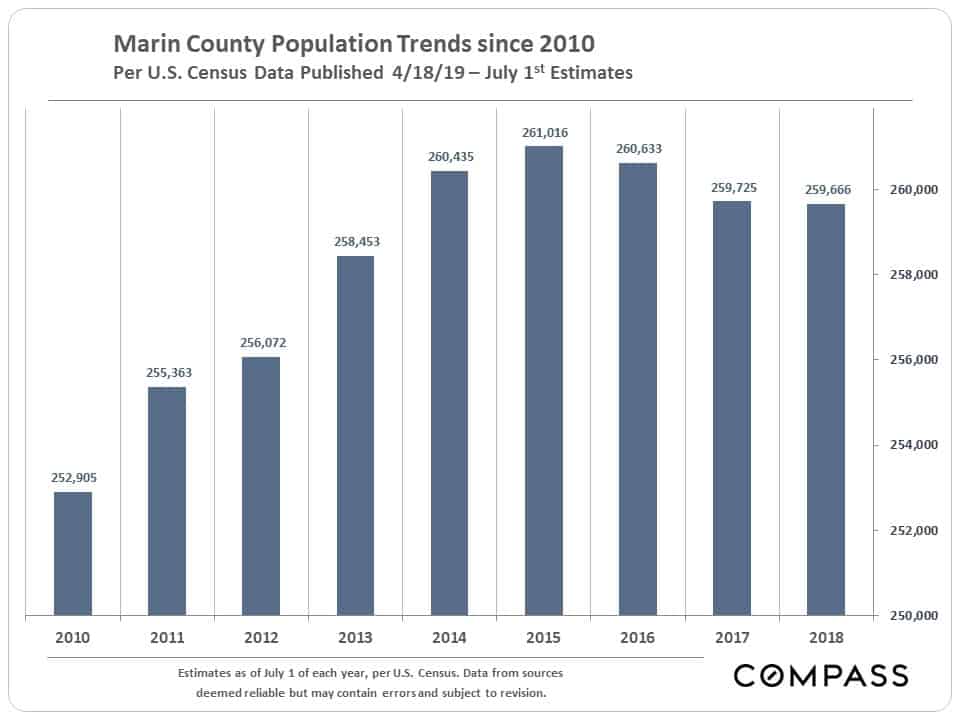
Population Growth (& Decline)
per New Census Figures
Population growth slowed significantly around the Bay Area from relatively torrid increase rates from 2010 to 2015/2016. According to recent census figures, Marin saw a small decline since peaking in 2015.
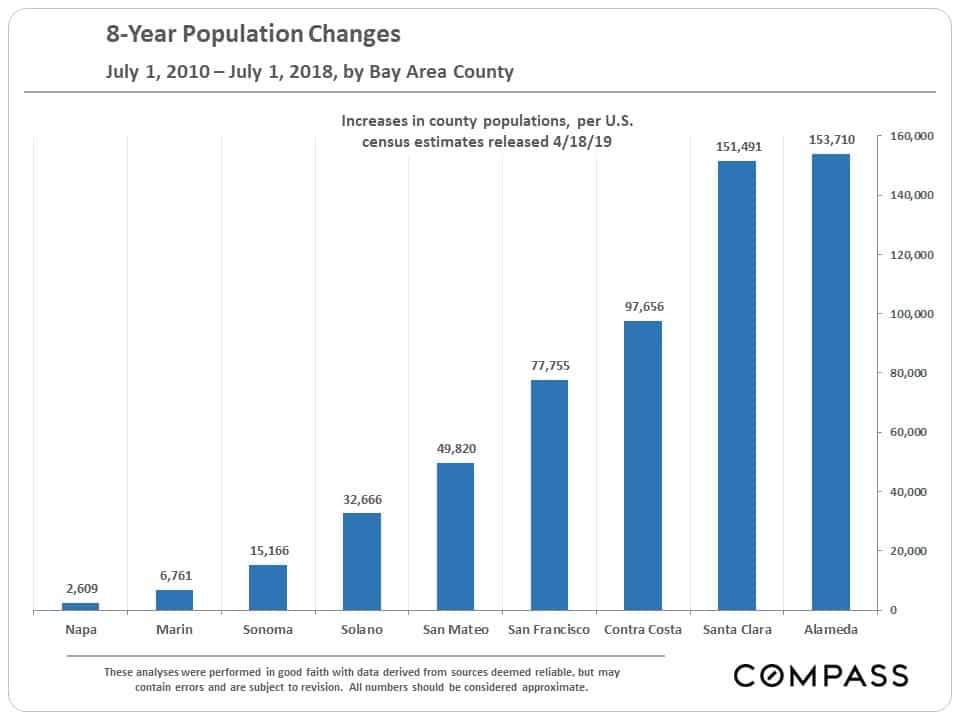
Among Bay Area counties, Marin has ranked second from the last in both total number growth since 2010 (illustrated below), and by percentage increase (2.9%). The 3 North Bay counties have not seen the intense population increases which have occurred in other counties in recent years – and, of course, that is exactly what many of its residents prefer.
Population growth can be a major factor in supply and demand dynamics in real estate markets.
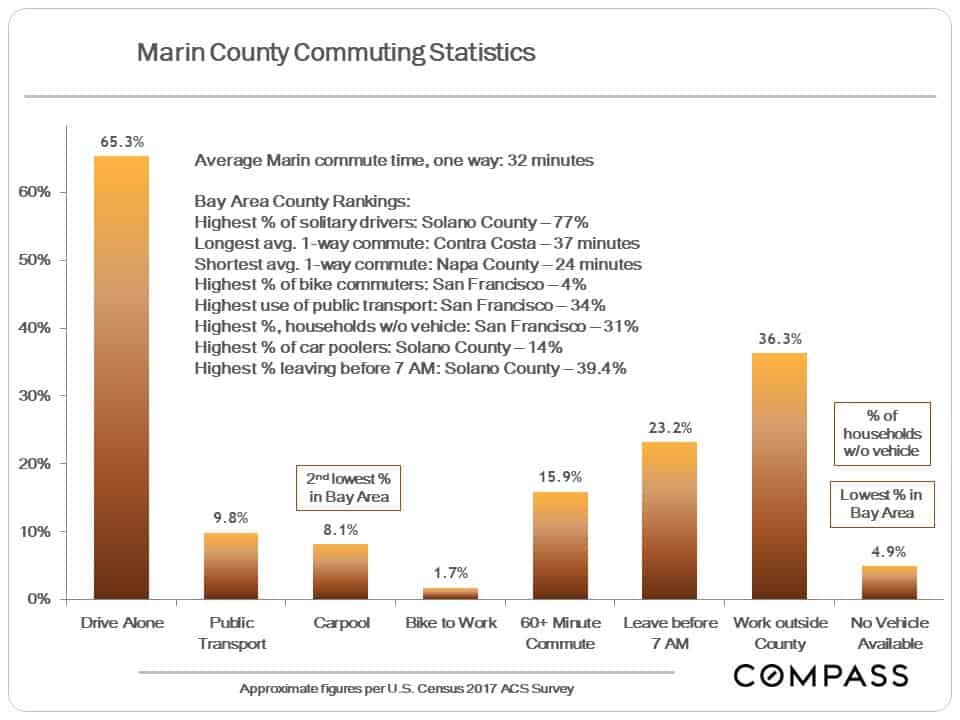
Commuting
Venture Capital Investment
In recent years, the Bay Area has been the biggest destination of venture capital investment dollars in the country – and probably the world. These tens of billions of dollars have constituted a massive factor in the local economy, supercharging the creation of new companies, hiring, and, eventually, IPOs. Ultimately, venture capital is seed money that in the last decade has exploded into the creation of stupendous amounts of new wealth.