Marin June Real Estate Market Report

Marin County Real Estate
Spring Market Strengthens, But Dynamics Are Cooler Year-over-Year and Median Sales Prices Somewhat Lower
June 2019 Market Report
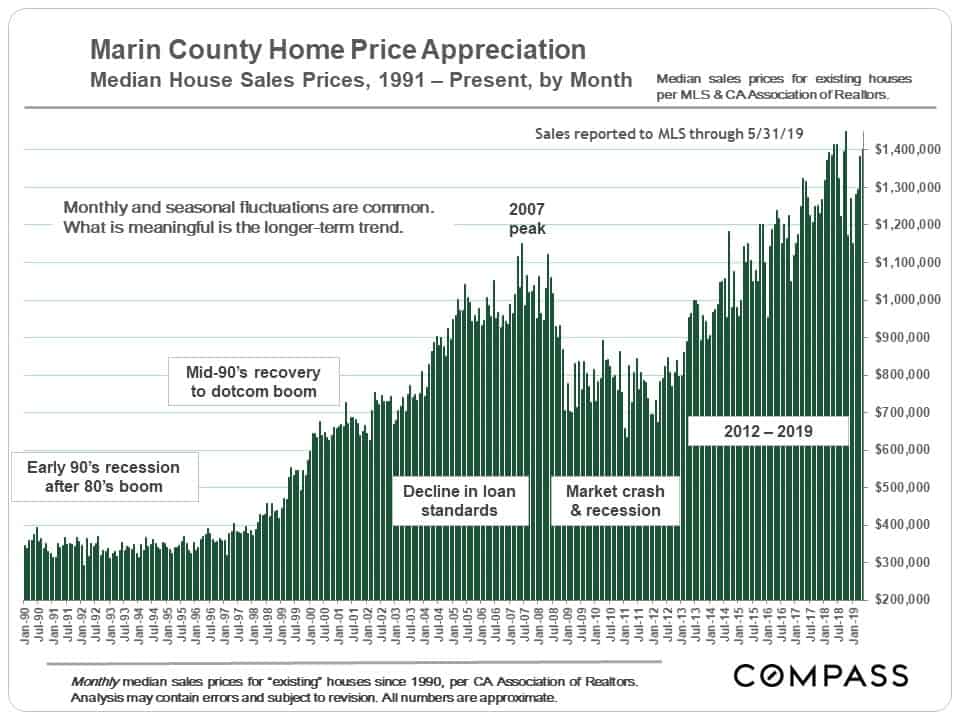
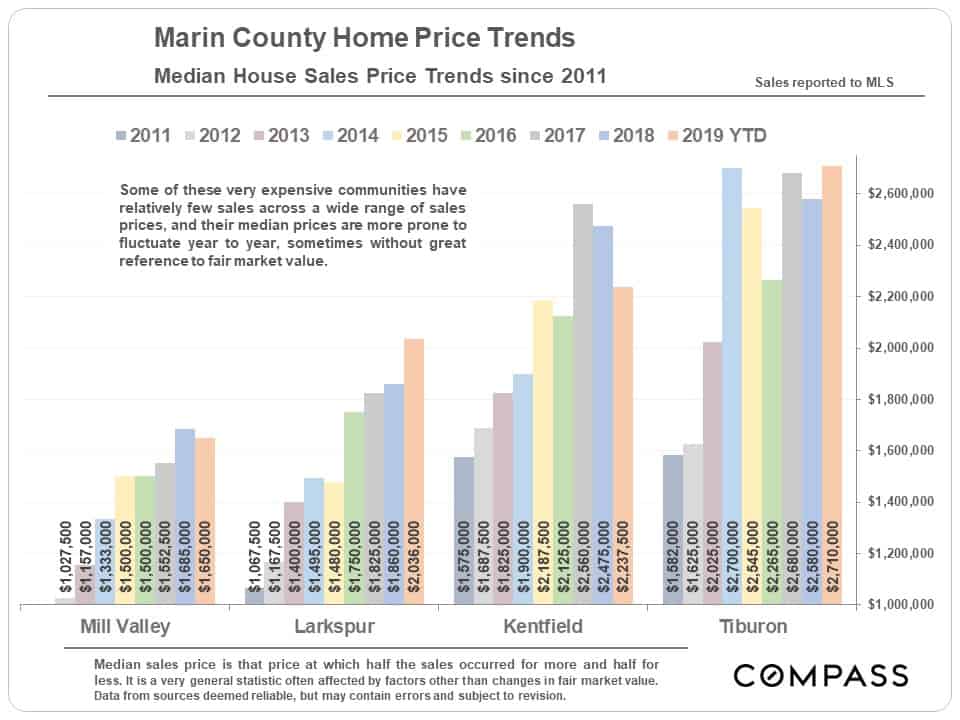
Long-Term Median Home Price Trends
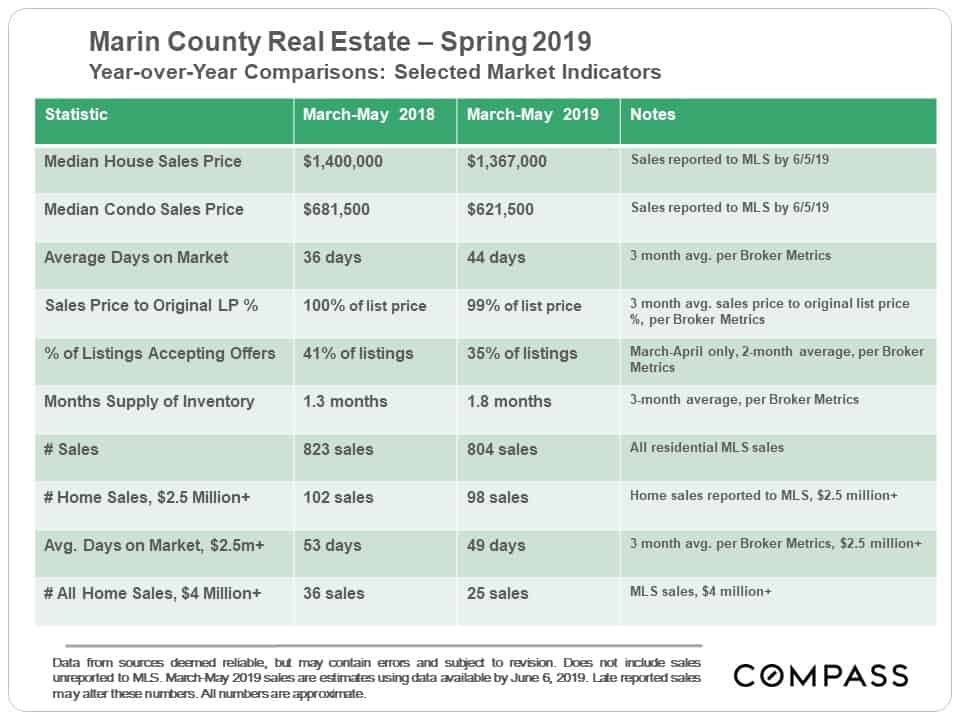
March-May Market: Year-over-Year Comparisons
Some indications of year-over-year cooling from the very hot spring 2018 market, pretty much across the board. The median house sales price ticked down a bit. The larger decline for condos should be taken with a grain of salt due to the relatively low number of condo sales over the period.
Generally speaking, the changes are not very dramatic, and indeed some current statistics – such as the recent, still low, months-supply-of-inventory reading – would typically be considered to indicate a high-demand/ low-supply market.
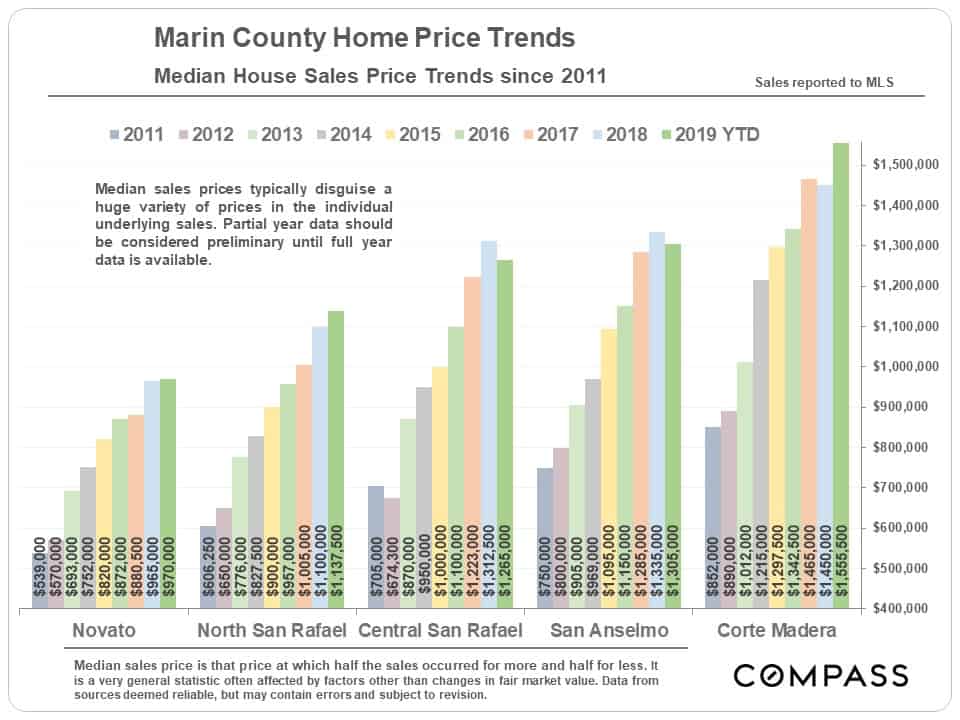
Median Home Price Changes
for Selected County Markets
Comparing annual median home prices to partial year prices is not really an apples-to-apples comparison because of the effect of market seasonality on sales prices – and year to date, some cities are up, some down and some are basically unchanged. It’s hard to discern a definitive trend.
We chose the selection of cities below because they had higher numbers of sales than other communities, while representing a range of price points. Still, in the first 5 months of 2019, Tiburon only had 26 house sales reported to MLS, a surprisingly low number. (Belvedere and Ross had even fewer, but they never have many sales.) Full-year 2019 median home prices may be significantly different than the year-to-date figures.
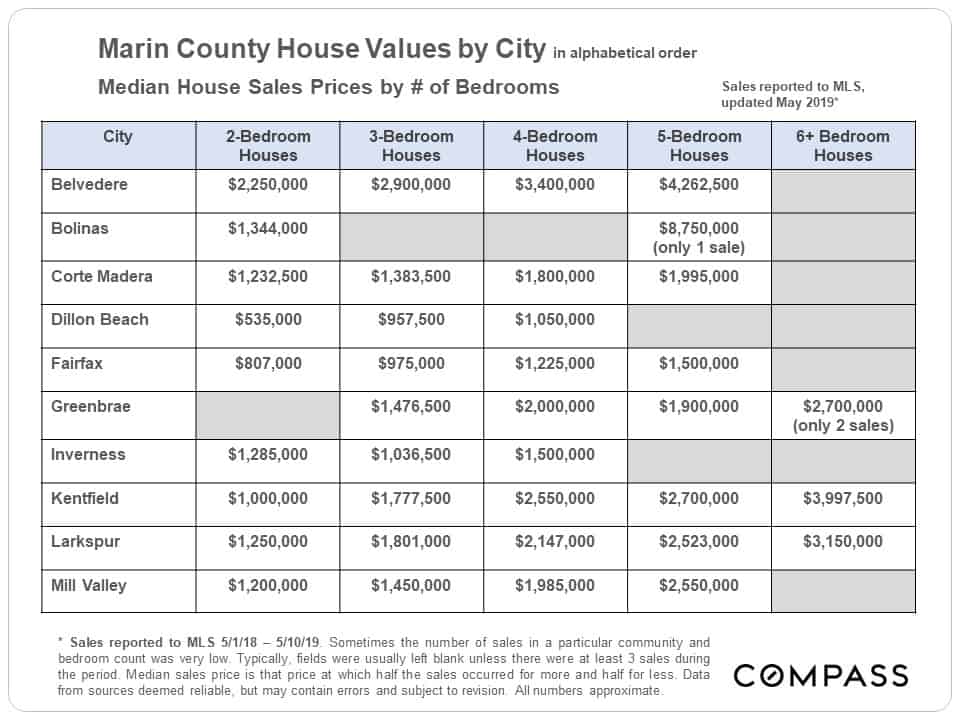
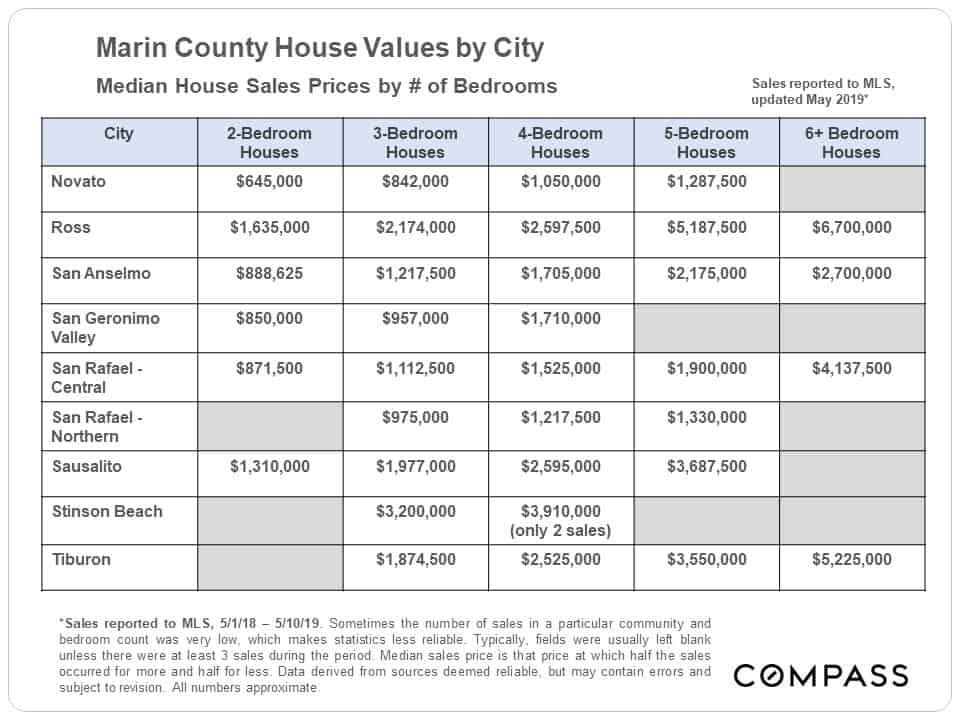
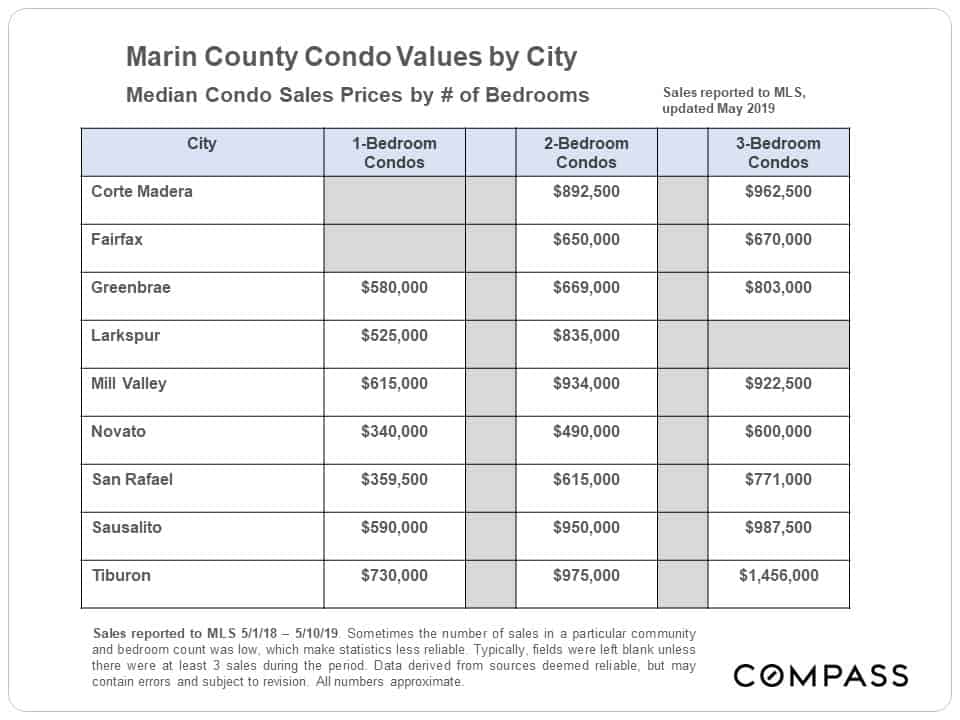
Median Home Sales Prices by City
& Bedroom Count
Click on the button-link below to go to our updated map of Bay Area median house prices.
Selected Market Indicators
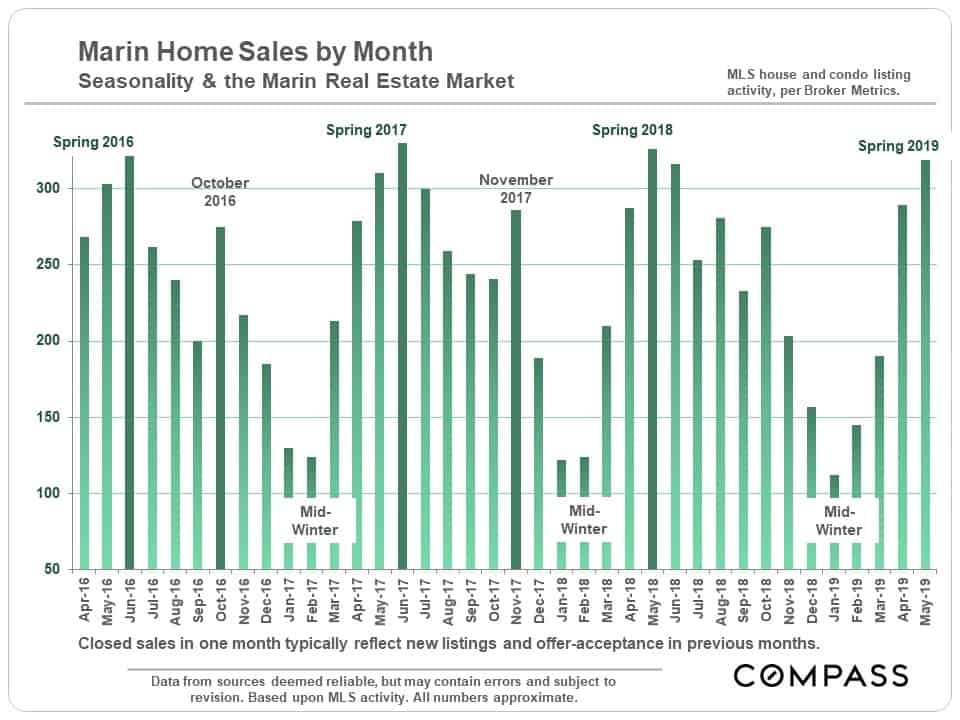
Among other angles, these charts illustrate the dramatic effect that seasonality plays in market demand. Typically, the market will now begin slowing down for summer before picking up again during the relatively short autumn selling season. However, June sales data will mostly reflect May accepted offers, and will complete our picture of the second quarter, usually the most active of the year.
Monthly Sales Volume
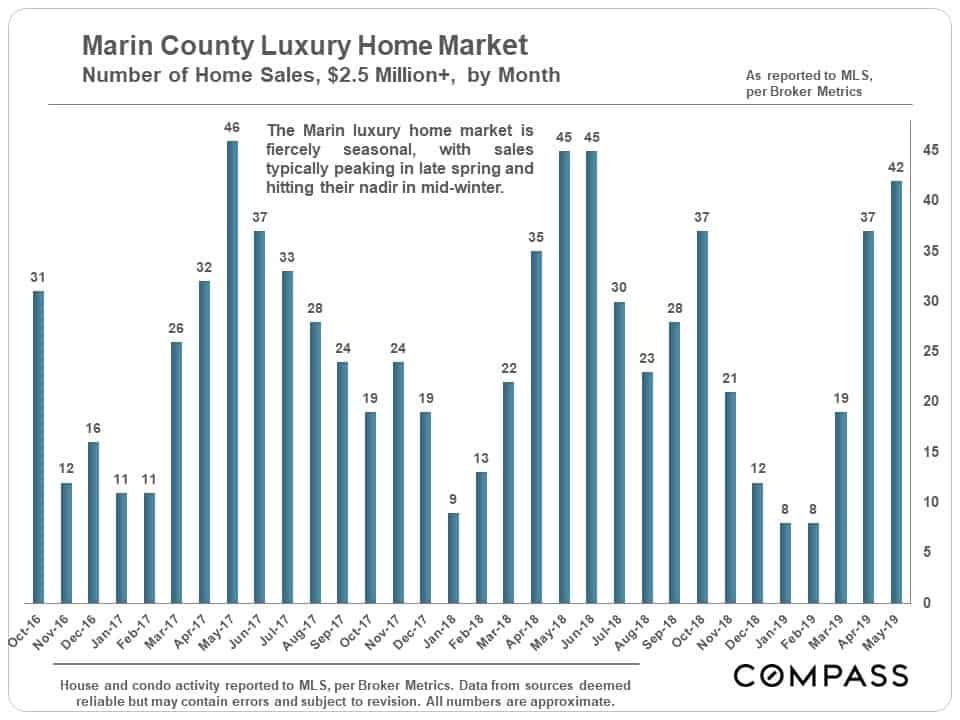
Marin Luxury Home Sales
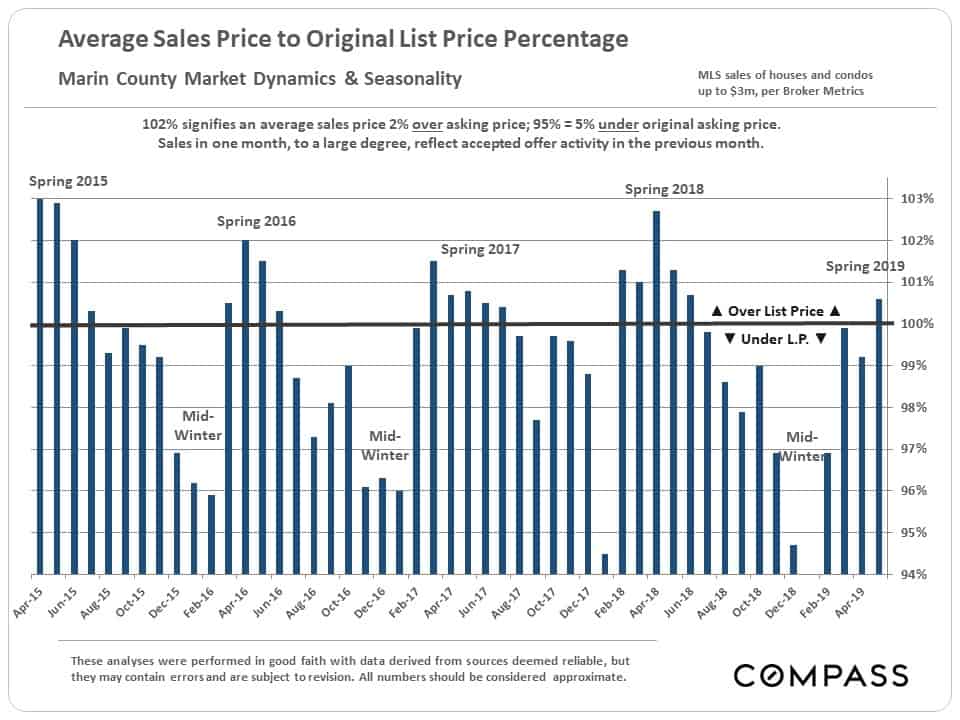
Average Sales Price to Original List Price Percentage
Buyer competition for new listings as measured by this classic statistic of demand is down compared to the peaks reached in recent spring markets.
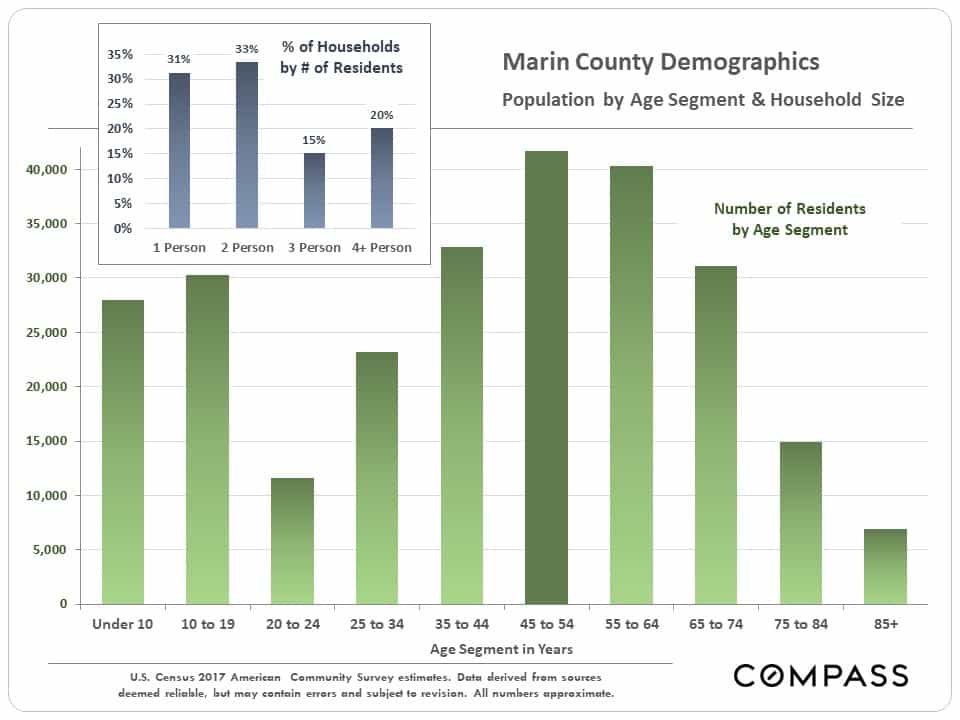
Selected Economic & Demographic Snapshots
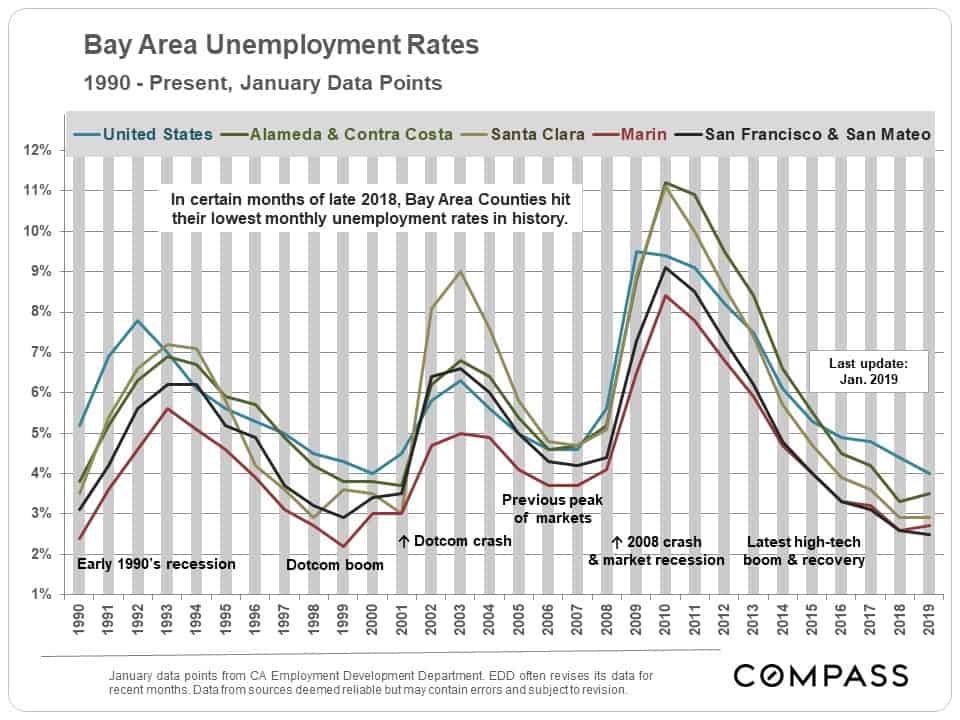
This next chart graphs Bay Area unemployment rates from 1990 through January 2019. By April 2019, they had typically fallen another half percentage point. Marin often has the lowest rate in the Bay Area.
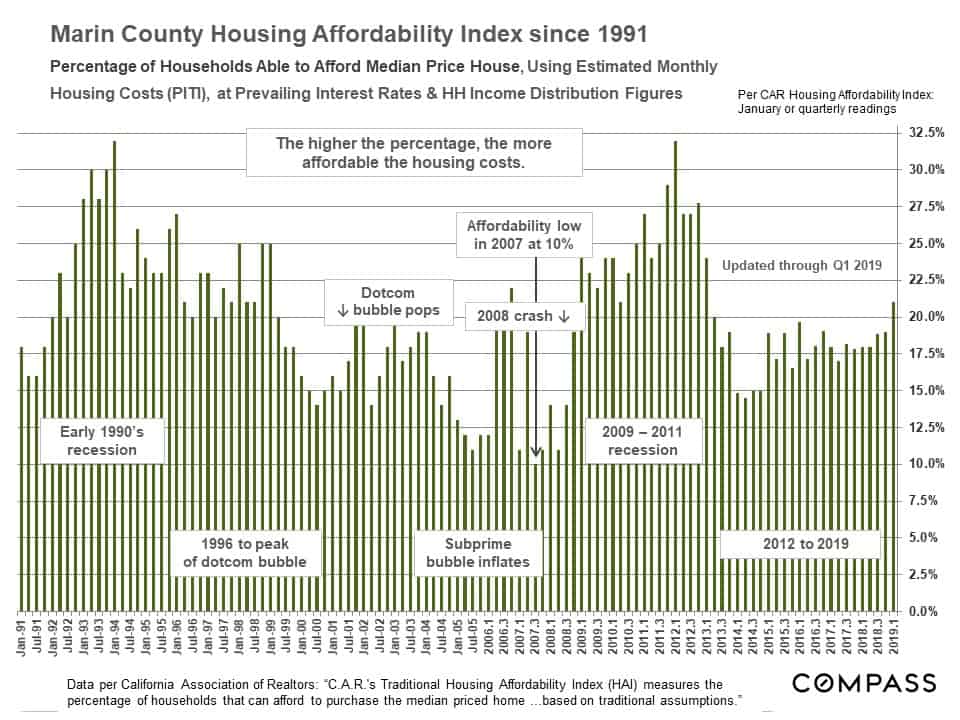
Bay Area housing affordability – the percentage of county households that could afford to buy a median priced house with a 20% down-payment – ticked up in Q1 2019 due to the significant drop in interest rates, and in some counties, small year-over-year declines in median house sales prices. But affordability rates around the Bay remain very low as compared to the state and the country.
Marin has the highest median age in the Bay Area (46.1), and the lowest percentage of millennials. Other counties to the south have seen large influxes of millennials during the latest high-tech boom, often significantly shifting their demographics.