Santa Clara February 2021 Real Estate Market Report

Santa Clara County Real Estate
Strong Finish to 2020 & Heated Start to 2021
February 2021 Report
Our January report focused mostly on 2020’s annual statistics. This report will put most of its attention on quarterly and monthly indicators to better illustrate changes occurring as 2020 progressed, pre- and post-pandemic, and 2021 began.
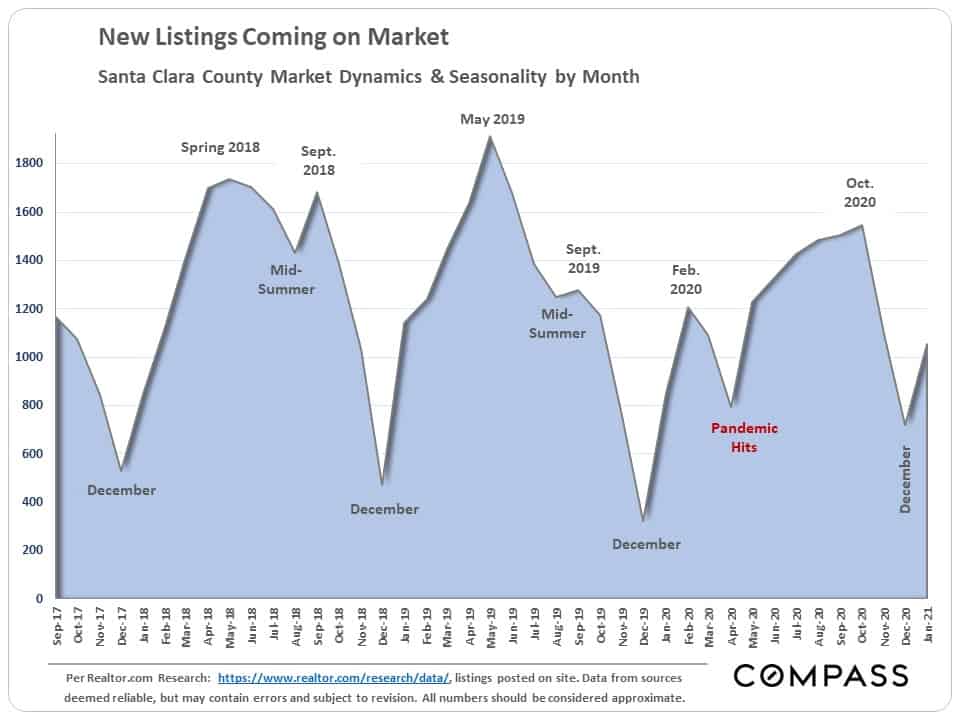
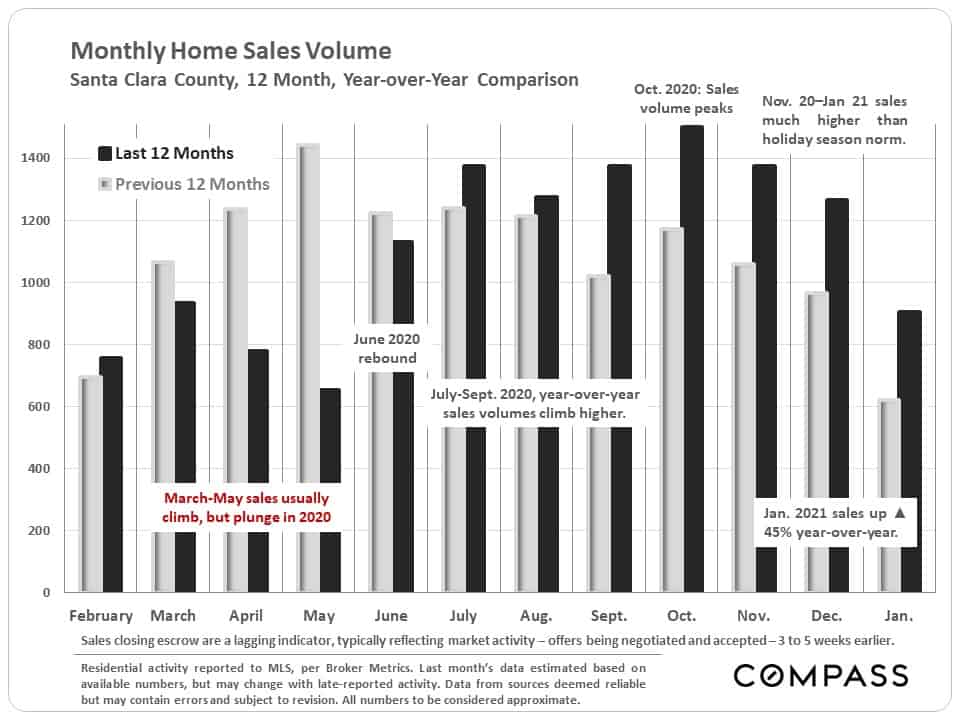
Sales volume in January increased approximately 45% above January 2020, a very substantial year-over-year increase. As is the norm, new listings started to come on market in increasing numbers after hitting the usual, annual low point in December. The number of new listings in January was up 24% year-over-year, while the number of listings going into contract was up 39%.
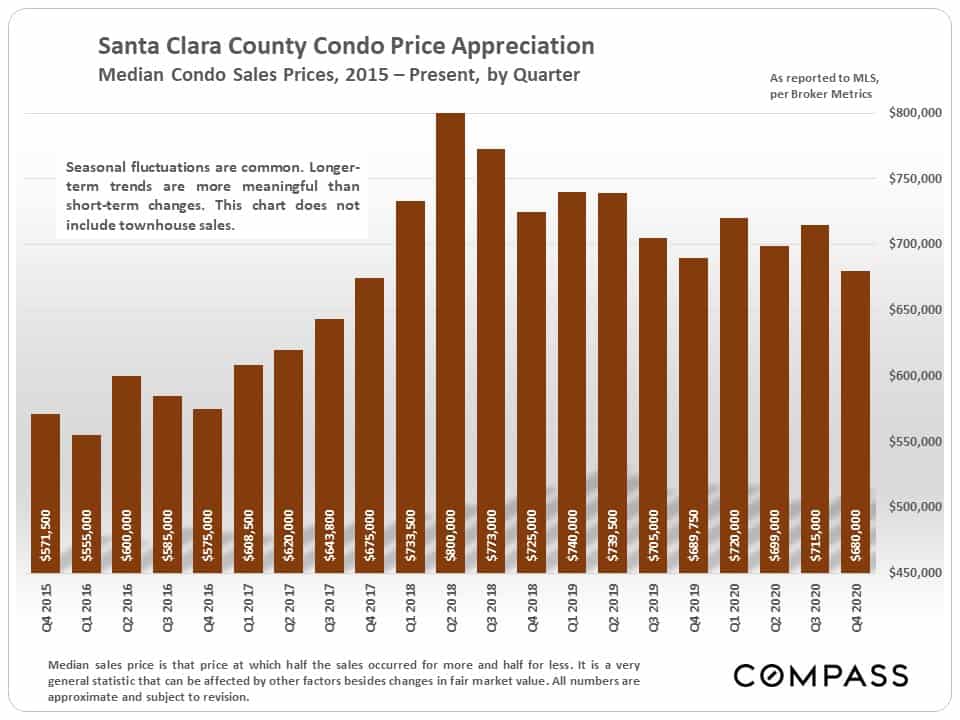
In most of the markets around the Bay Area – but especially those with more urban concentrations – condo markets were generally softer in 2020 than house markets. This was the case in Santa Clara County, as illustrated in a few of the charts and tables in this report.
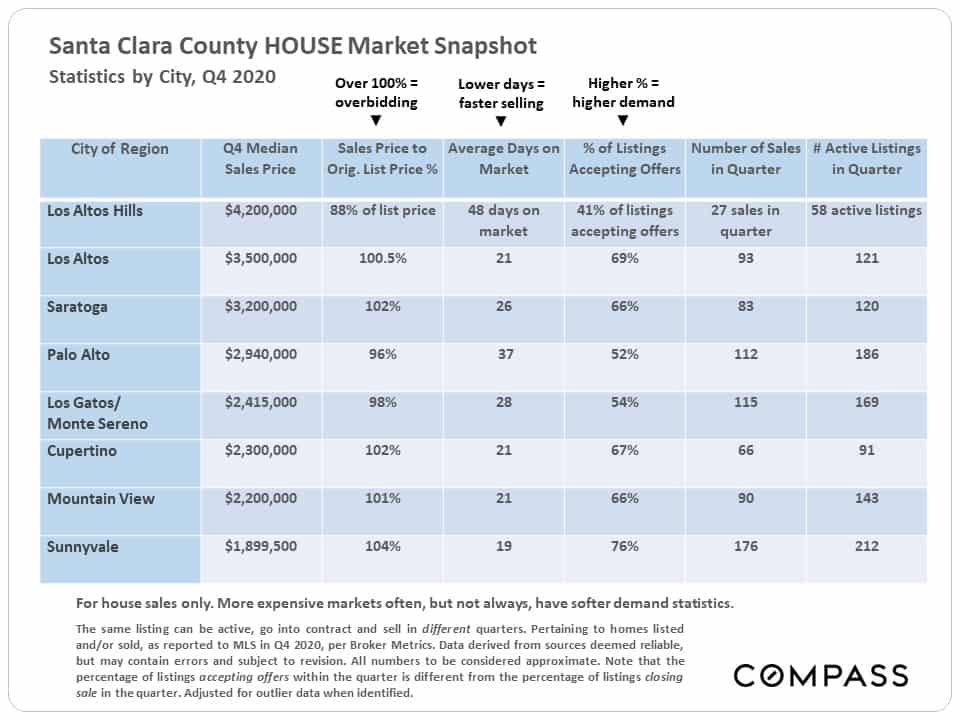
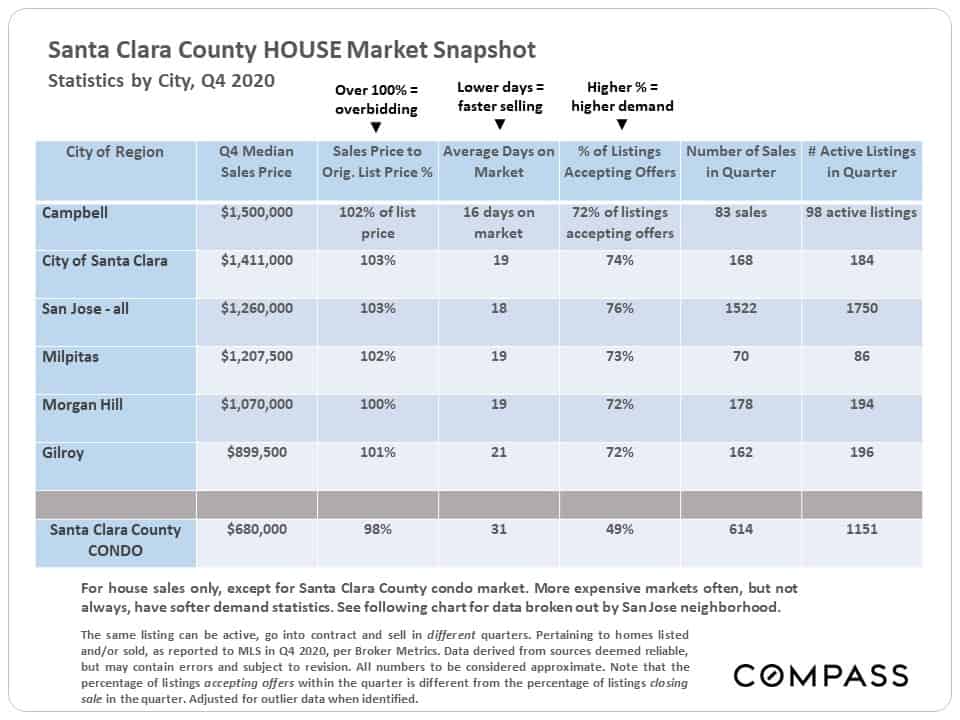
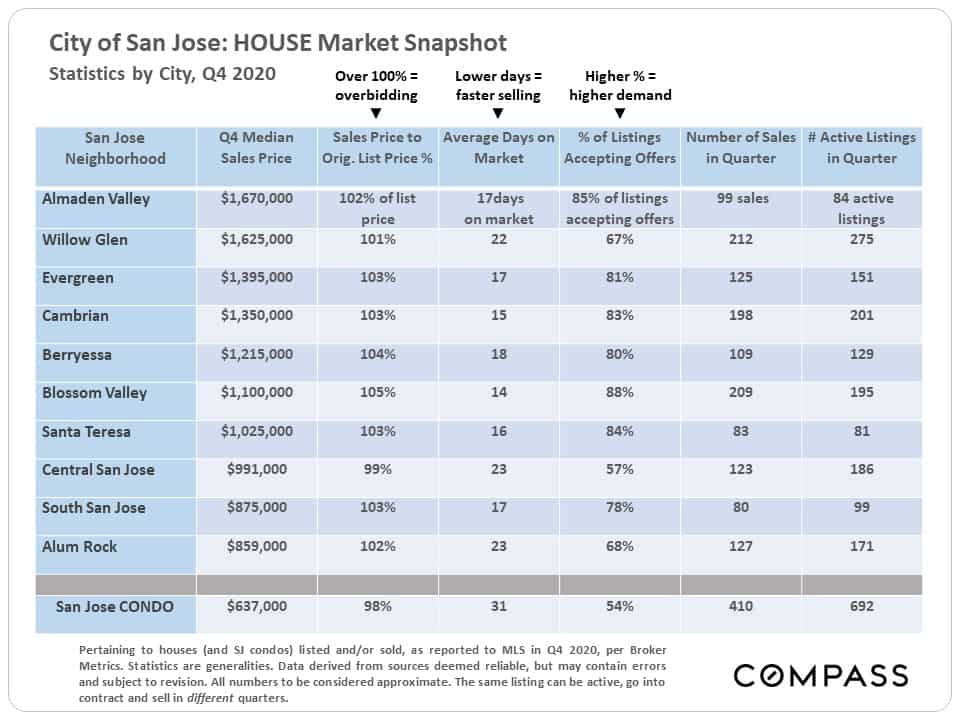
The 3 tables below reflect market statistics and values for Q4 2020 only, which will often be different than those for the full year 2020. Note that it is not unusual for more expensive markets to have softer supply and demand statistics – such as higher average days on market figures, and lower percentages of listings accepting offers within the period – though this is certainly not always the case.
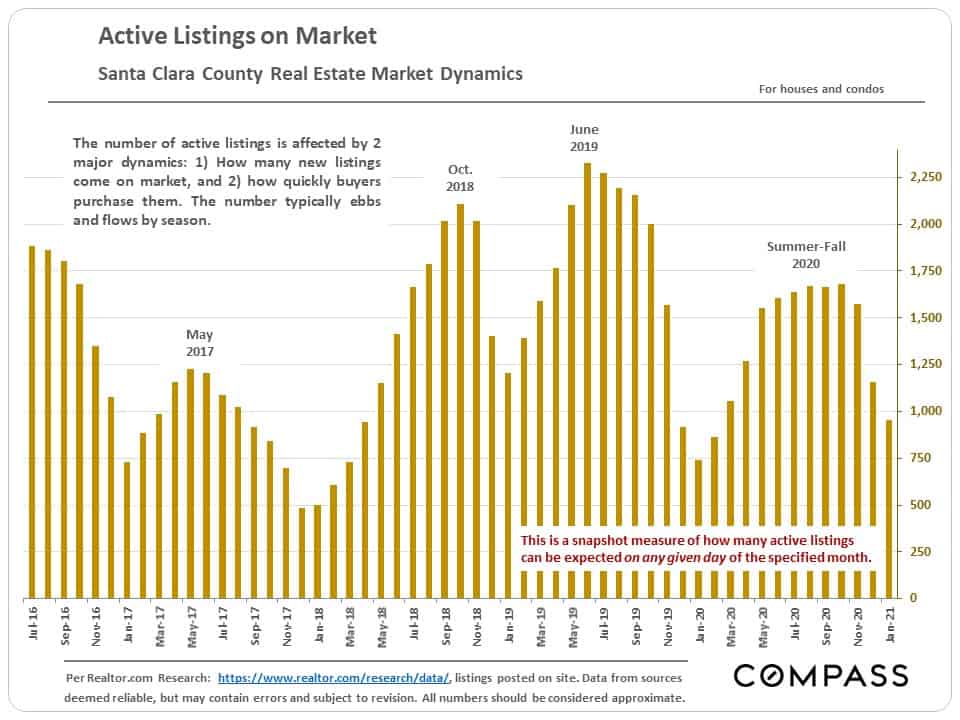
Generally low inventory levels of listings available to purchase have played a large role in the heat of the market in the past year. Listing activity has simply not kept pace with buyer demand, which puts upward pressure on prices.
Month by month, year-over-year comparison of home sales volumes – illustrating the initial pandemic crash in activity followed by the market rebound that saw monthly sales volumes climb well above the levels of the previous year: 45% higher in January 2021.
In the chart below, the black columns represent sales in the past 12 months, and the gray columns the 12 months prior.
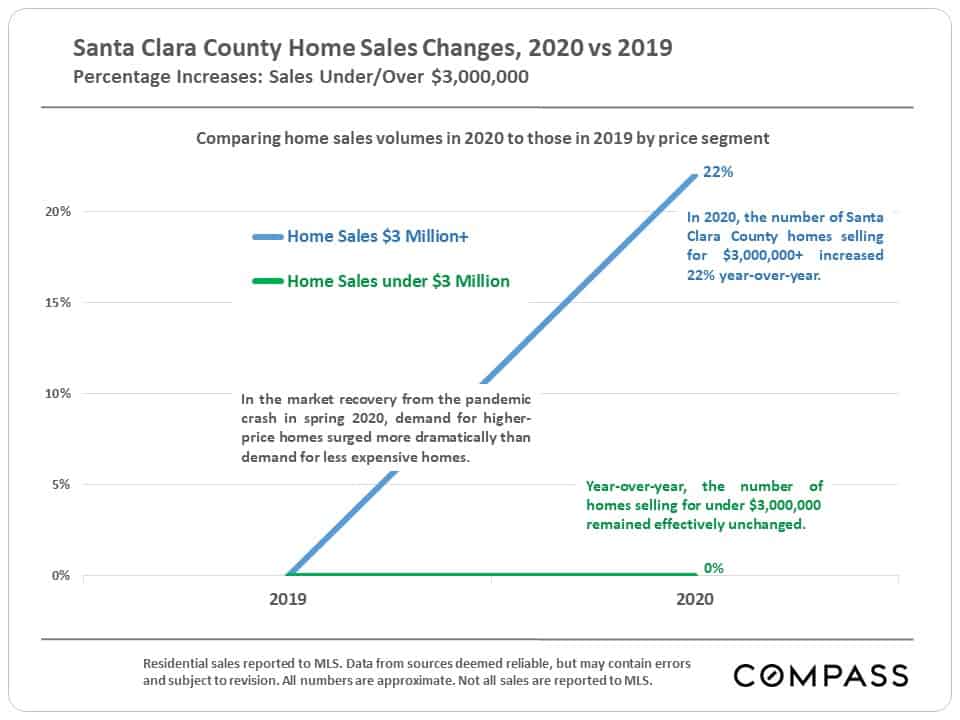
Year-over-year, sales of higher price homes significantly increased in 2020, while in the more affordable price segment, sales volume was flat. However, neither statistic does justice to the rapid acceleration in market activity occurring in the second half of the year.
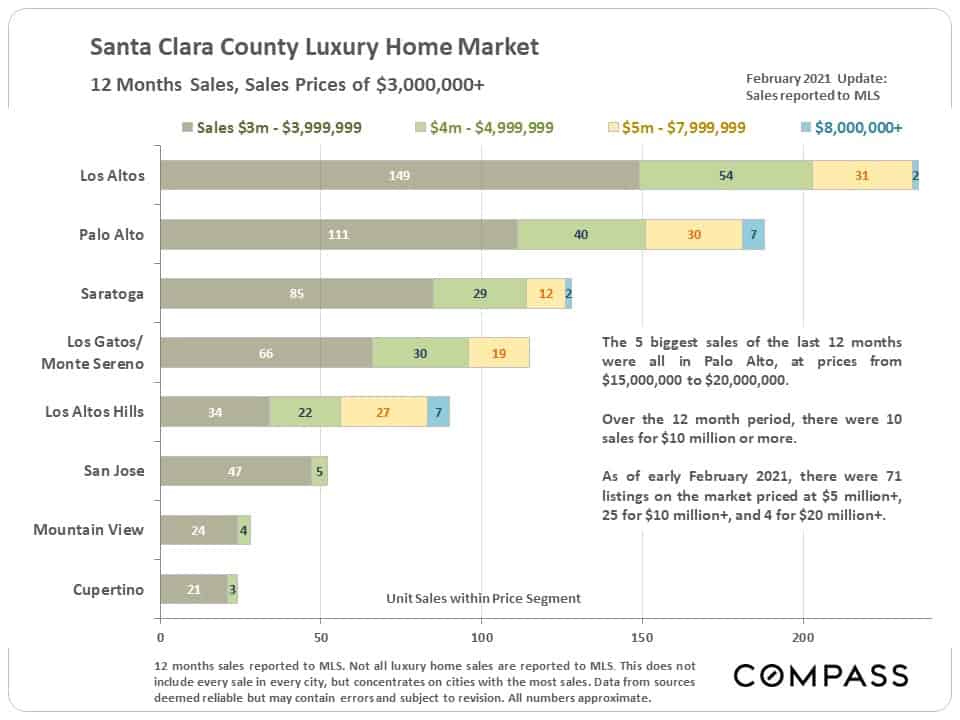
Luxury home sales by city and price segment:
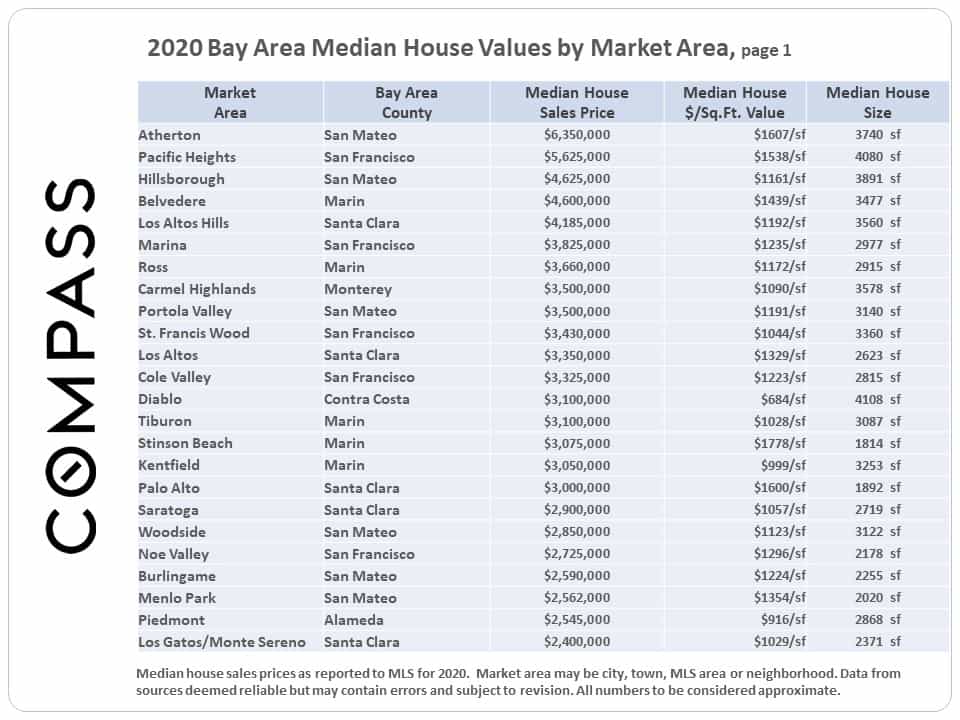
Below is the first table of a full-year 2020 home value analysis of markets around the Bay Area, ranked by median sales price, highest to lowest. The peninsula has a large footprint at the top of the list. The full report and home price map are here: Bay Area 2020 Home Prices.
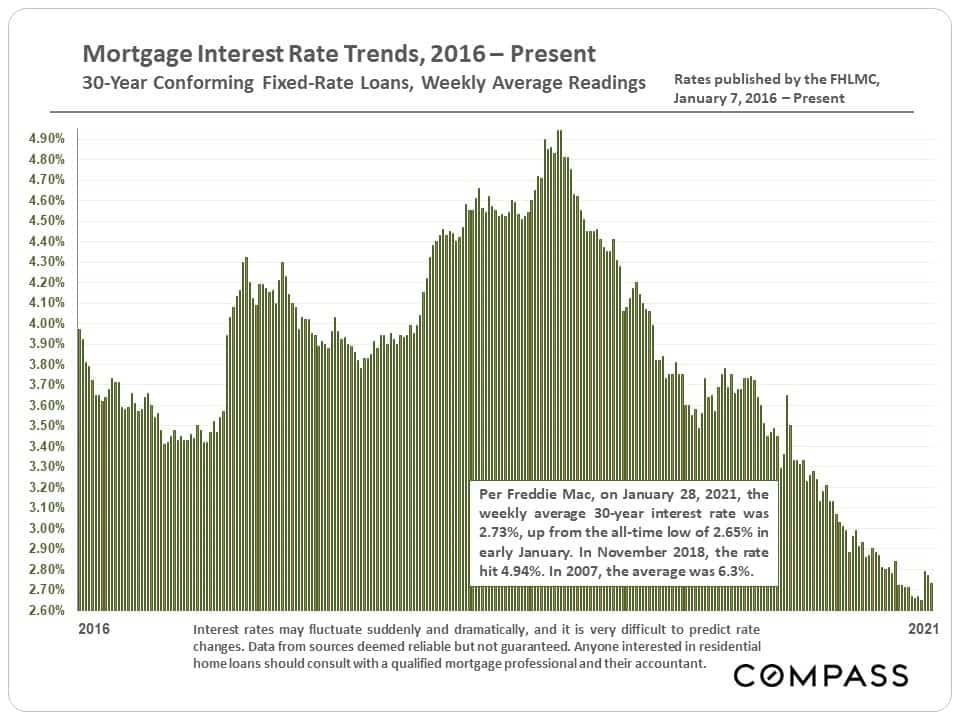
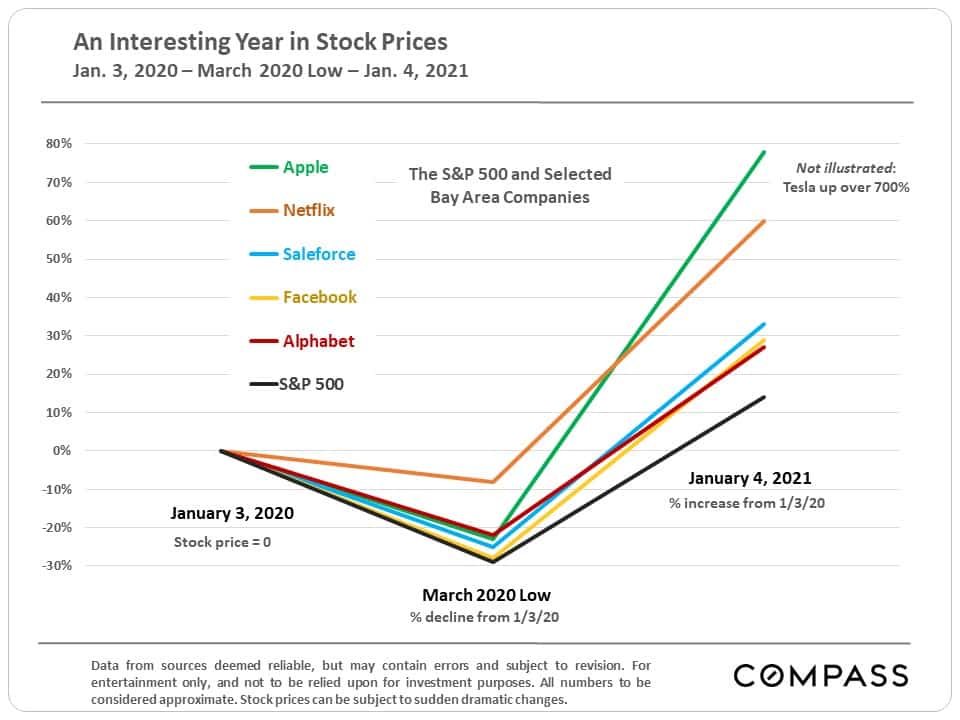
Two of the factors behind the housing market recovery were the dramatic drop in interest rates, and the significant rebound in the stock market – especially of some of our local high-tech giants.