San Francisco October Real Estate Market Report 2020
The San Francisco Real Estate Market
7 Months after the Pandemic Struck
October 2020 Report
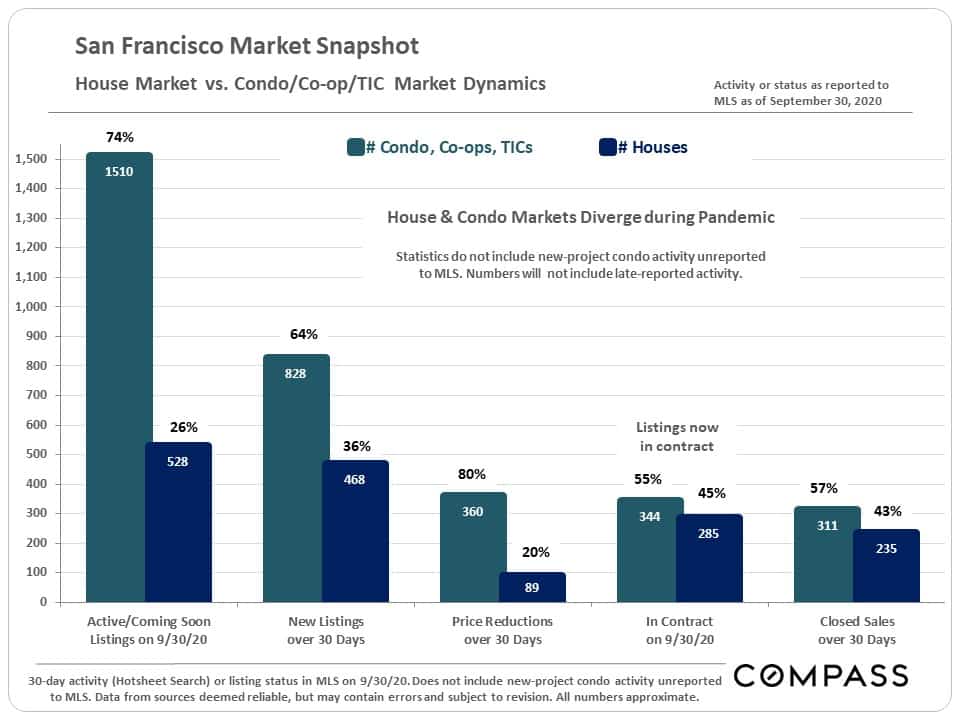
The table below compares Q3 statistics across 5 years. Since the dynamics of the SF house and condo markets have significantly diverged since the pandemic struck – the condo market has been weaker – we broke some of the 2020 stats out separately in the table, and then in some of the charts following.
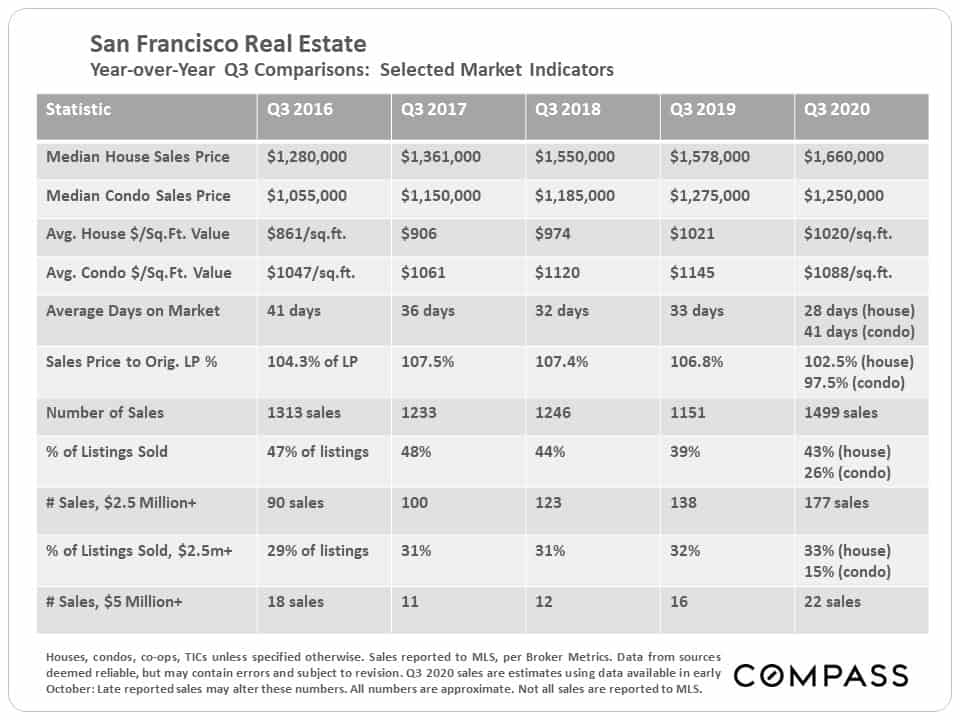
The inventory of condo listings on the market has been soaring, and price reductions are heavily concentrated in the condo market. Hundreds are still selling each month and that number has been rebounding in the last couple months – but increases in supply continue to outpace demand. Within the condo market, the high-rise segment appears to be the weakest, almost certainly due to pandemic-related reasons.
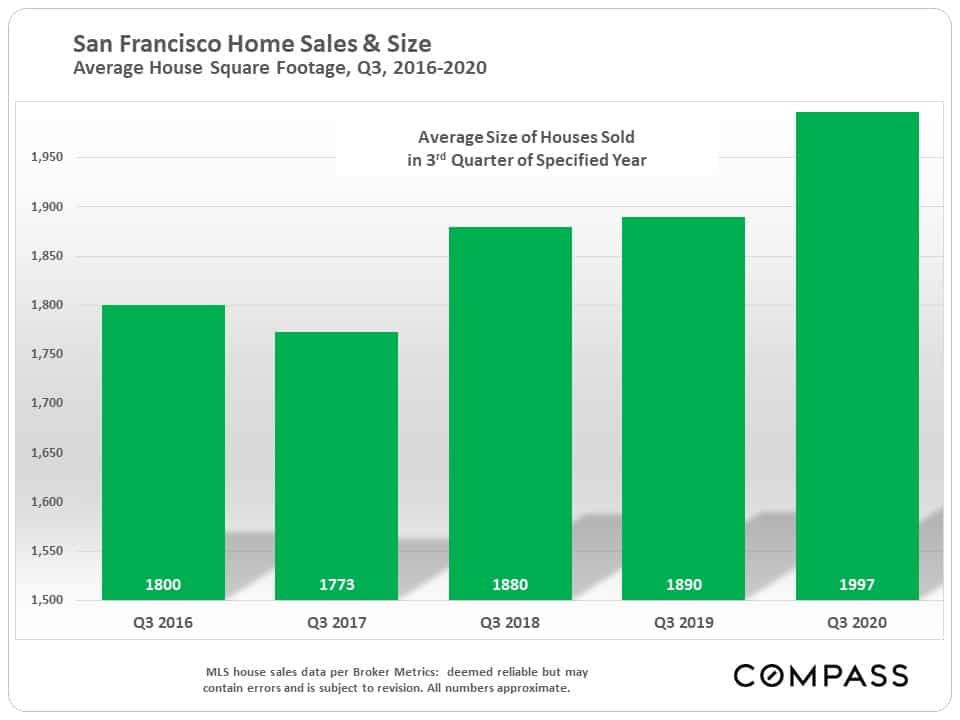
Median sales prices can rise because of increases in fair market value – i.e. buyers are paying more money for the same home (supply and demand) – and/or because buyers are purchasing larger or more expensive houses. Affluent and very affluent buyers are an increasing percentage of the total market throughout the Bay Area. In San Francisco, the average size of houses sold in Q3 jumped almost 6% year over year.
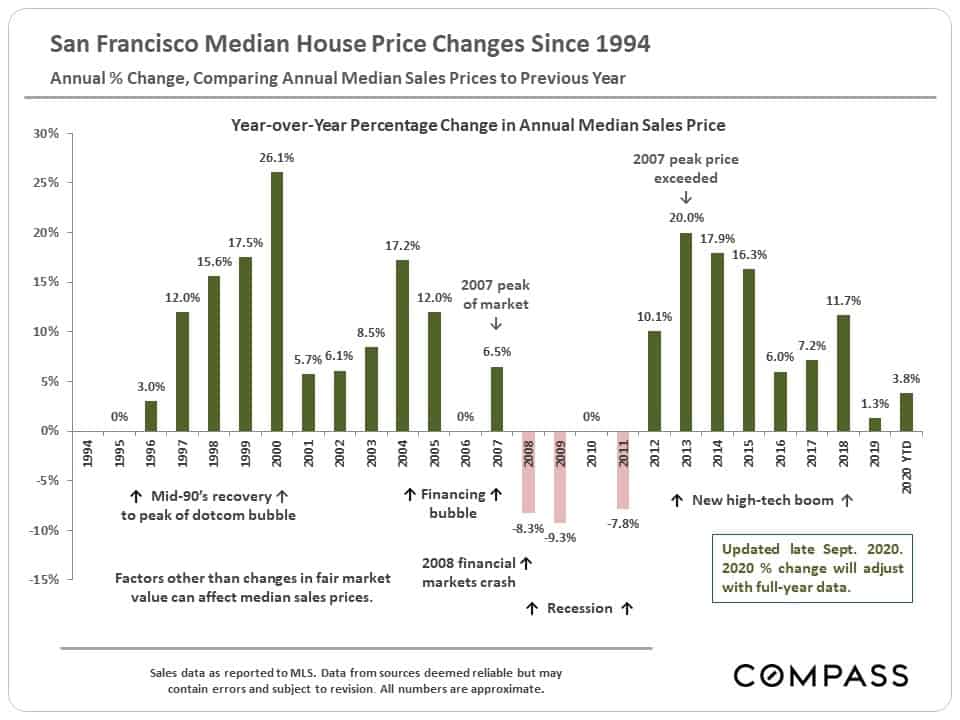
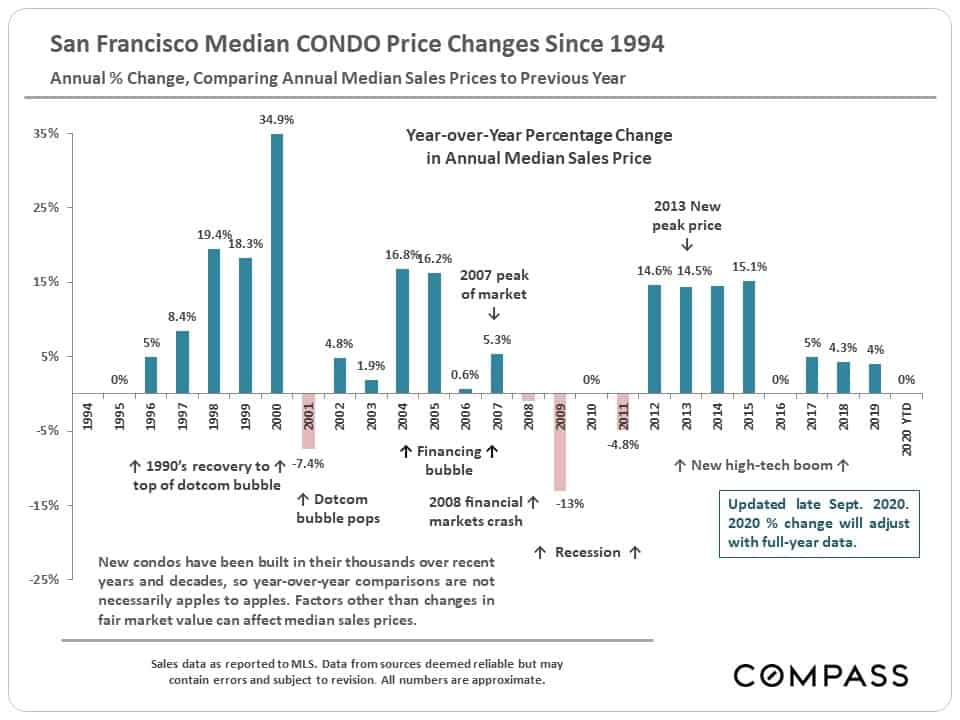
Long-Term Trends in Median Sales Prices
through YTD 2020
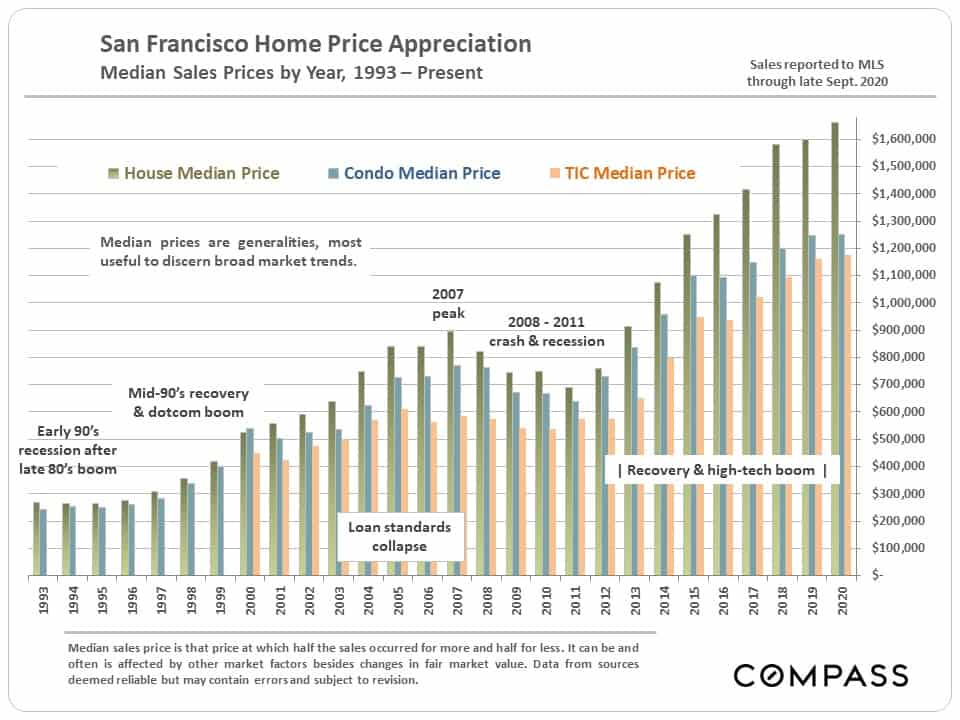
Annual Percentage Changes in Median Sales Prices through YTD 2020
We have been getting many questions on annual percentages up and down in median sales prices, so we updated the following 2 charts. The 2020 YTD percentage will almost certainly change, one way or another, by the time full-year sales data is in.
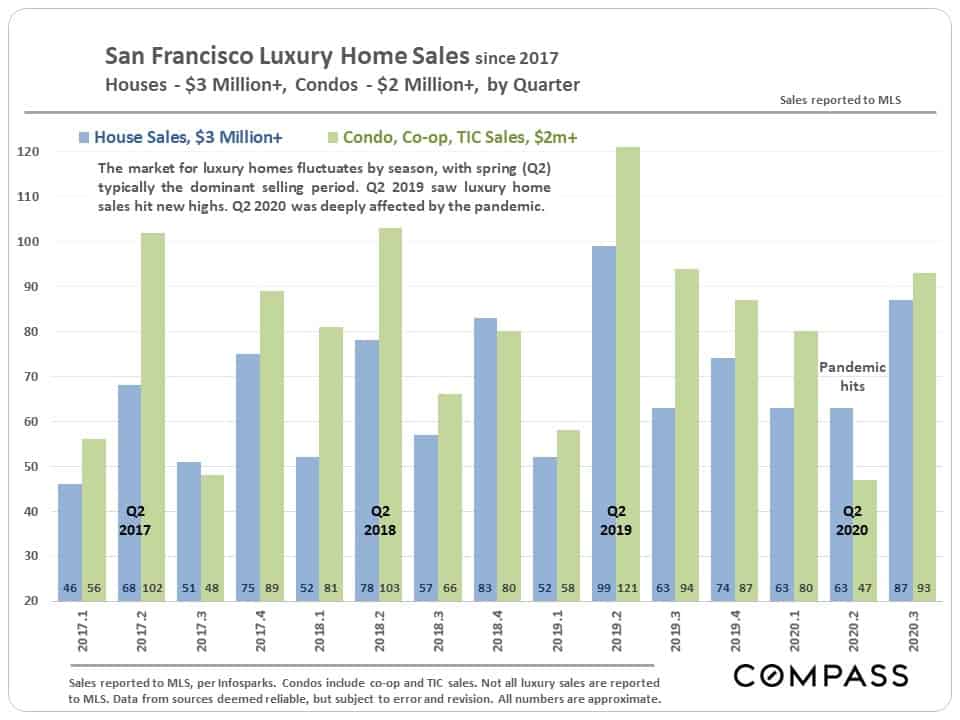
Luxury Home Sales by Quarter
Q2 is typically the strongest selling season for luxury homes, but the pandemic changed that dynamic in 2020. Though the SF luxury segment recovered in Q3, in many other counties around the Bay, luxury home sales have soared to all-time highs.
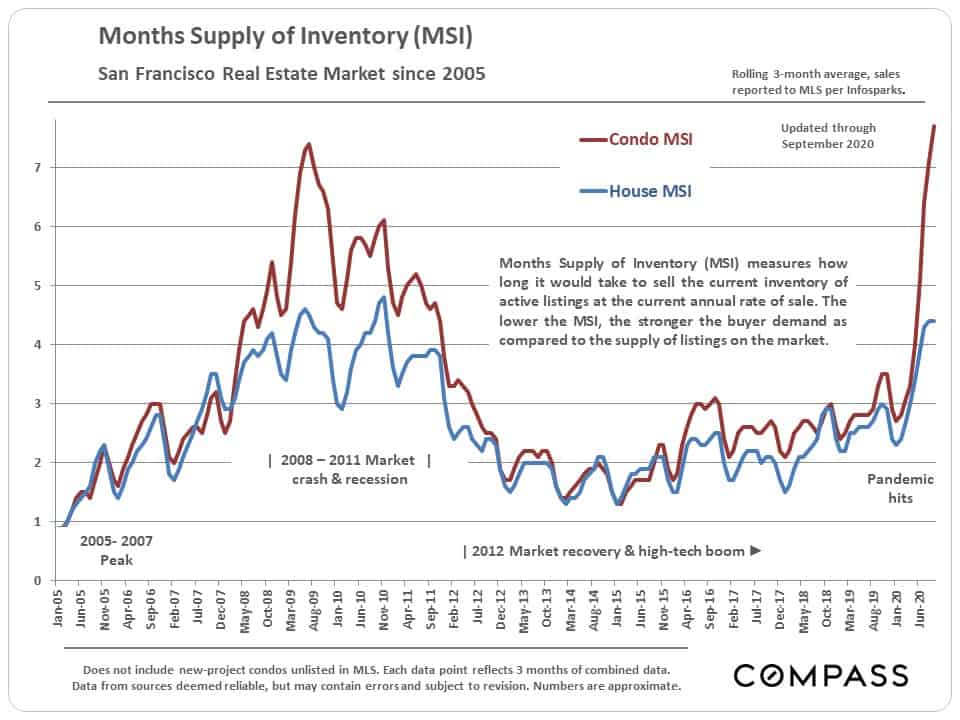
Active inventory has been surging in recent months (first chart below), as has the months supply of inventory (second chart). As mentioned before, the supply of condos for sale is currently dominating SF inventory.
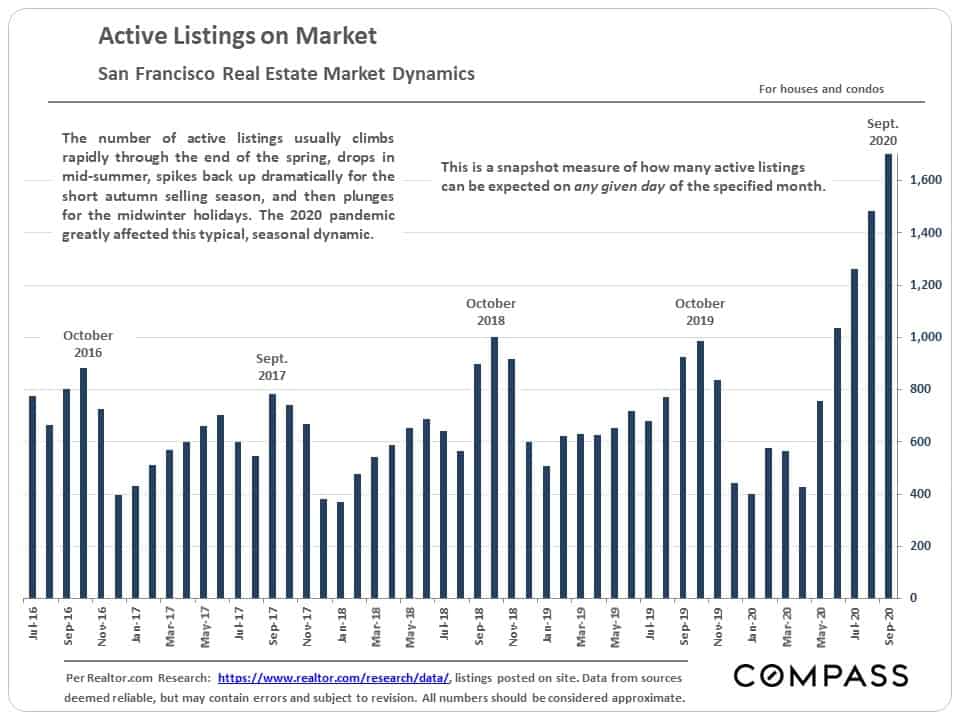
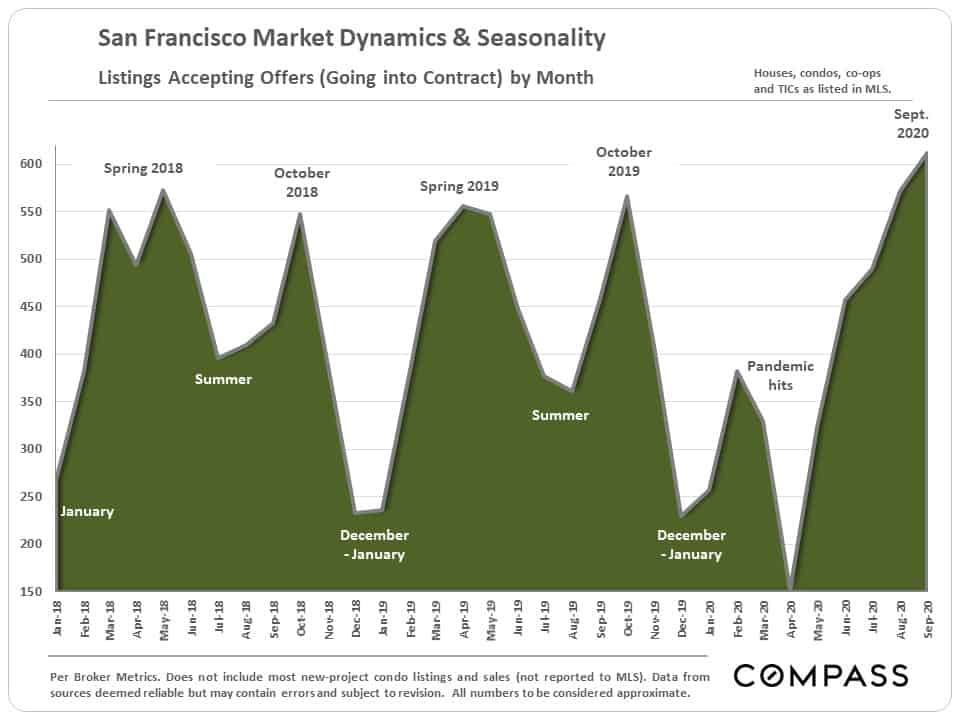
Even if supply is outpacing demand, more listings went into contract in September than in any month in the last 2 years.
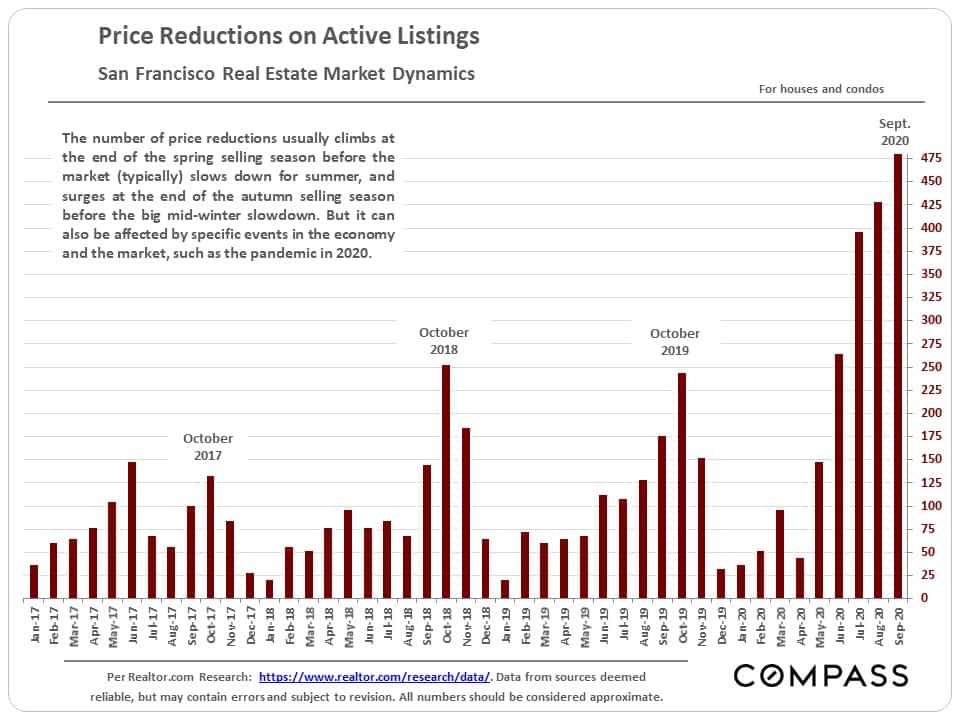
But the number of price reductions – again heavily concentrated in the condo market – has jumped to its highest point in many years. In certain segments, sellers are now competing for buyers, instead of buyers competing for listings.
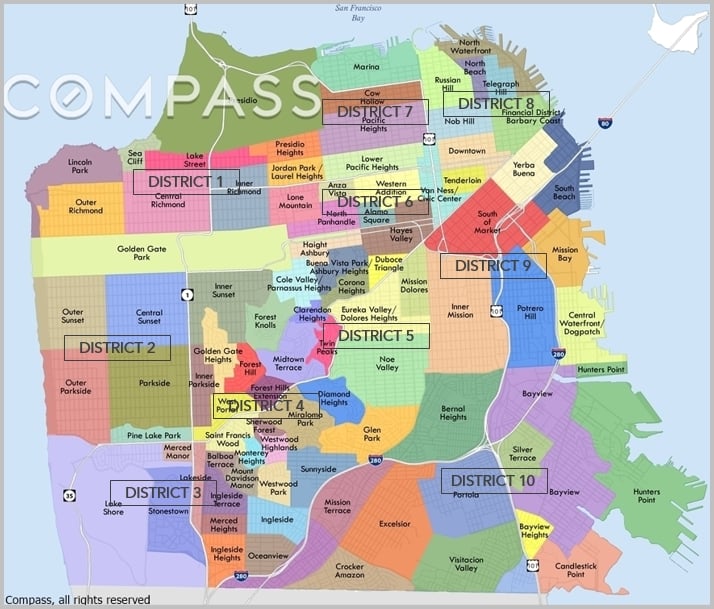
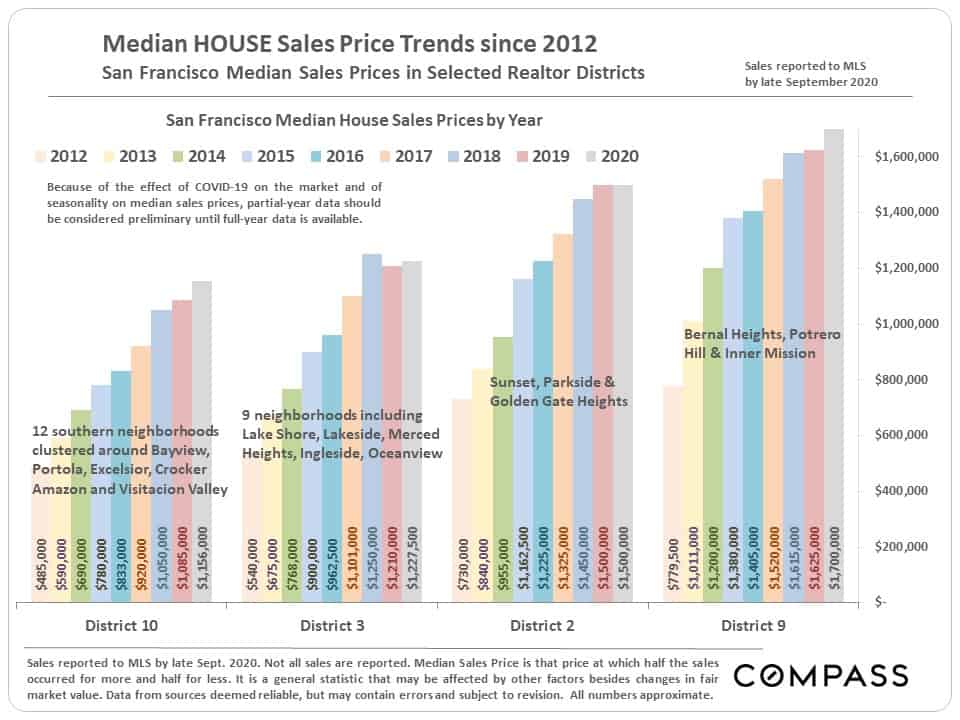
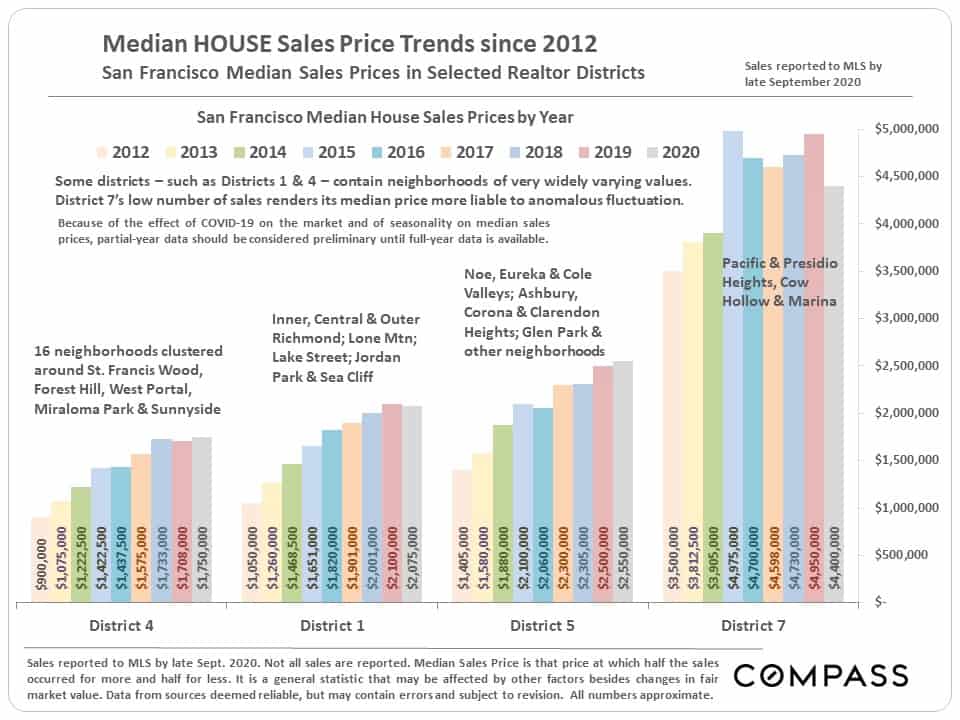
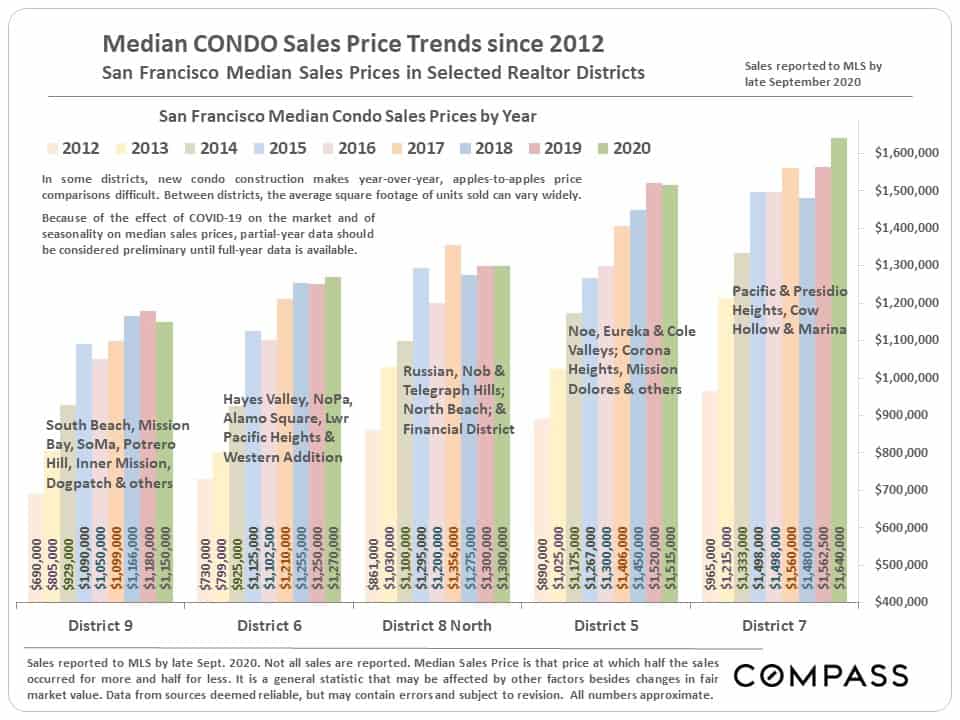
Median House & Condo Sales Price Trends by District
The 3 charts below are focused on the districts in which the greatest number of house or condo sales occur. The first 2 refer to house sales and the third to condo sales.
In September, we also updated our semi-annual Survey of Bay Area markets.