San Francisco February Real Estate Market Report

Heading into the 2019 Market
February 2019 Report
As of early February, the government shutdown is over – at least for a little while – the stock market has recovered dramatically from its late 2018 plunge, and interest rates are well down from November highs. A good number of large, local, high-tech “unicorns” continue to plan IPOs in 2019. All these are positive economic indicators for the Bay Area real estate market – but indicators have proven to be quite volatile over the past 5 months and future movements are not to be taken for granted.
As detailed in our last report, there was considerable cooling in the market in the second half of 2018. The month of January typically has the fewest sales of the year, sales which mostly reflect activity during the December market doldrums: We don’t consider its data to be a reliable indicator of conditions or trends. But activity is picking up, and the beginning of the spring sales season – which in the Bay Area can start as early as February – will soon provide more direction as to where the market is heading.
San Francisco Home Value Trends
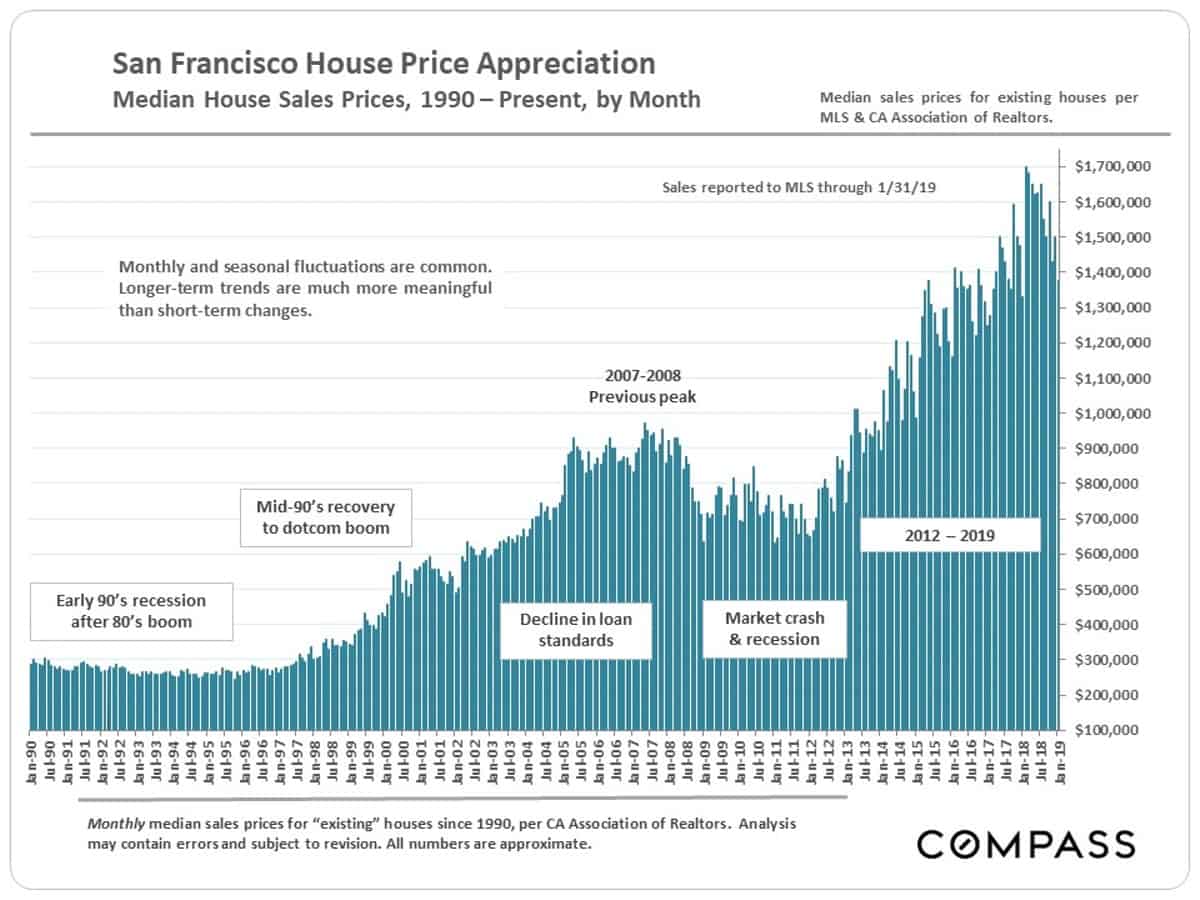
Median House Sales Prices by Month since 1990
Median sales prices often fluctuate by month and by season. It is not unusual for them to spike to new peaks during the spring selling season, and then decline and/or plateau afterward (until the next spring). So, the question is: What’s going to happen in spring 2019?
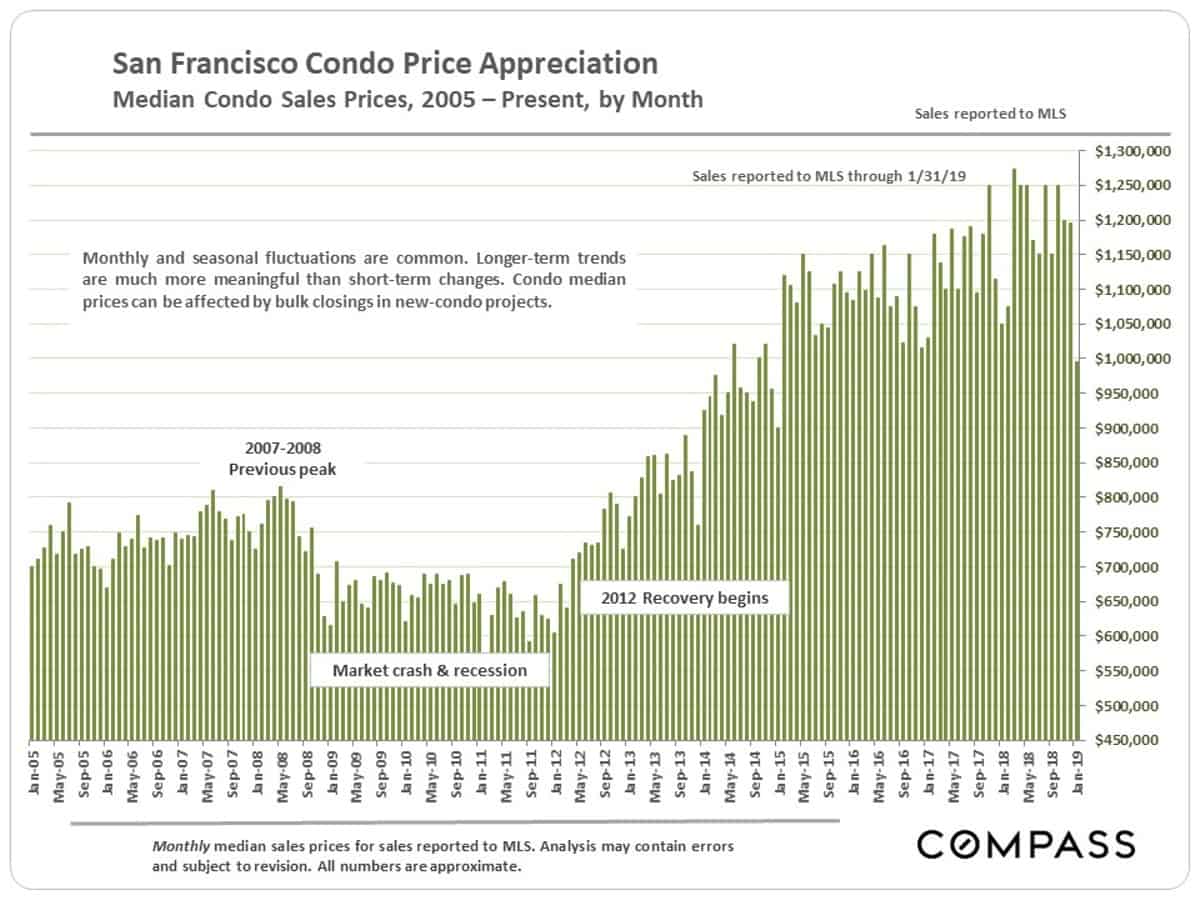
Median Condo Sales Prices by Month since 2005
Median condo sales prices, especially on a monthly basis, can be confused by new-project condo sales reported to MLS, which sometimes occur in quantity in a single month. Monthly fluctuations are common, and it is always the longer term trend that is most meaningful.
Home Sales Breakdowns
Since the market recovery began in 2012, home sales at prices under $1 million have dropped by 68%. This chart shows the migration of sales to higher price segments.
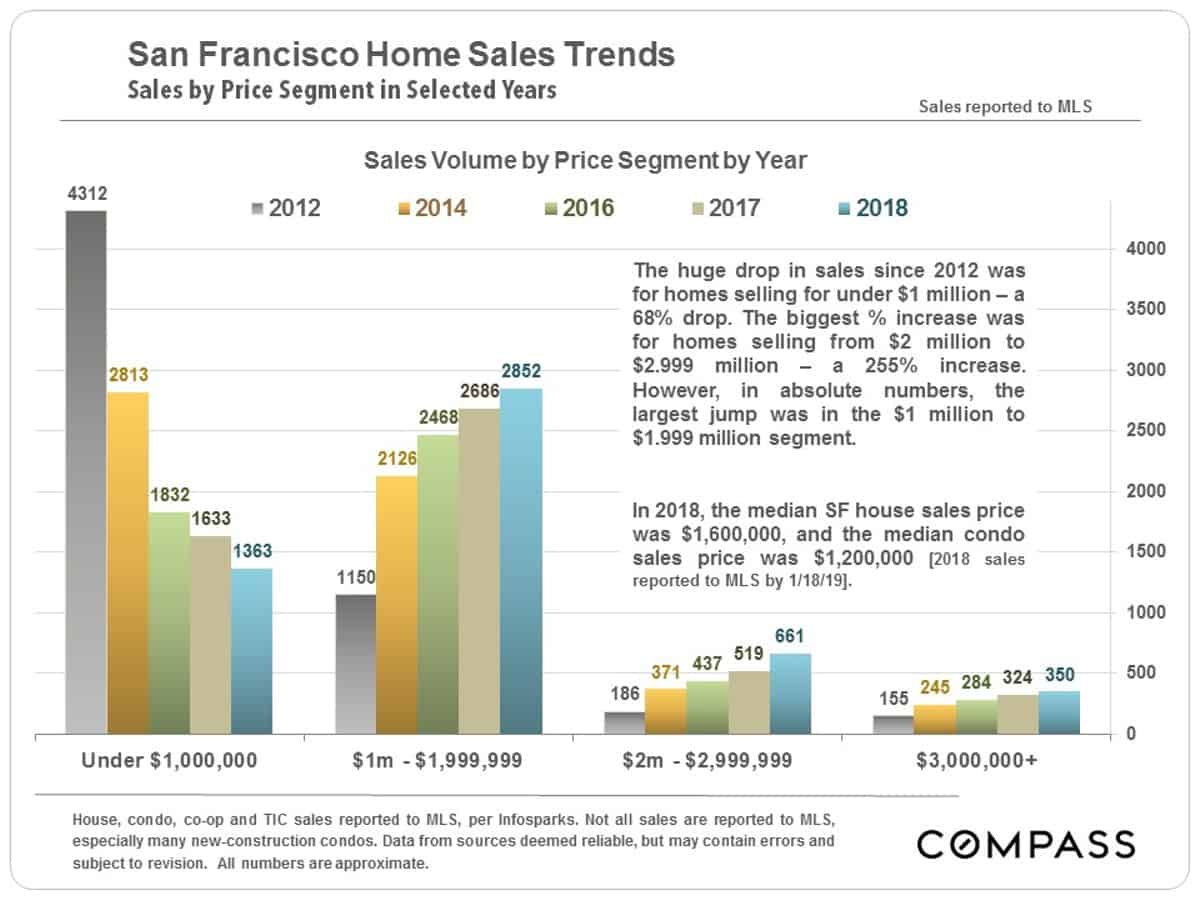
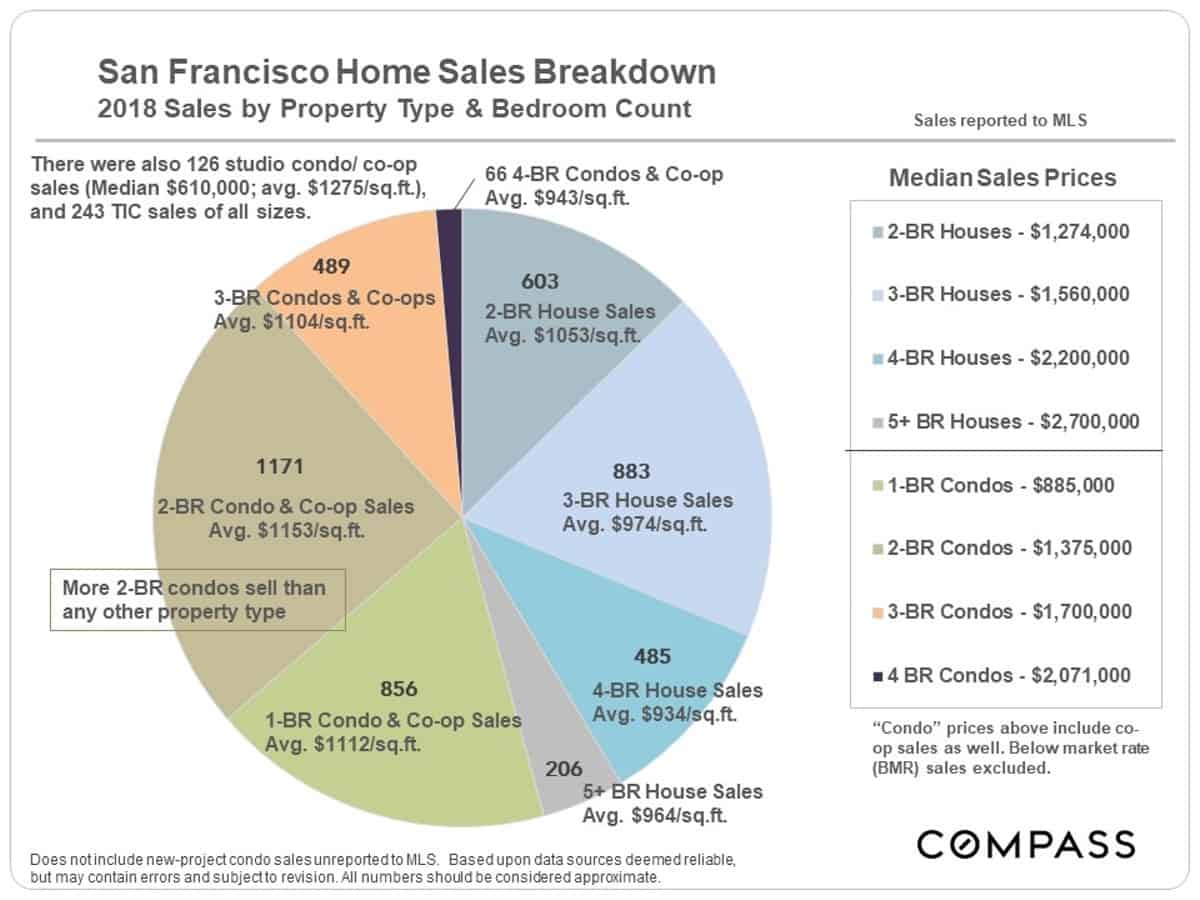
Condos sales in San Francisco significantly outnumber house sales, and this trend will continue with the ongoing construction of new-condo projects. The most common property type for sales in the city was the 2-bedroom condo at a 2018 median sales price of $1,375,000. The dominant house sale was of 3 bedrooms at a median sales price of $1,560,000.
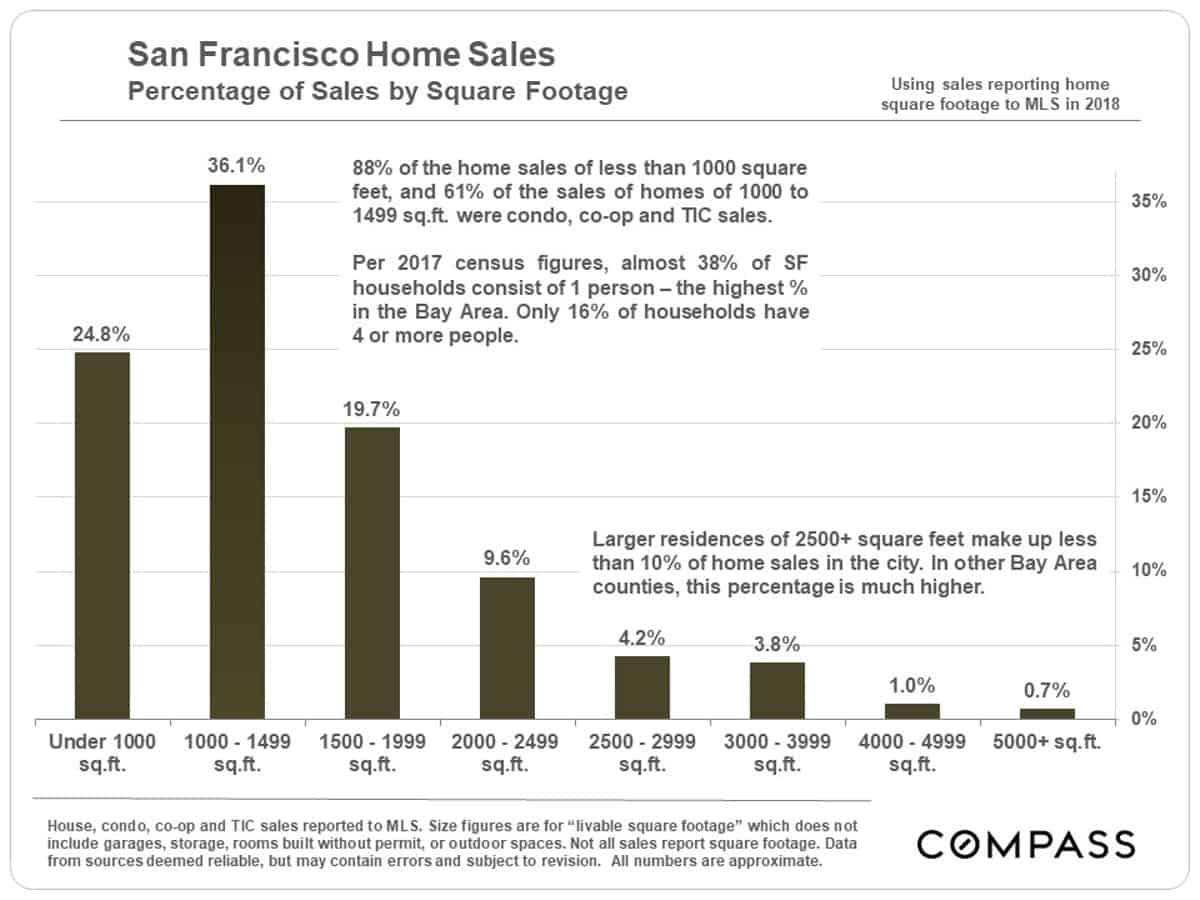
Compared to more suburban Bay Area counties, San Francisco is a city of relatively small, older homes occupied by relatively small households: Almost half of SF housing was built before WWII, 61% of homes are of less than 1500 square feet, and, per census data, 38% of SF households consist of a single person. SF also has the lowest percentage – 4.5% – of children under the age of 5 of any major city in the country.
San Francisco Luxury Home Sales
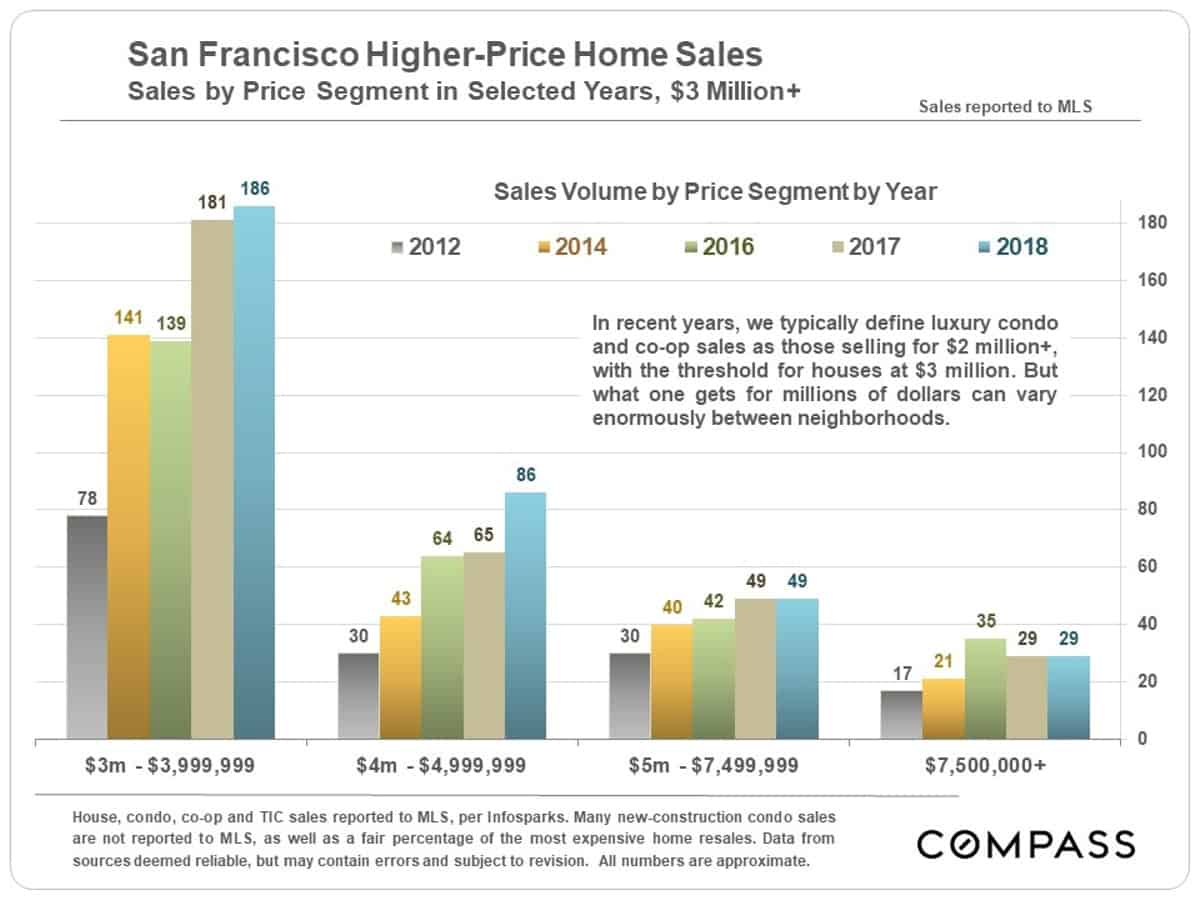
While luxury home sales from $3 million to $4.99 million have steadily increased since 2012, home sales of $5 million and above have, to a large degree, plateaued in recent years. [Sales reported to MLS]
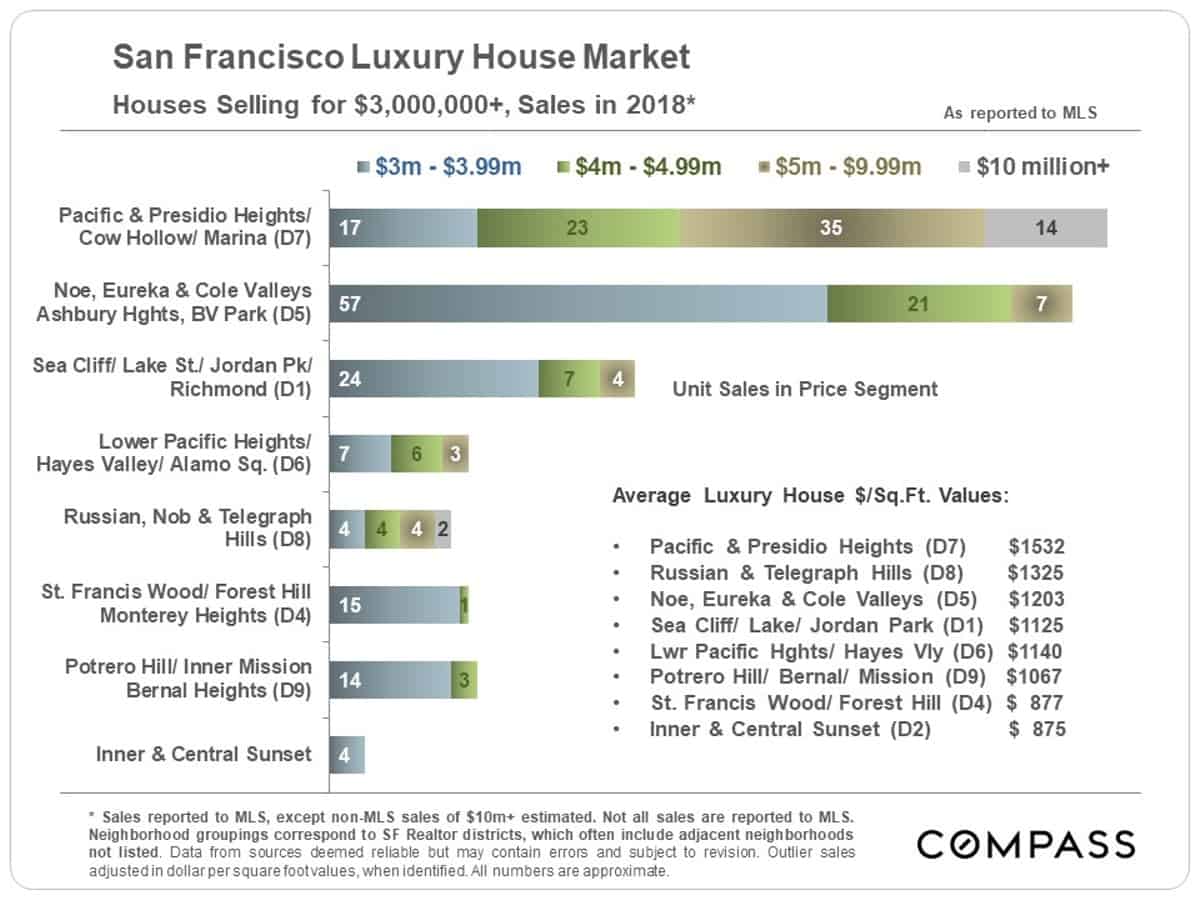
Luxury House Sales by District
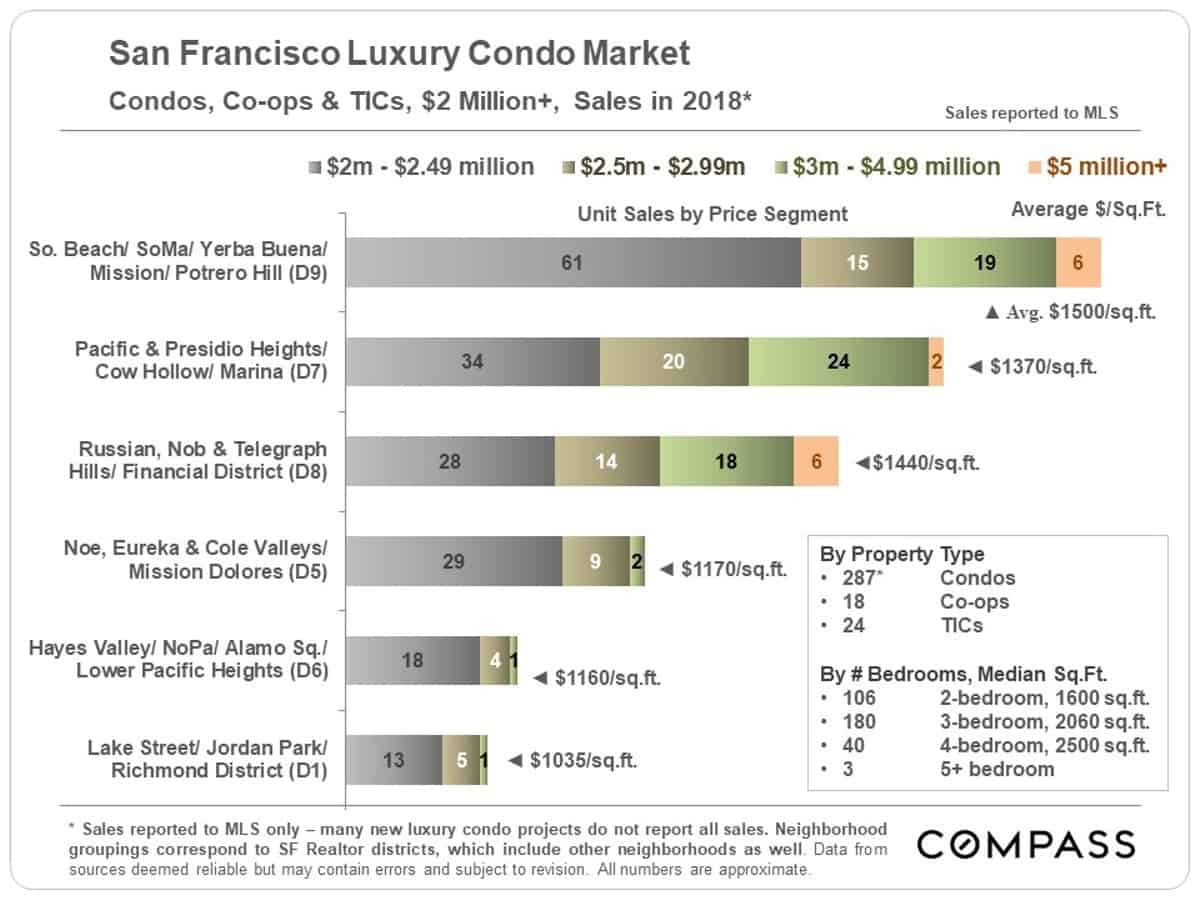
Luxury Condo, Co-op & TIC Sales by District
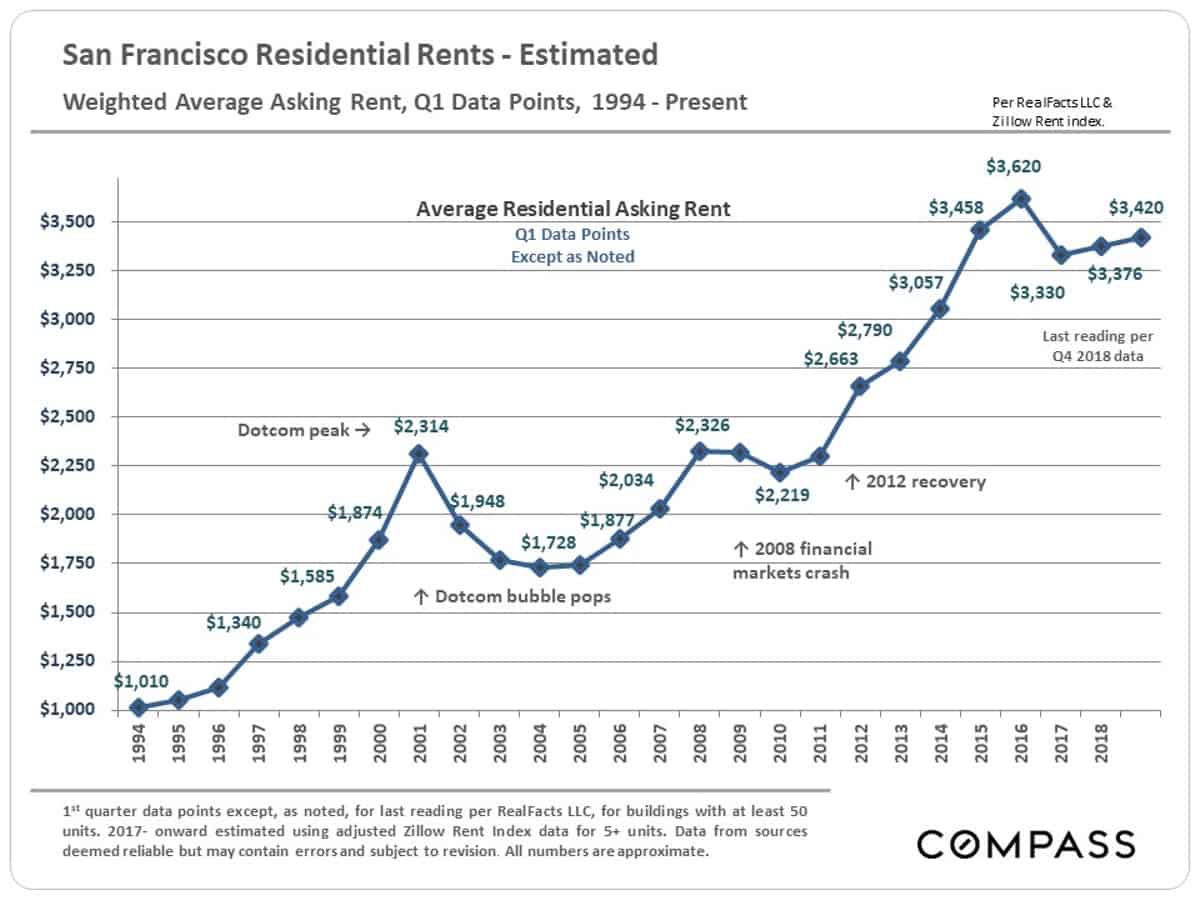
San Francisco Long-Term Rent Trends
Generally speaking, there should be a relatively close correlation between home prices and rents: They constitute the 2 main options for paying for one’s housing. It is not an apples-to-apples comparison, because there are other issues at play, such as building equity, the ability to remodel and improve, certain tax advantages (though greatly diminished under new tax laws) and so on. If home prices continue to appreciate while rents plateau or decline, it can be a warning sign of an imbalance in the market – if it extends beyond the short term.
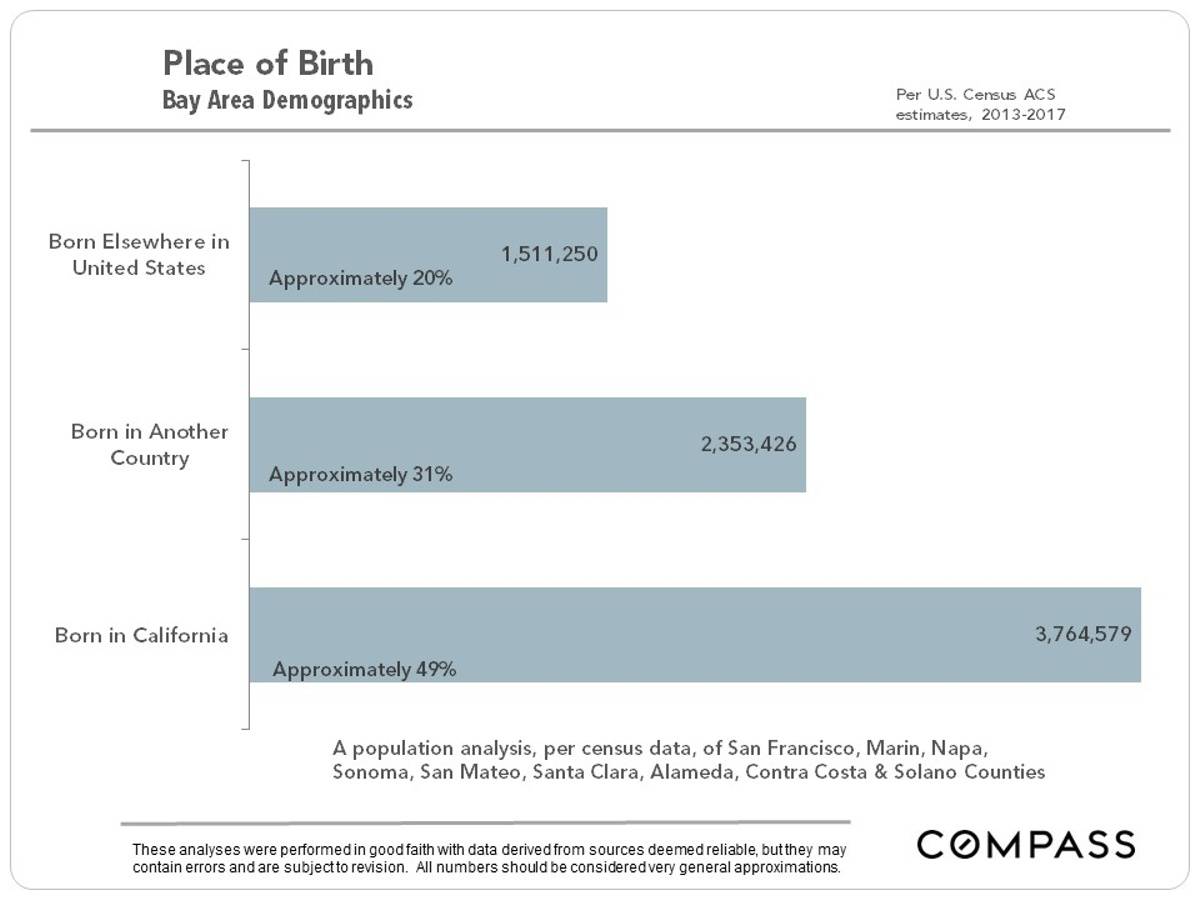
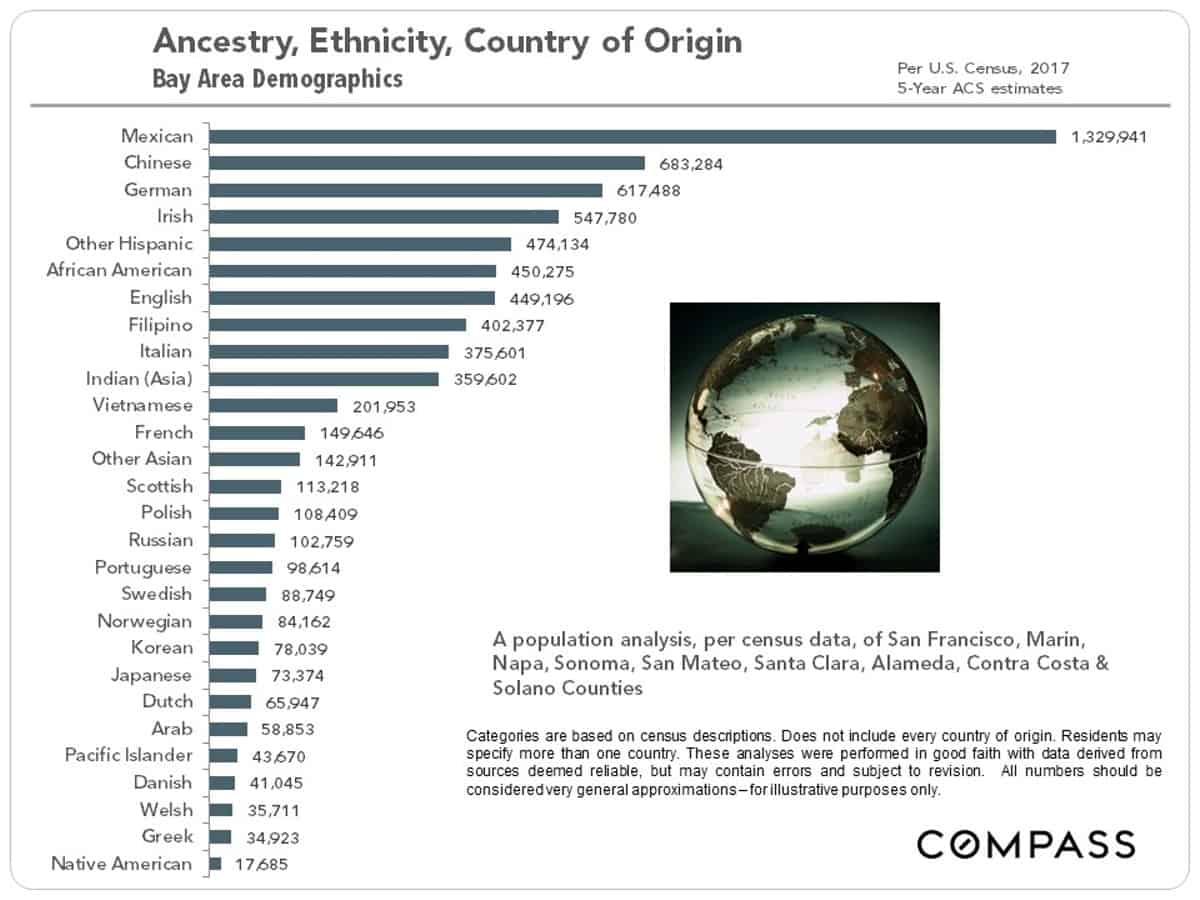
Did Someone Say Multi-Cultural?
Bay Area Demographic Snapshots
Before looking at the charts below, here is today’s demographics quiz question: What 4 nationalities account for the origin of the highest numbers of Bay Area residents?
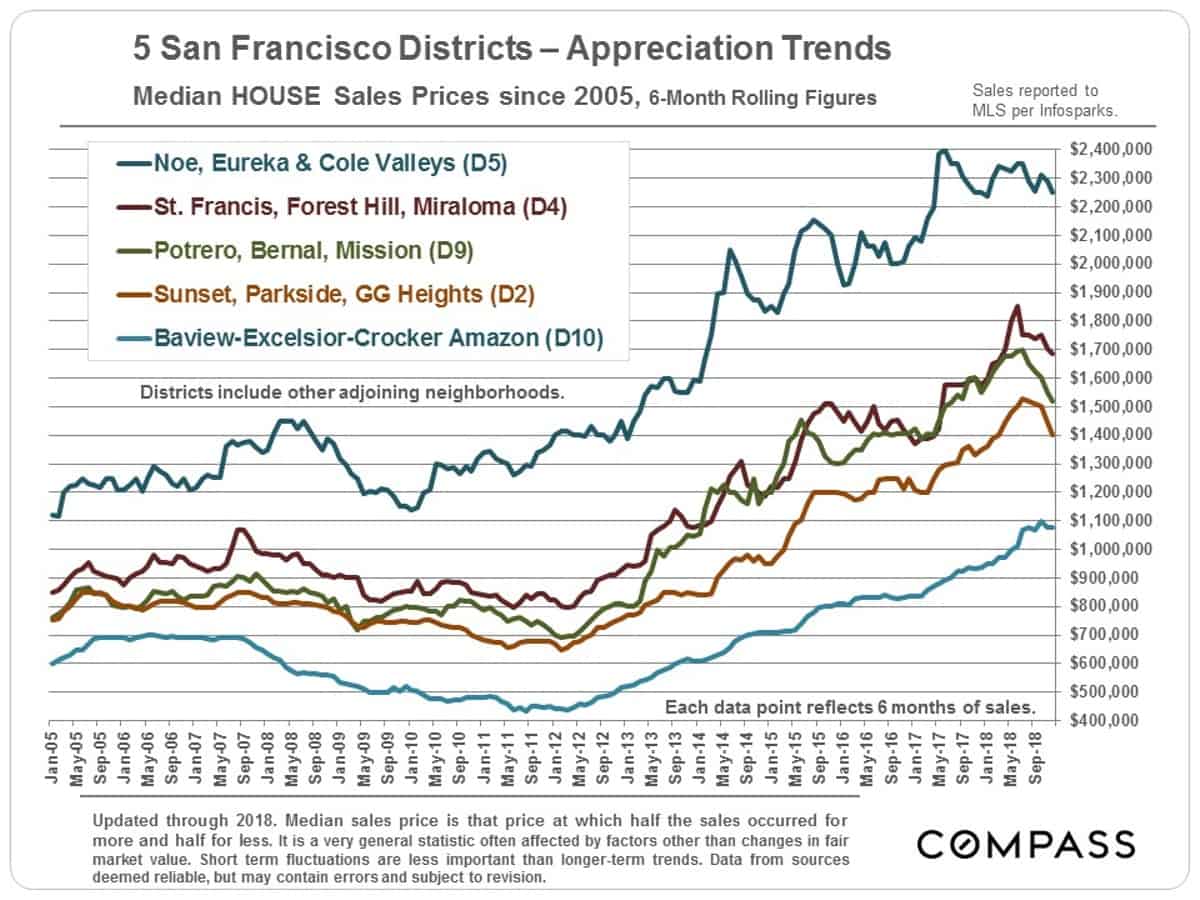
Neighborhood Appreciation Trends
– Selected Districts
There are 70-odd SF neighborhoods in 10 Realtor districts, so we can’t cover all of them here – but if you would like information on one not included, please let us know. We track prices and trends in all of them.
Realtor District 7 is the most expensive house district in SF – consisting of Pacific & Presidio Heights, Cow Hollow & Marina – but we didn’t include it on the first chart, because its median house sales price is so much higher – over $4.7 million in 2018 – that the trend lines of the other districts would be flattened.
Median House Sales Price Trends
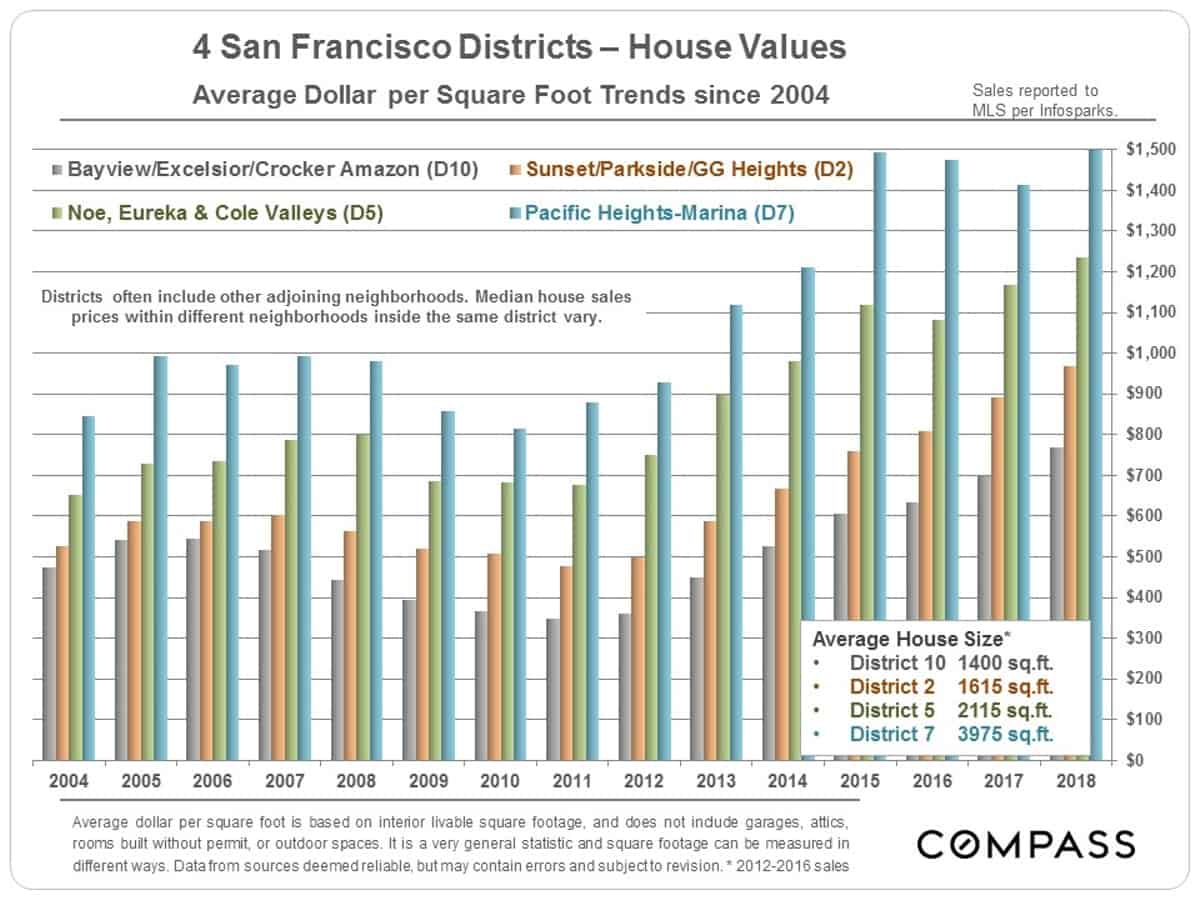
Average House Dollar per Square Foot Trends
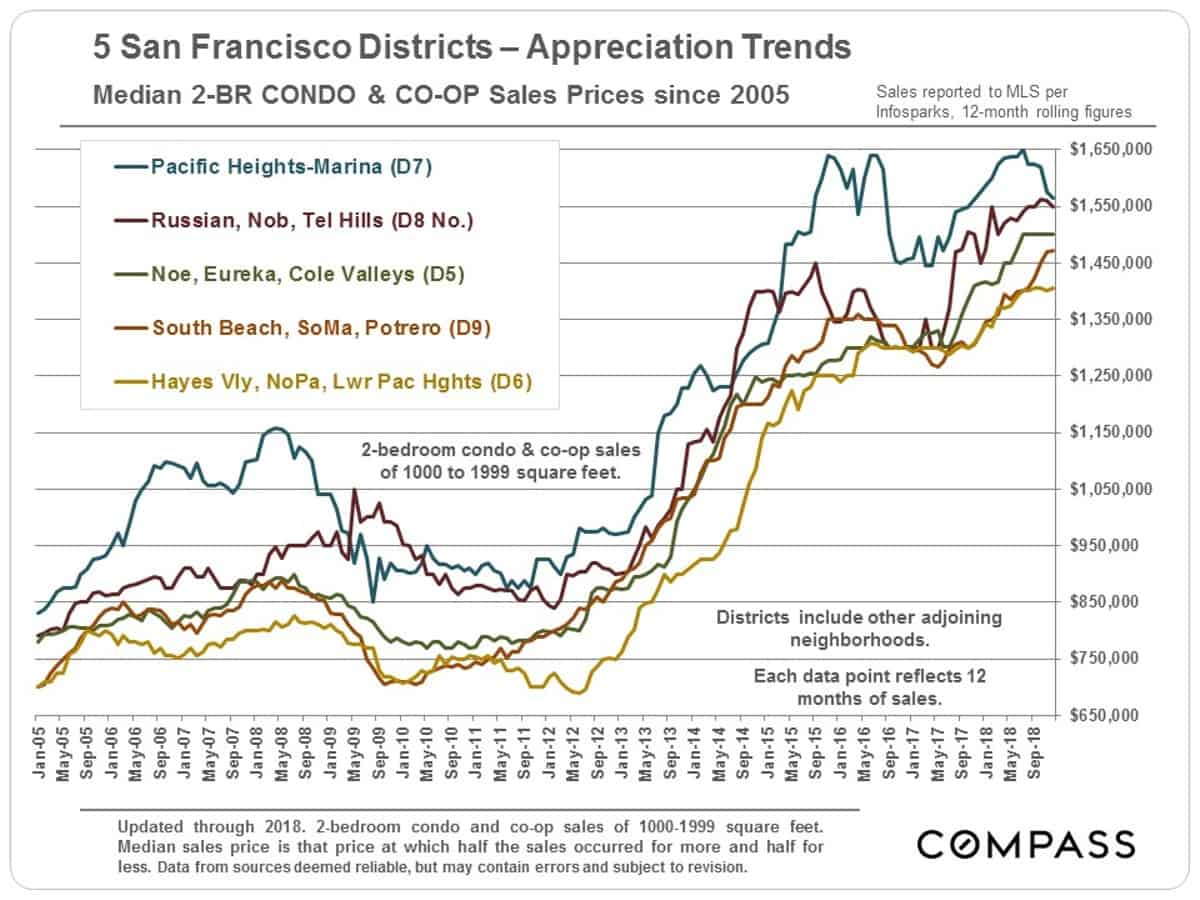
Median 2-Bedroom Condo Sale Price Trends
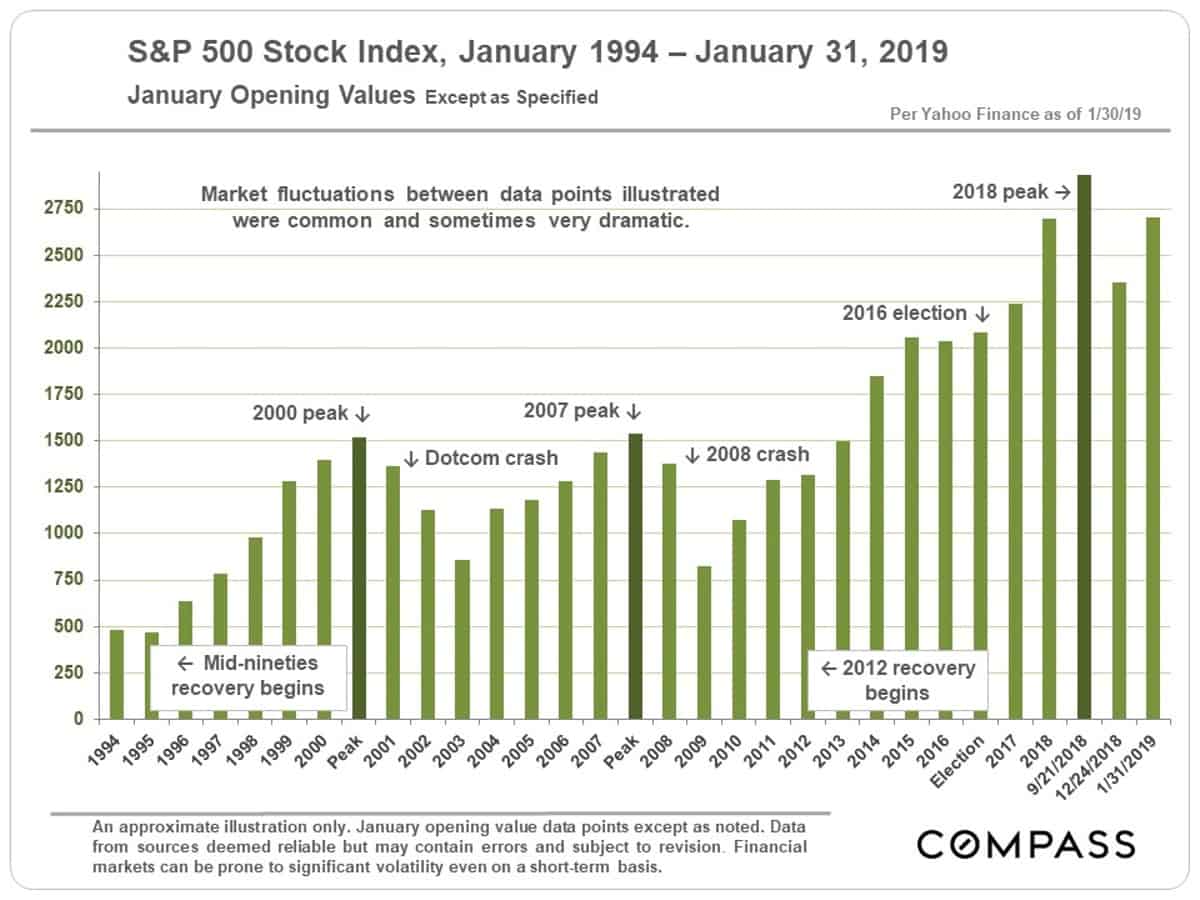
Stock Prices & Interest Rates
As seen in the first chart below, the changes in the S&P 500 Index have been dramatic since the 2016 election, seeing an enormous jump to its most recent peak in September 2018 before entering a period of substantial volatility. Ups and downs and major volatility in financial markets – and their effects on household wealth – can play a large role in local real estate markets, especially in the higher price segments.
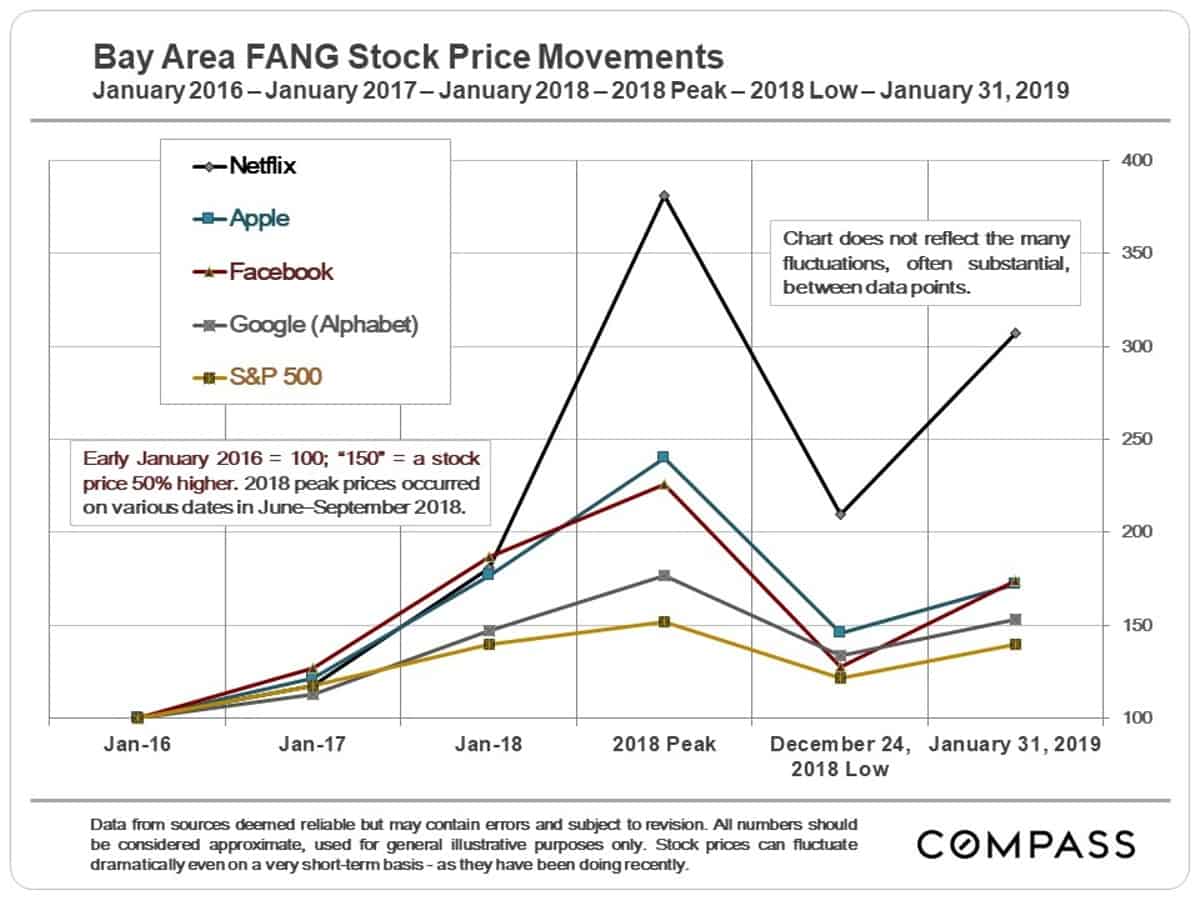
As illustrated in this next chart, the movements in the S&P 500 have been distinctly modest compared to the stock price changes of some of our local high-tech giants. It has been has been a wild, queasy ride for investors and stock-owning employees – and for many home buyers.
If the big unicorn IPOs go forward as expected, and the market greets them enthusiastically, that could play a substantial role in demand as thousands of employees suddenly feel considerably more affluent.
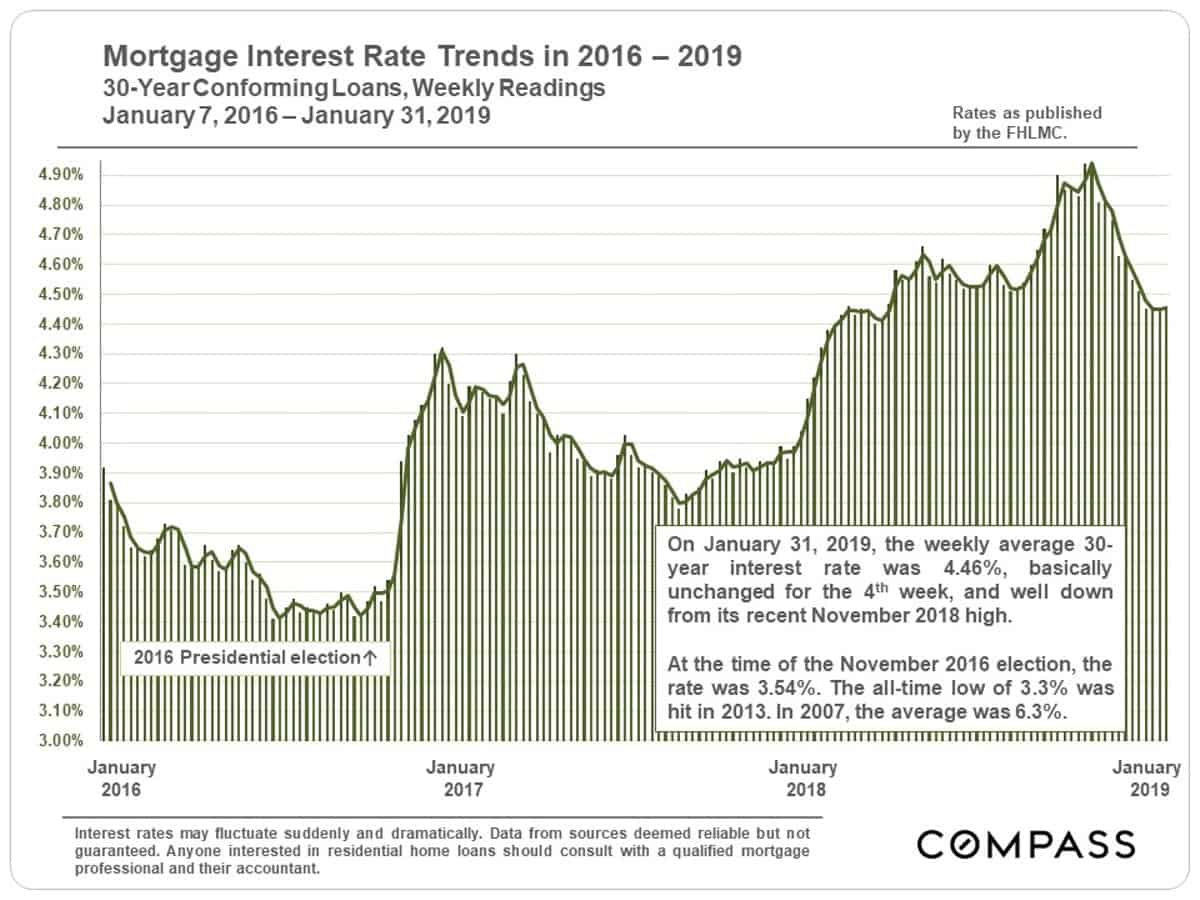
Interest rates appeared to be headed relentlessly higher, but instead dropped sharply since the latest November 2018 high point. Substantial declines in interest rates can spark renewed buyer motivation to purchase.
Market Indicators by Property Type & Price Segment
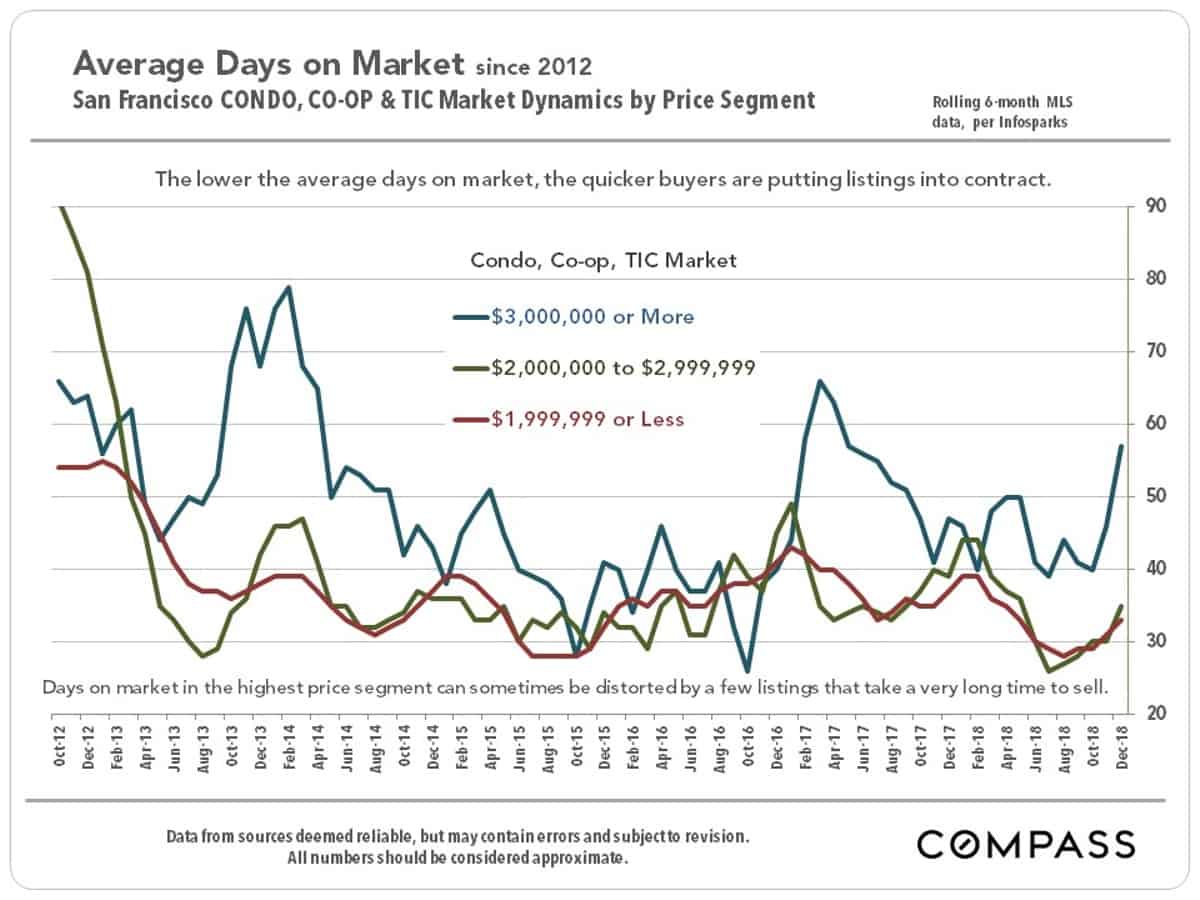
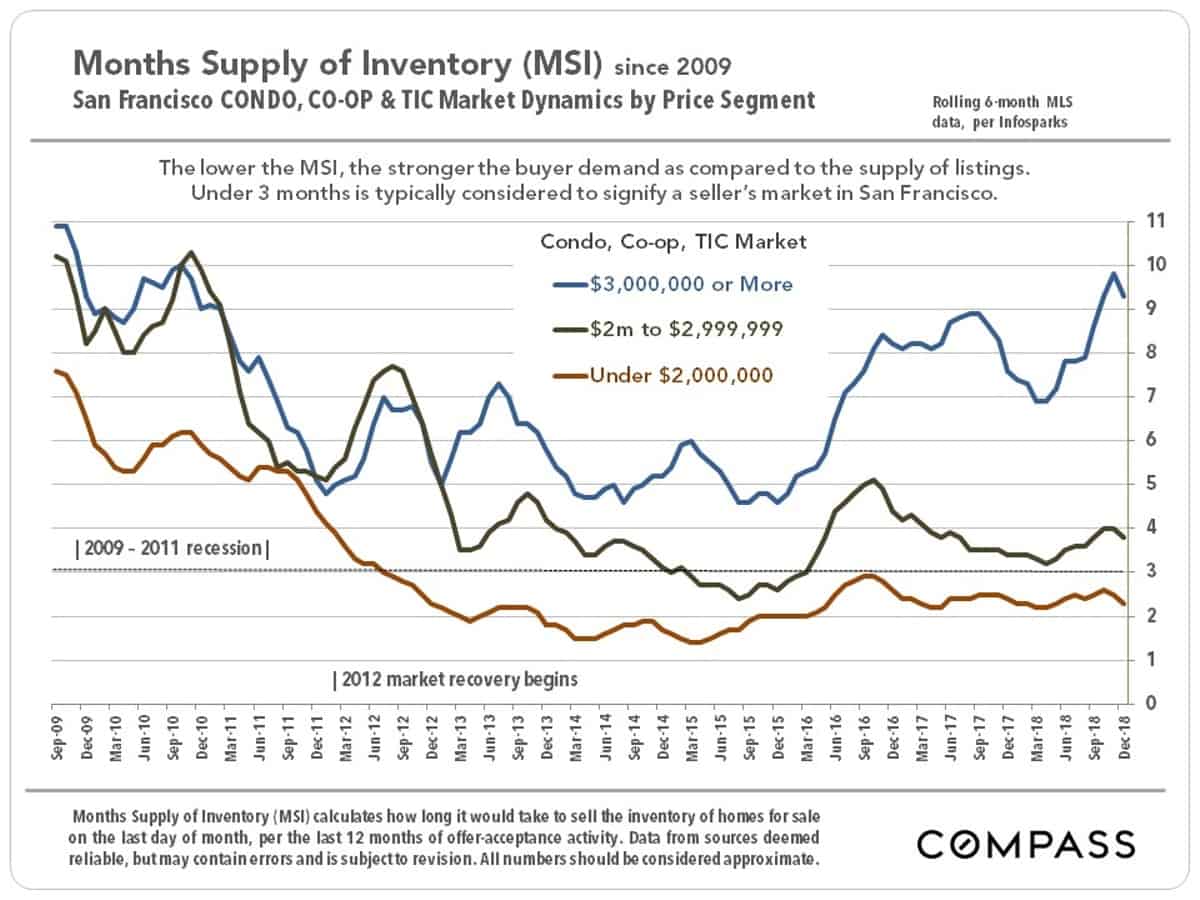
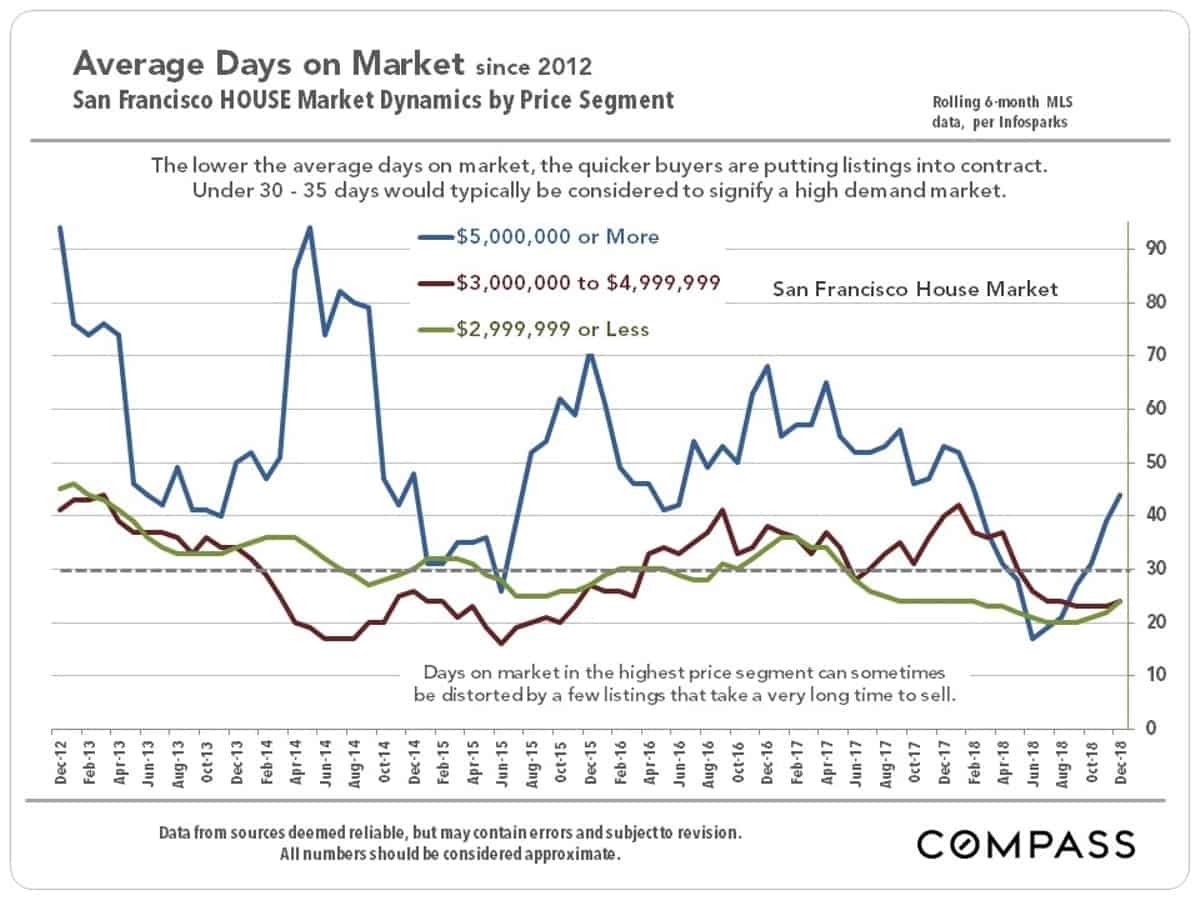
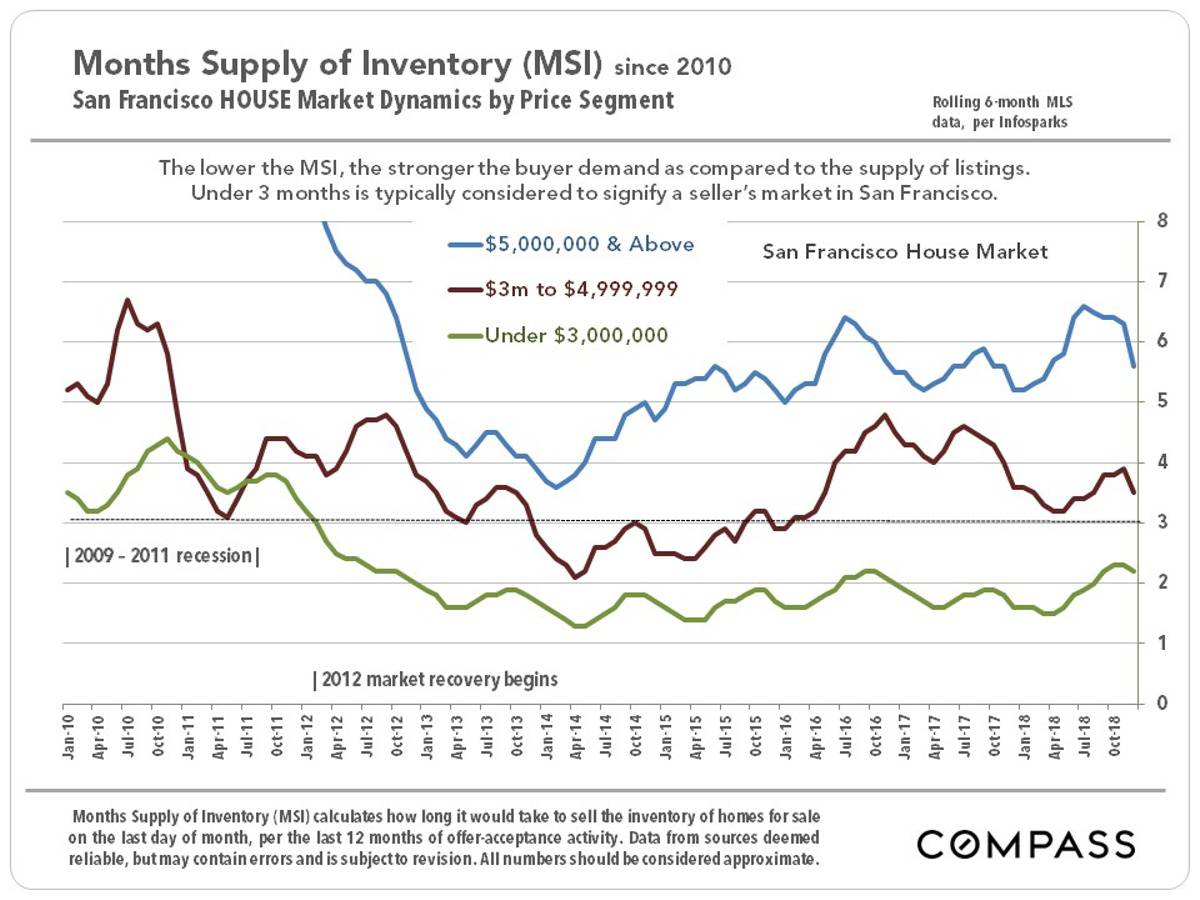
The next 4 charts divide first the house market and then the condo, co-op and TIC market by price segment, for trends in average days on market and months supply of inventory. For both of those indicators, lower readings signify stronger demand as compared to the supply of listings available to purchase. Generally speaking, demand has been stronger for houses than condos, and for lower price segments than for higher. The ultra-luxury condo and co-op market in particular – prices of $3m+ – is seeing high readings in these statistics. Certainly part of the issue is the new luxury condo projects coming on market and swelling supply.
House Market Stats by Price Segment
Condo, Co-op & TIC Market Stats by Price Segment
The ultra-luxury segment here – priced $3 million and above – is seeing distinctly higher months supply of inventory and days on market readings, reflecting appreciably softer supply and demand dynamics.