San Francisco February 2021 Real Estate Market Report

San Francisco Real Estate
Home Sales Surge at End of 2020.
High Demand Gets 2021 Off to Heated Start.
February 2021 Report
Our January report focused mostly on 2020’s annual statistics. This report will put most of its attention on quarterly and monthly indicators, which better illustrate changes occurring as 2020 progressed and 2021 began.
Of Bay Area counties, San Francisco was most negatively affected in the months immediately following the implementation of shelter-in-place. Inventory soared and sales plunged, especially in its condo market. In the second half of the year, buyers rushed back into the market.
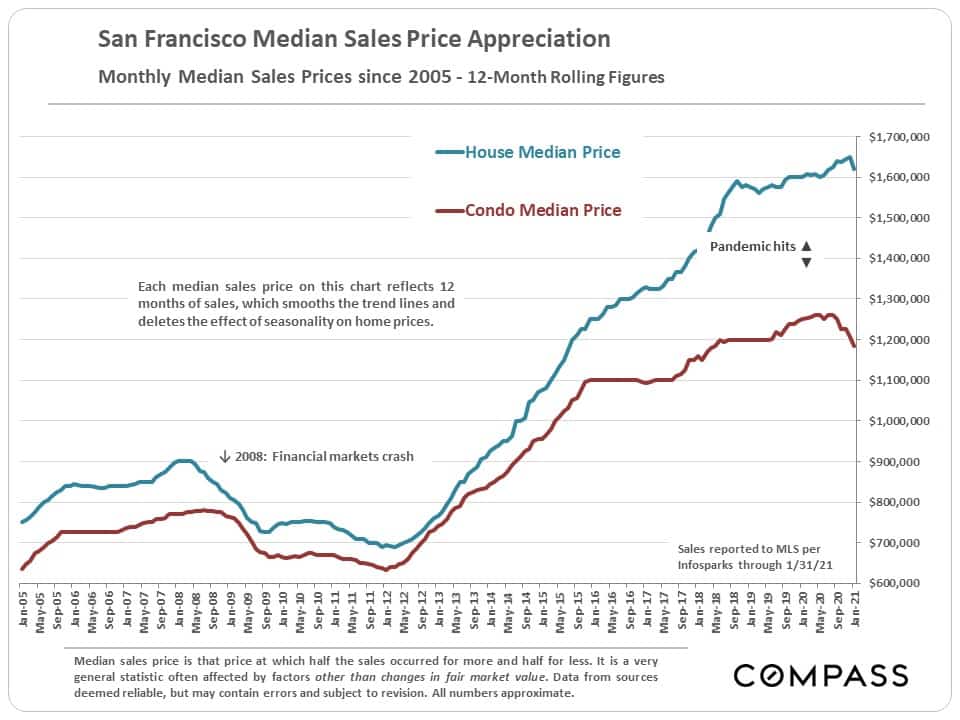
Sales volume, very unusually, peaked for the year in December, hitting its highest December number ever. Home sales in January were up 67% over January 2020, a tremendous increase. Year-over-year, house median sales prices are up a little, and condo median prices, divided by size of unit, are down about 10%.
The city remains a very complex market, varying by neighborhood, property type and price segment. And vaccines may alter the dynamics considerably in 2021.
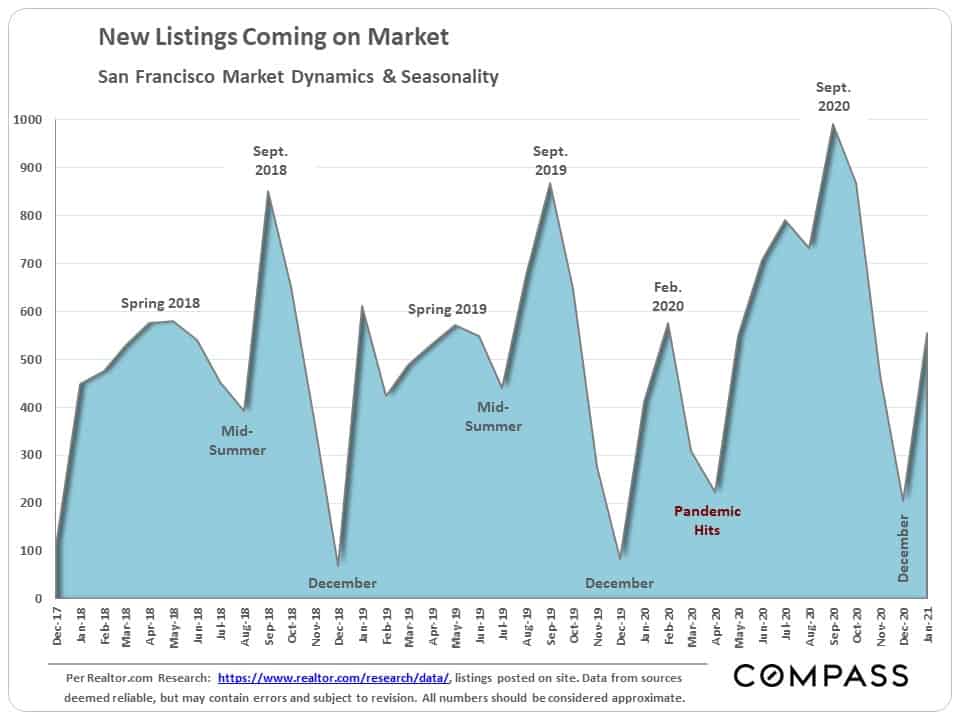
New listings coming on market jumped up in January, as is the norm. The market seems to be heating up much more quickly than typical at the beginning of the new year.
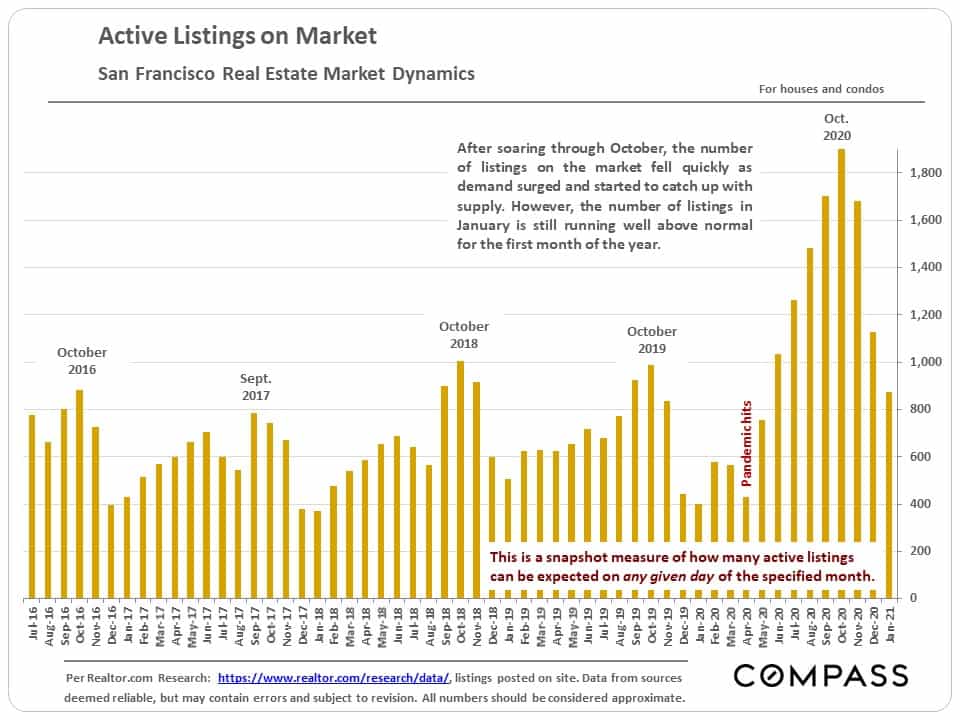
This next chart illustrates the rapid growth in inventory that occurred after the pandemic struck: The spike was heavily weighted to condo listings, which hit an all-time high. In the last 3 months, inventory began dropping quickly – due to increasing demand, a drop in new listing activity, and a jump in listings being pulled off the market by sellers in December for the holidays.
Month by month, year-over-year comparison of home sales volumes – illustrating the initial pandemic crash in activity followed by the market rebound that saw monthly sales volumes climb far above the levels of the previous year. Blue columns represent monthly sales within the last 12 months, and gray columns, sales in the previous 12 months.
Sales were up 60% and peaked for the year in December (first time ever), and January sales soared 67% above January 2020.
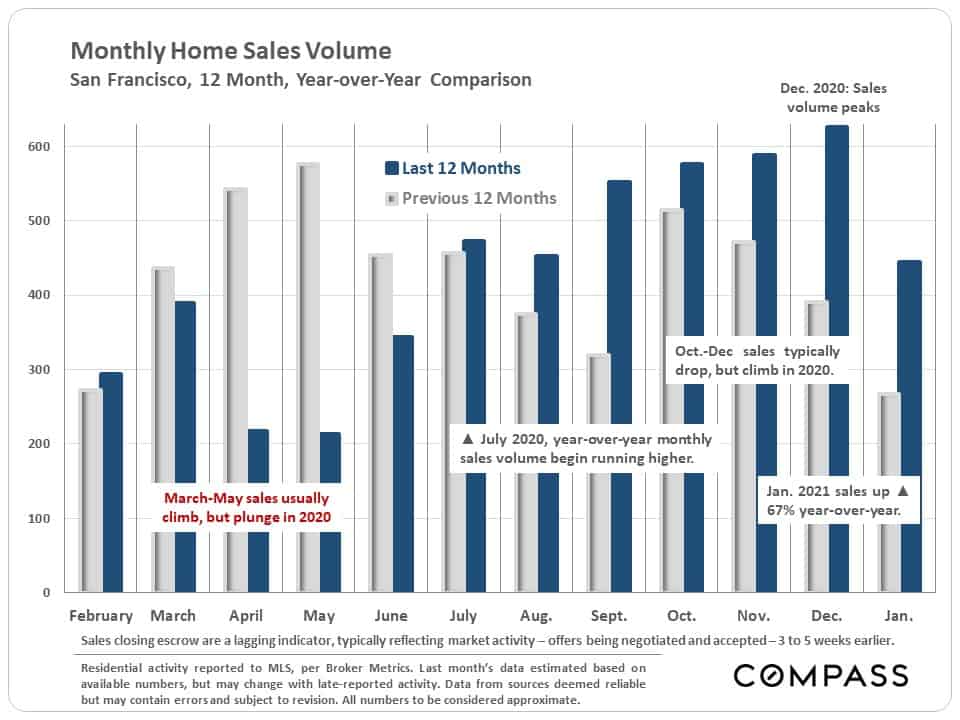
Of the sales reported to MLS, closing in December and January, 43% were houses, 51% condos, 5% TICs and 1% co-ops.
Of the active/coming soon listings in MLS as of early February, 26% were houses, 63% condos, 9% TICs and 2% co-ops.
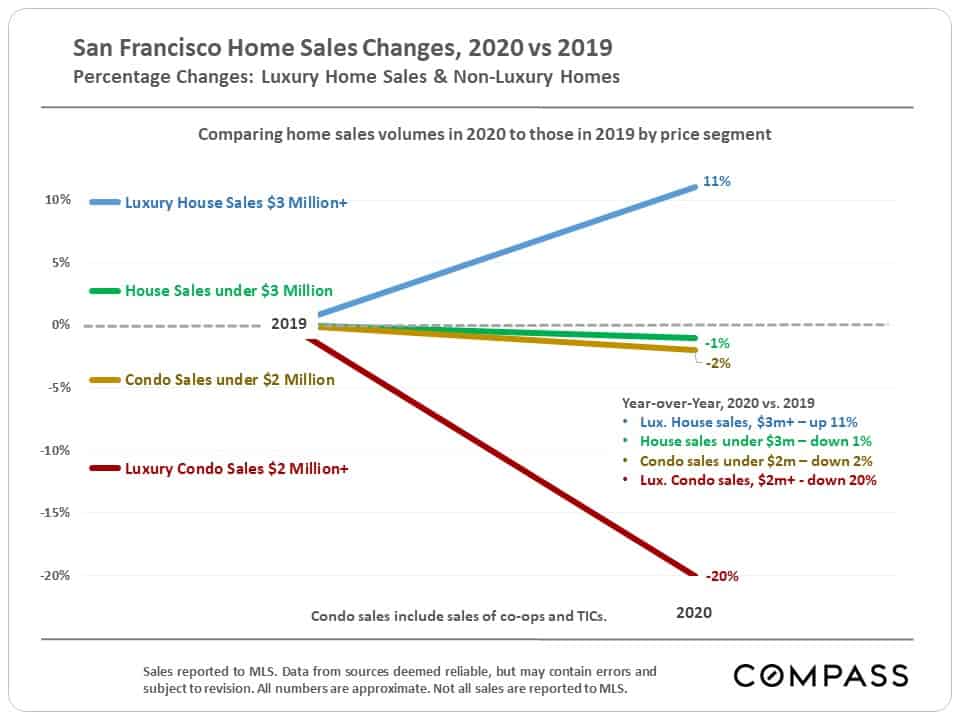
The chart below: Comparing 2020 to 2019, luxury house sales were up, luxury condo sales were well down, and non-luxury home sales were about flat. However, none of these statistics do justice to the rapid acceleration in market activity occurring in the second half of the year.
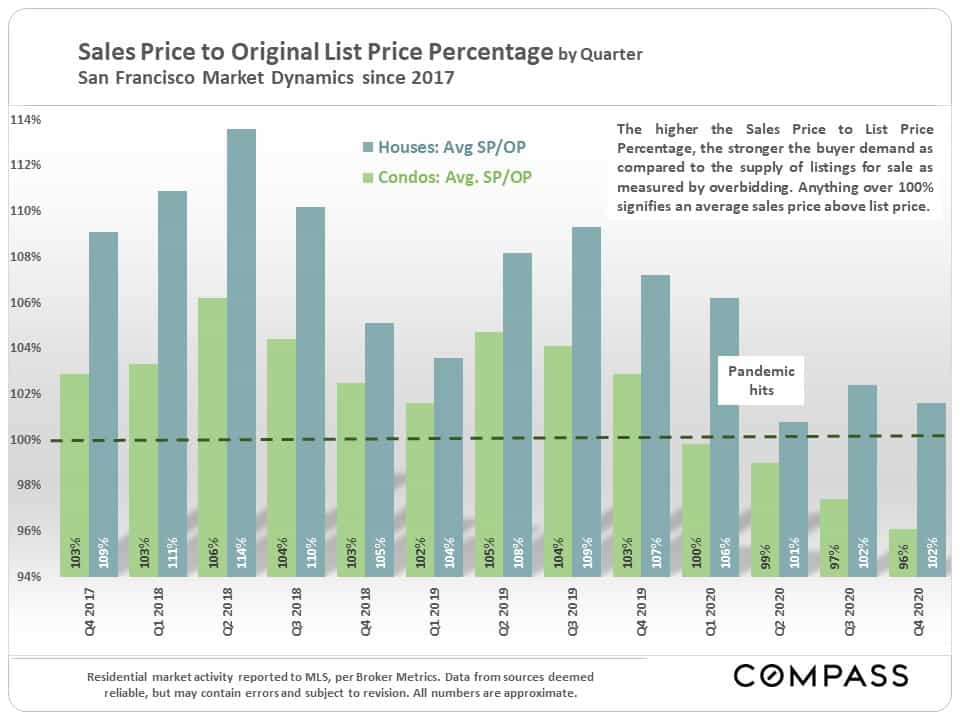
Sales price to original list price percentage: Over 100% – as seen in the 4 quarters of 2020 for houses – signifies an average sales price above original list price. Under 100% – as seen in the 2020 condo market – means, on average, sales prices were negotiated below asking price. Overbidding has declined substantially over the past 3 years.
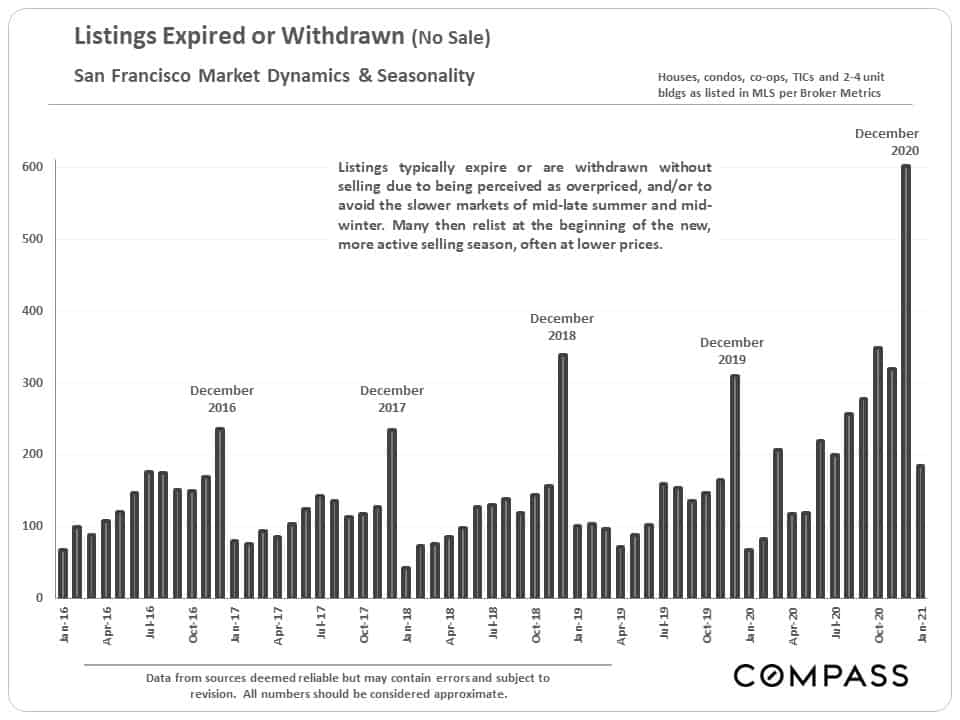
As buyer demand bounced back, the number of price reductions dropped from the historic high reached in early autumn – however, on a year-over-year basis, the number remains higher than is typical for January.
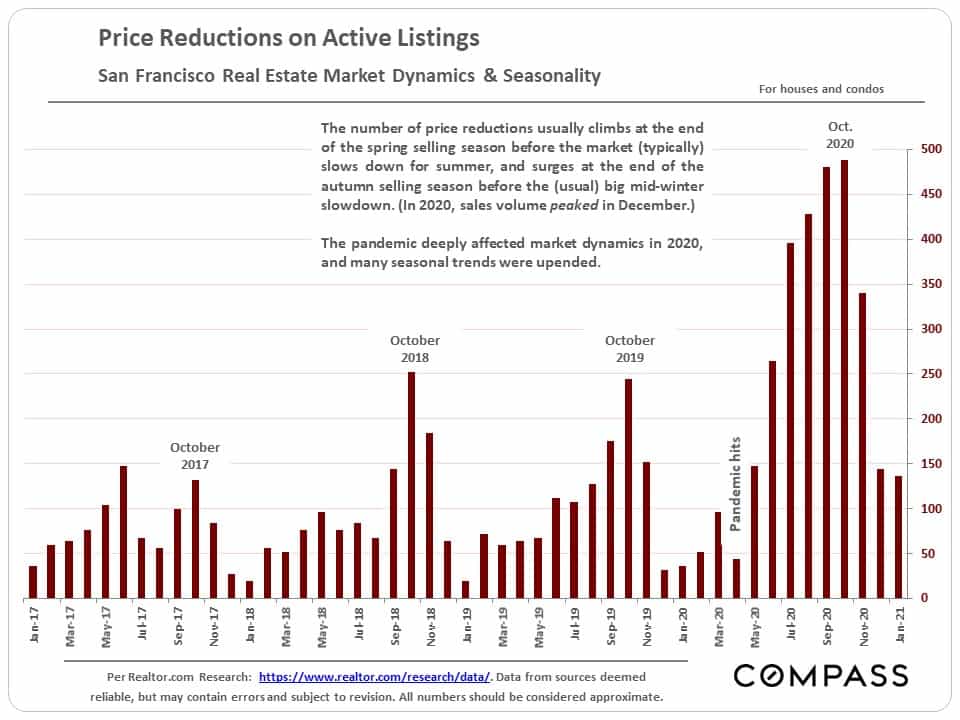
A much larger number than usual of unsold listings were pulled off the market in December. We expect many of these to be re-listed early in the new year, some of them at lower prices than before.
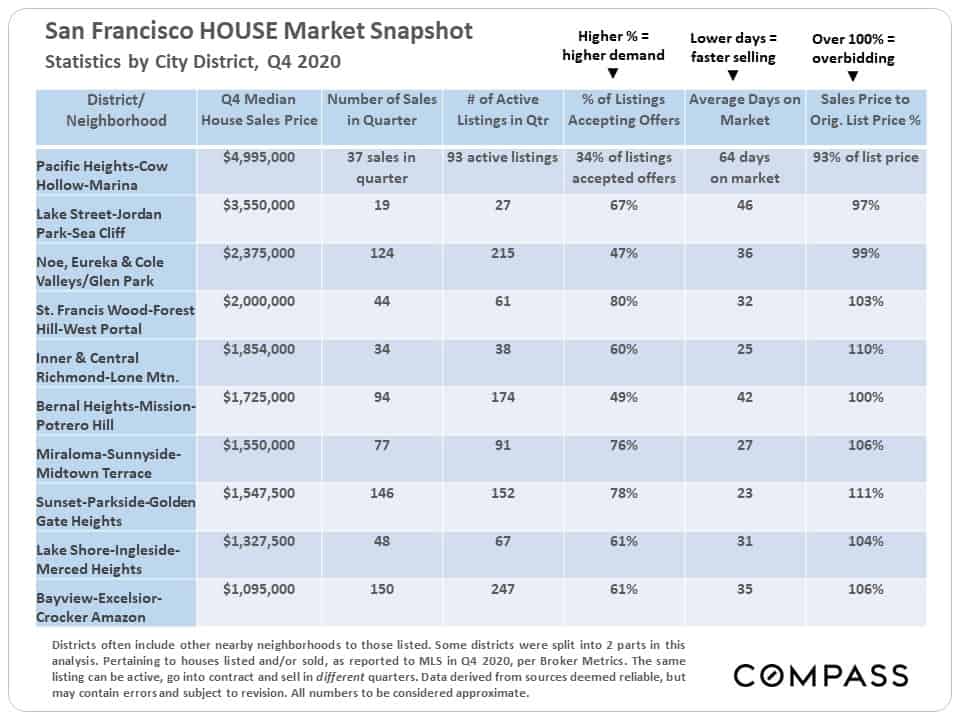
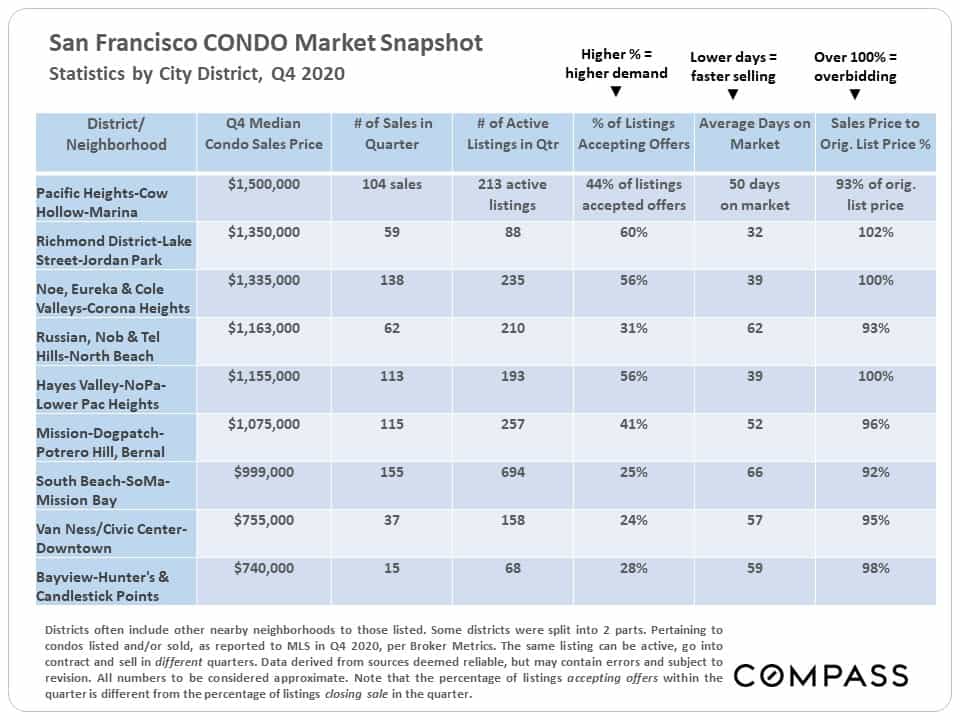
The 2 tables below reflect market statistics and values for Q4 2020 only, by city district (each containing a variety of neighborhoods), first for houses and then for condos. Q4 stats will often be different than those for the full year 2020.
It is not unusual for more expensive markets to have softer supply and demand statistics, though this is not always the case.
City condo markets – especially in districts dominated by high-rises and large projects – often saw much cooler conditions than house markets.
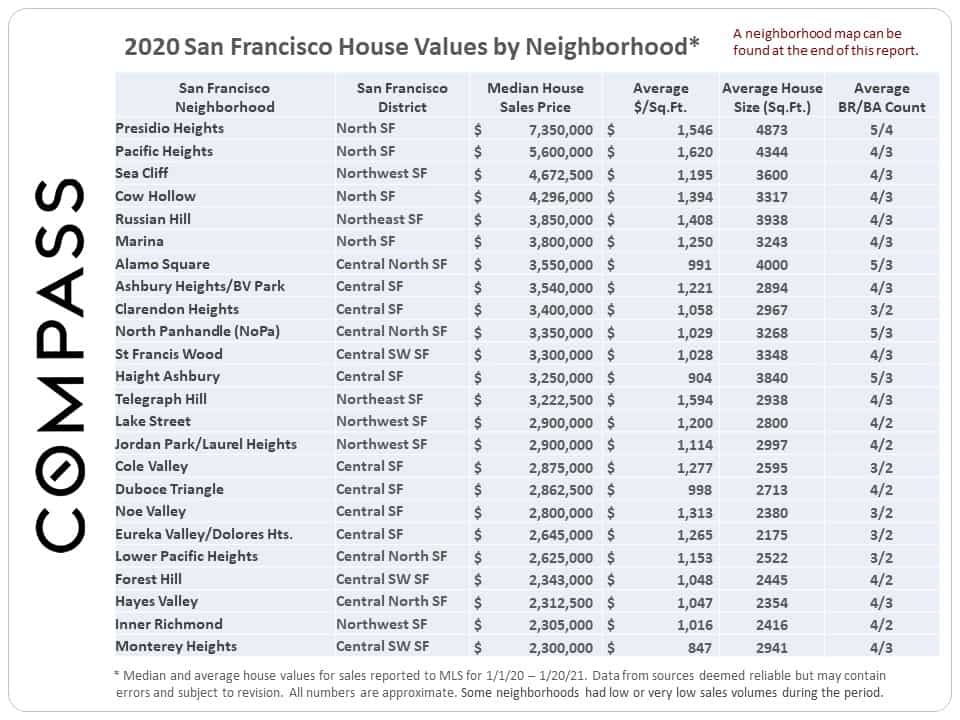
Below is the first of 4 tables reviewing full-year 2020 SF home values by neighborhood. The full report along with a home price map is here: San Francisco Neighborhood Home Prices. And for the entire region: Bay Area 2020 Home Prices.
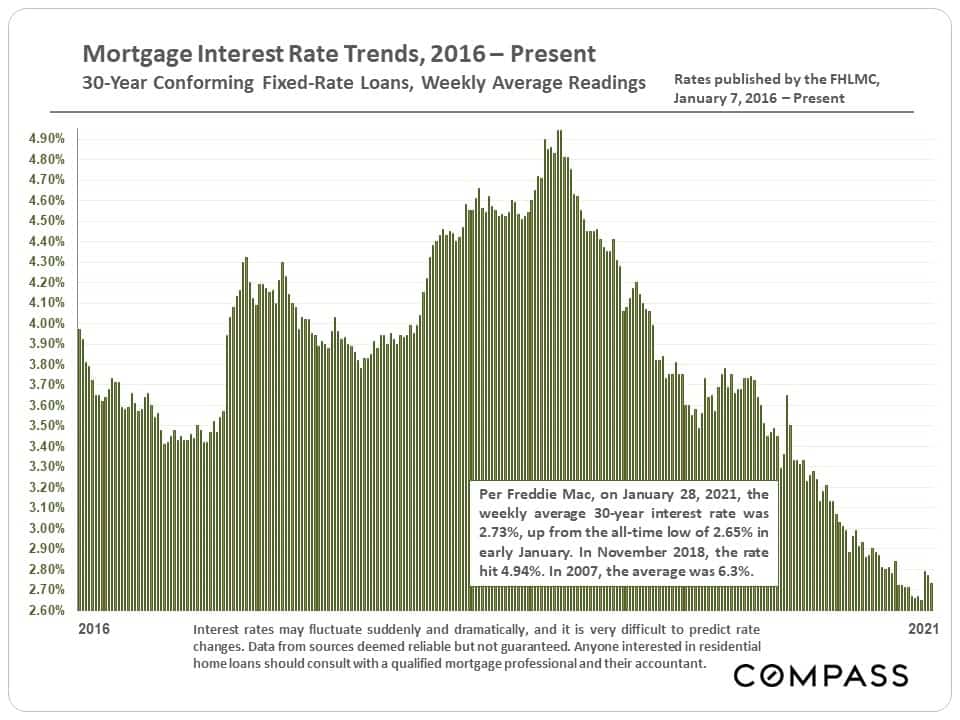
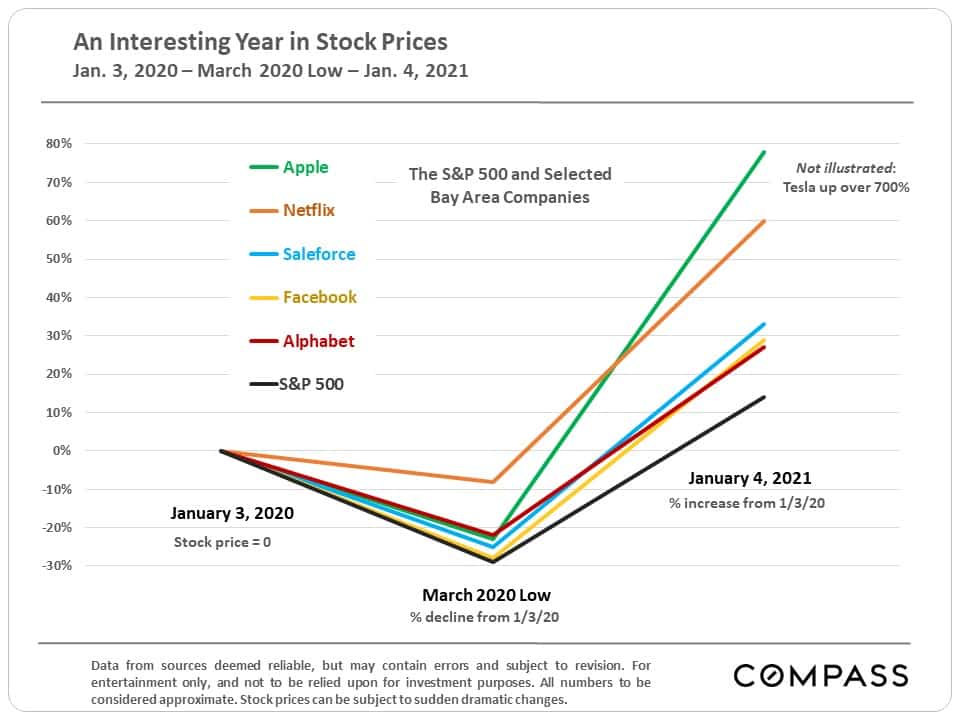
Two major factors behind the Bay Area housing market recovery were the dramatic drop in interest rates, and the significant rebound in the stock market – especially in the stock prices of some of our local high-tech giants.