San Francisco December Real Estate Market Report
San Francisco Real Estate
December 2019 Market Snapshots
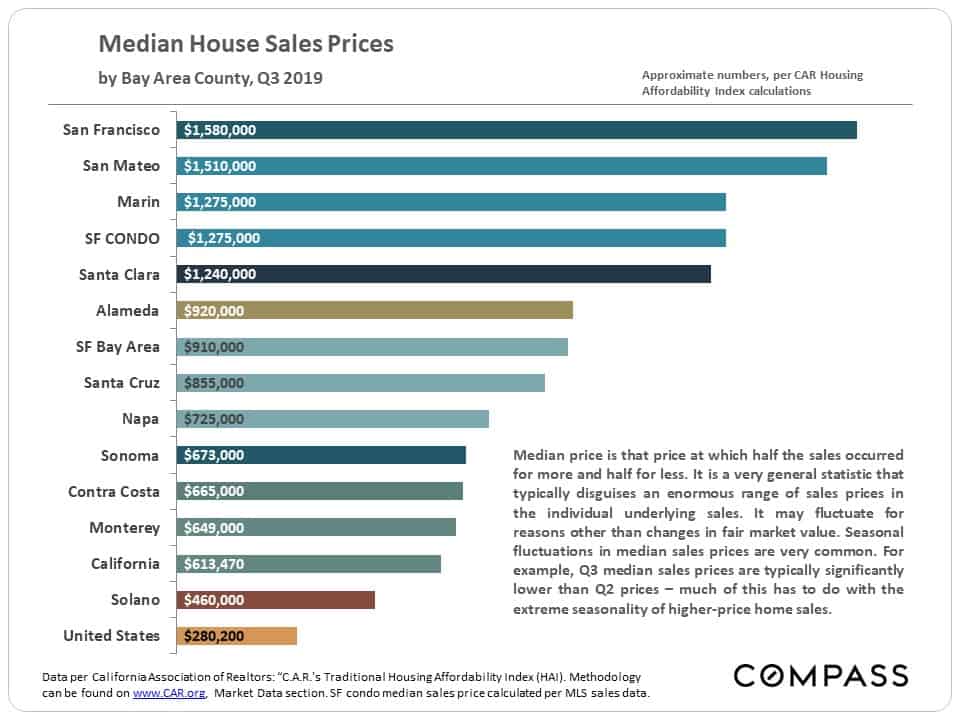
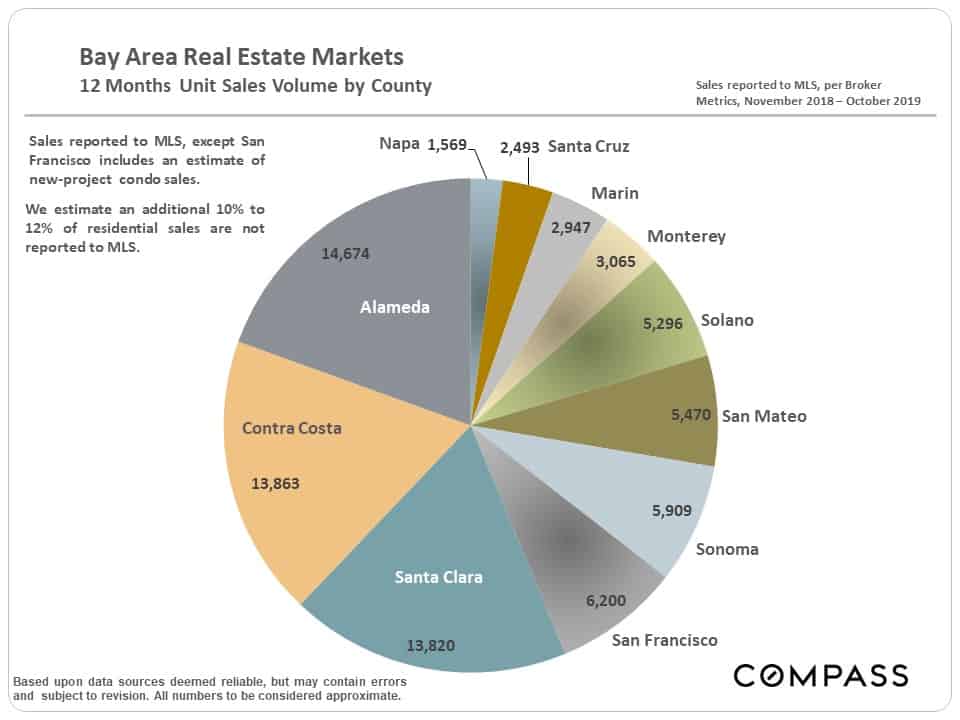
Bay Area Prices & Market Sizes
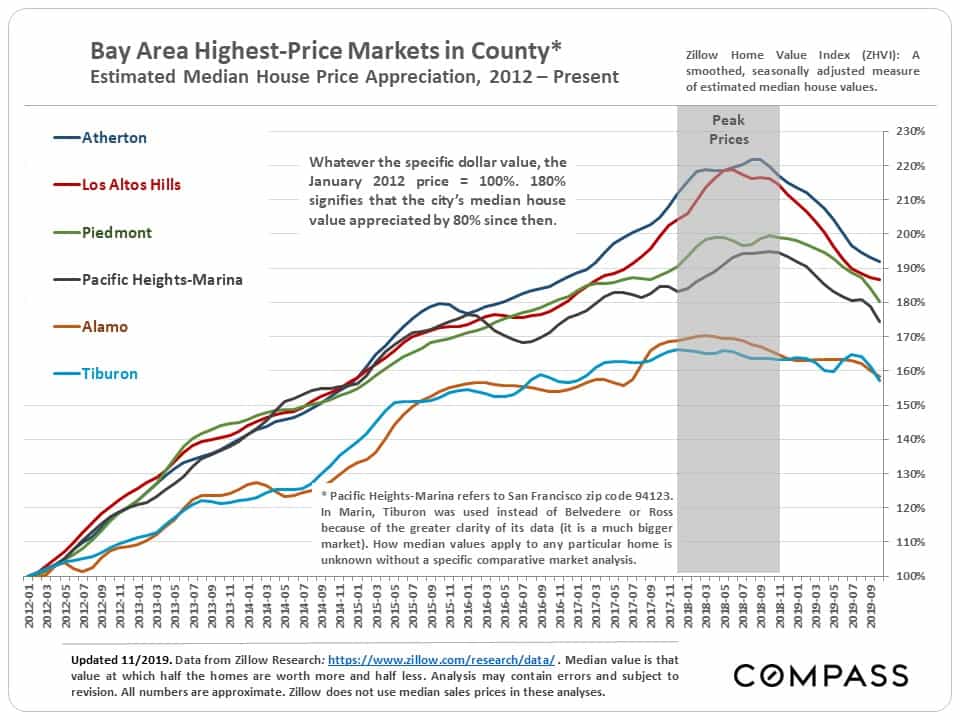
Appreciation in Very Expensive Markets
This next chart looks at percentage appreciation since 2012 in the most expensive markets of 5 Bay Area Counties. (In Marin, Tiburon, a very expensive, but not the most expensive market in the county, is graphed due to data issues.) This chart does not delineate prices, which vary hugely, only estimated percentage home price changes over time.
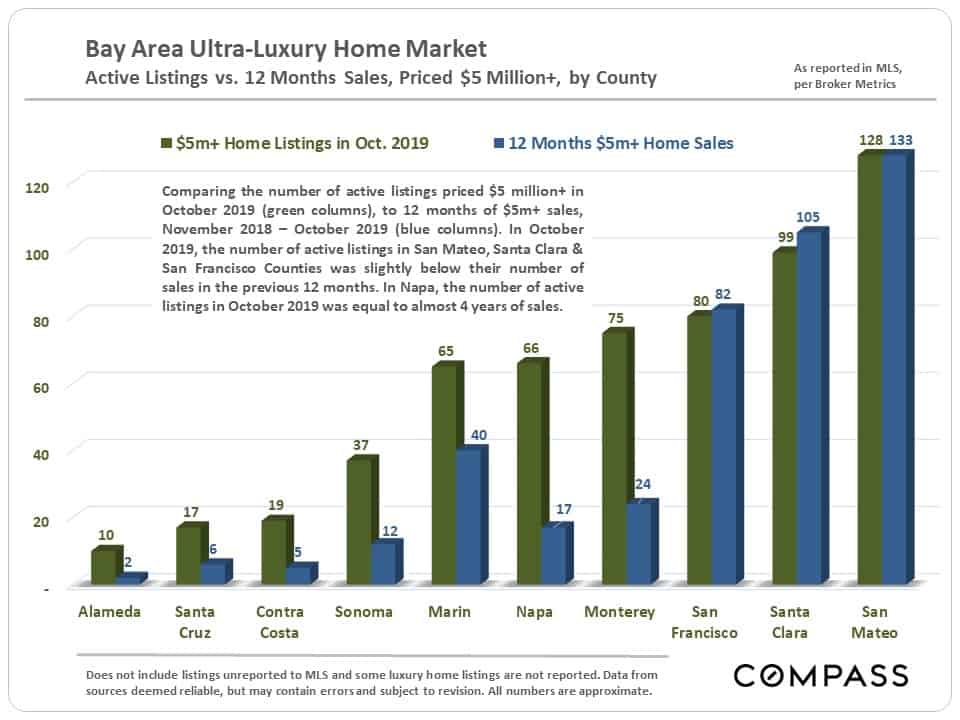
Bay Area Ultra-Luxury Home Markets –
Active Listings vs. 12 Months Sales
SF has the third largest market for homes of $5,000,000+ in the Bay Area.
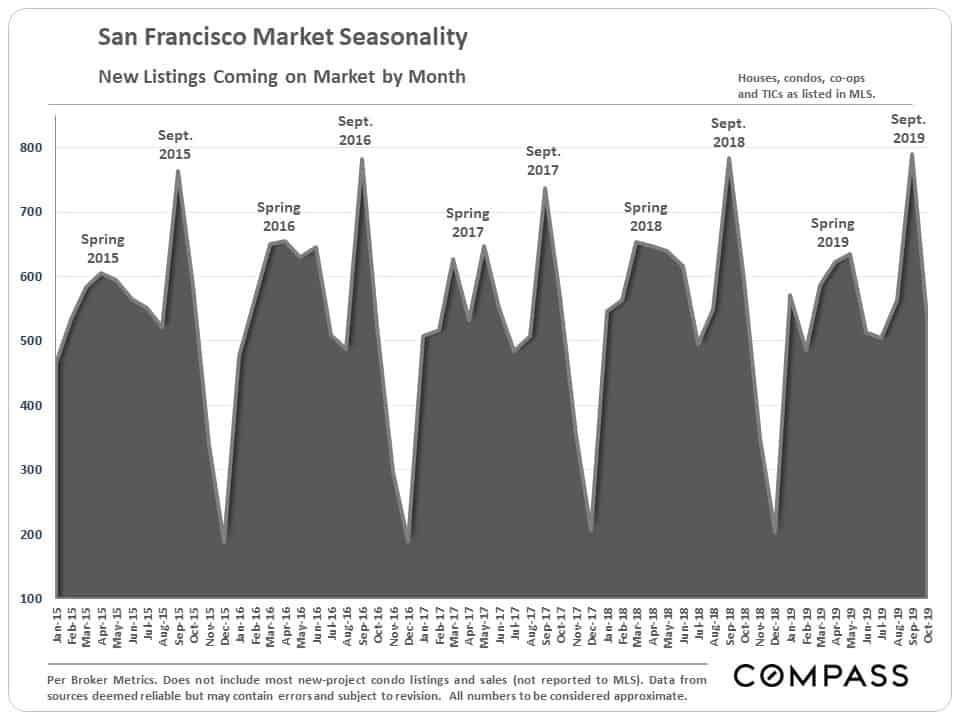
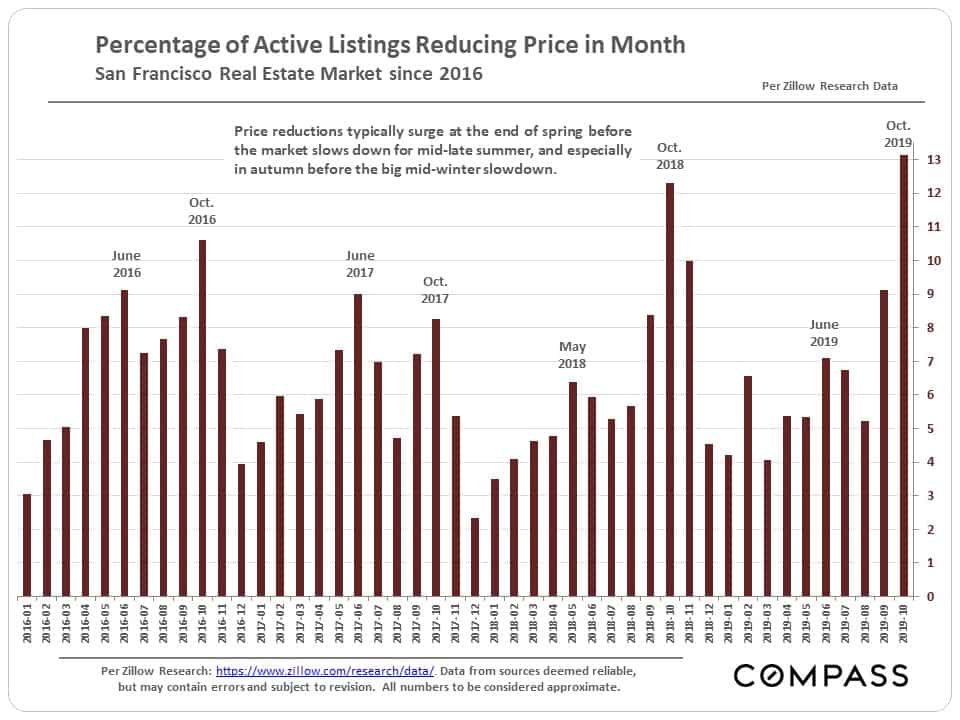
Market Dynamics & Seasonality –
New Listings & Price Reductions
The market is now deep into its seasonal plunge in activity, which hits its nadir in December. (This chart is updated through October. November saw its usual big drop in new listing activity.)
Home Prices & Market Statistics by SF District
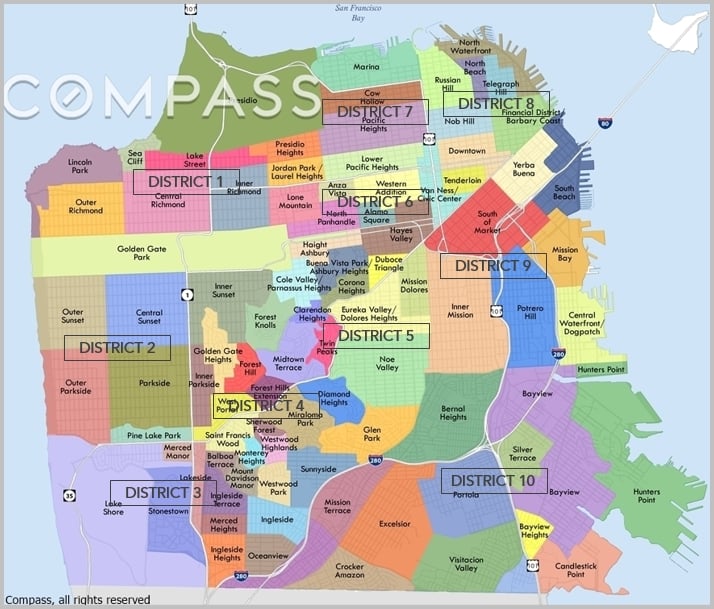
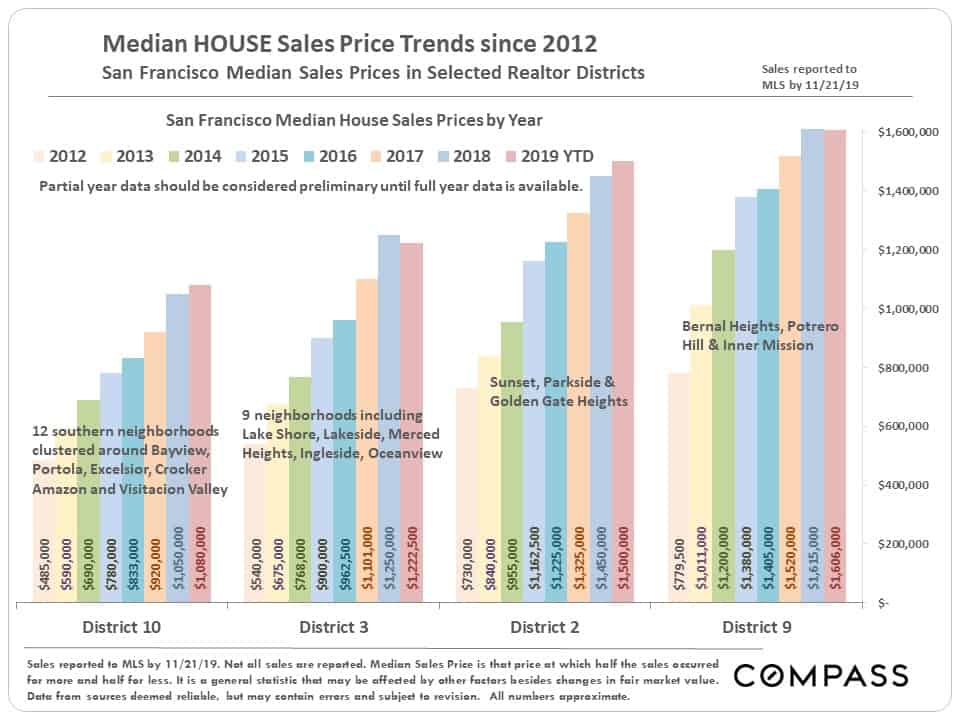
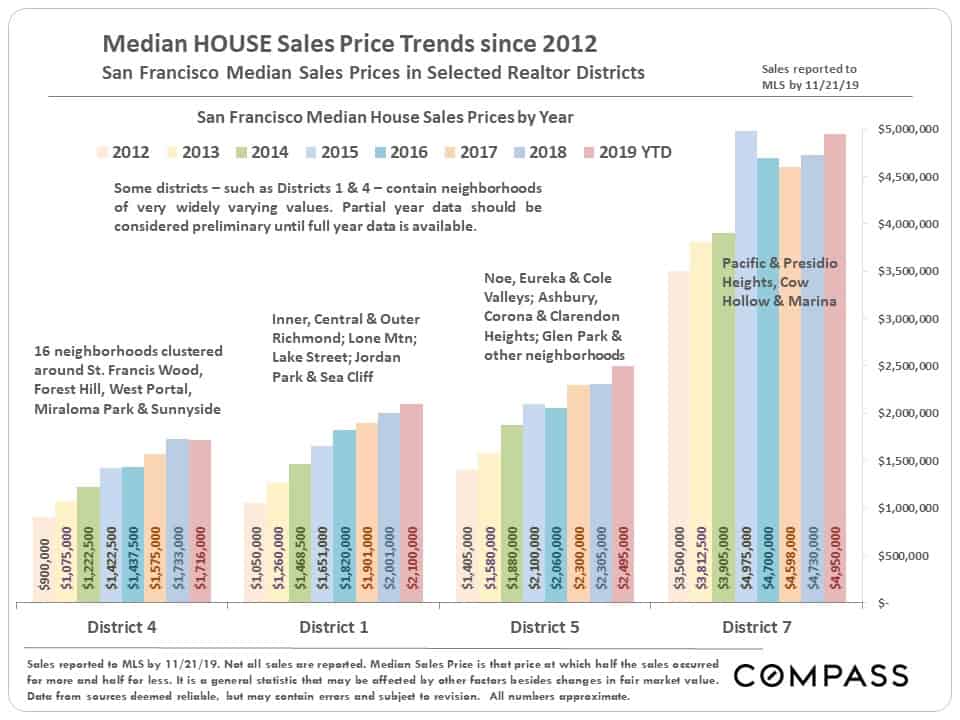
Median House Prices by Realtor District
As always, these prices should be considered very general approximations of prices in complex district markets containing homes of widely varying size and quality.
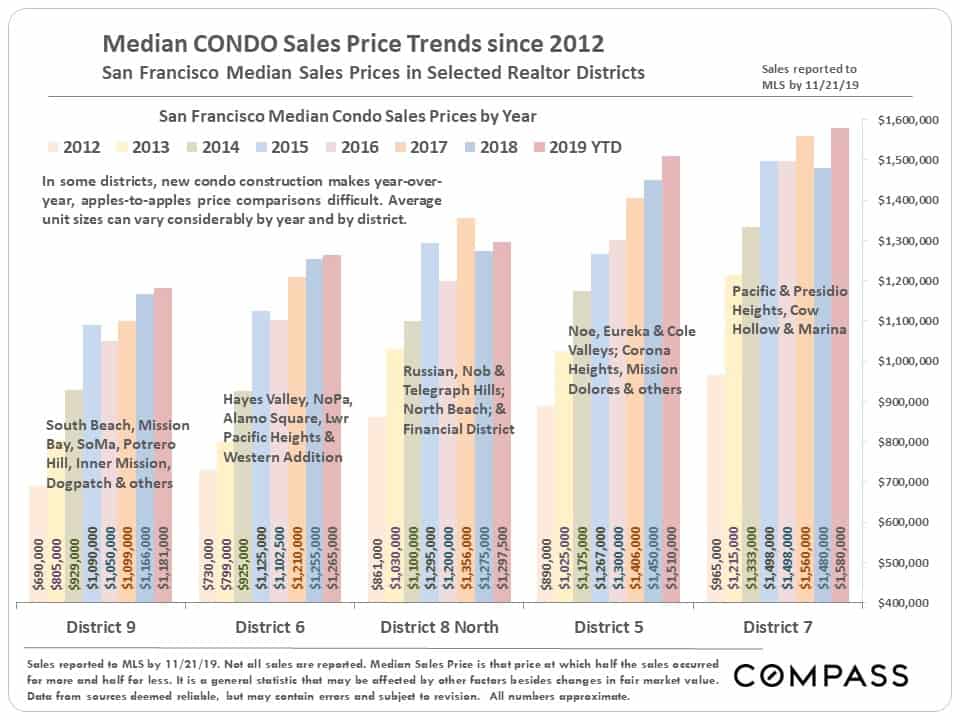
Median Condo Prices by Realtor District
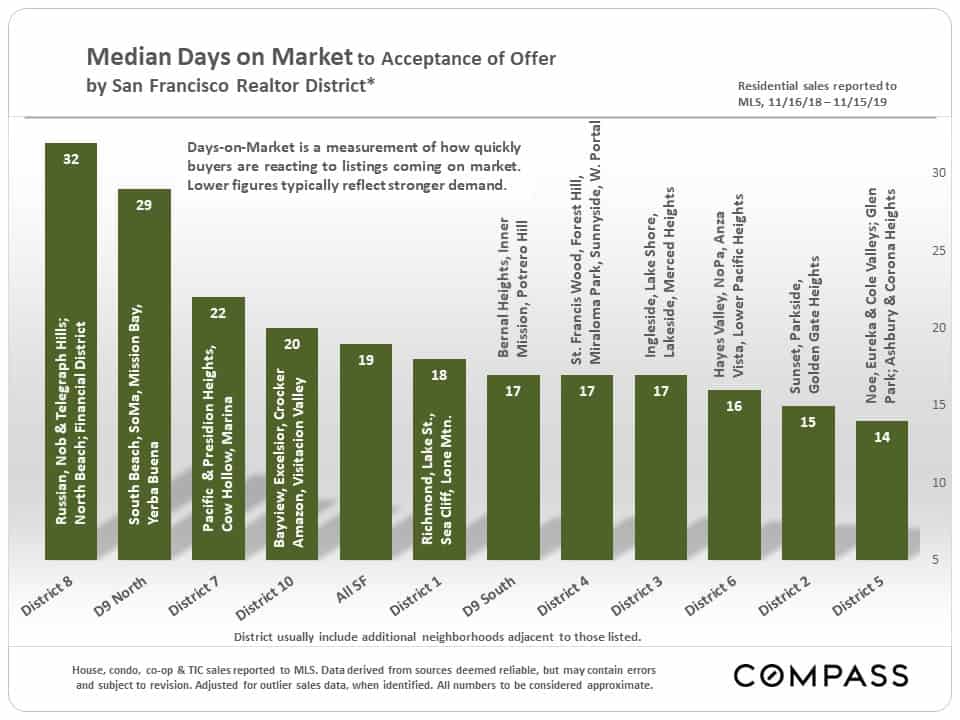
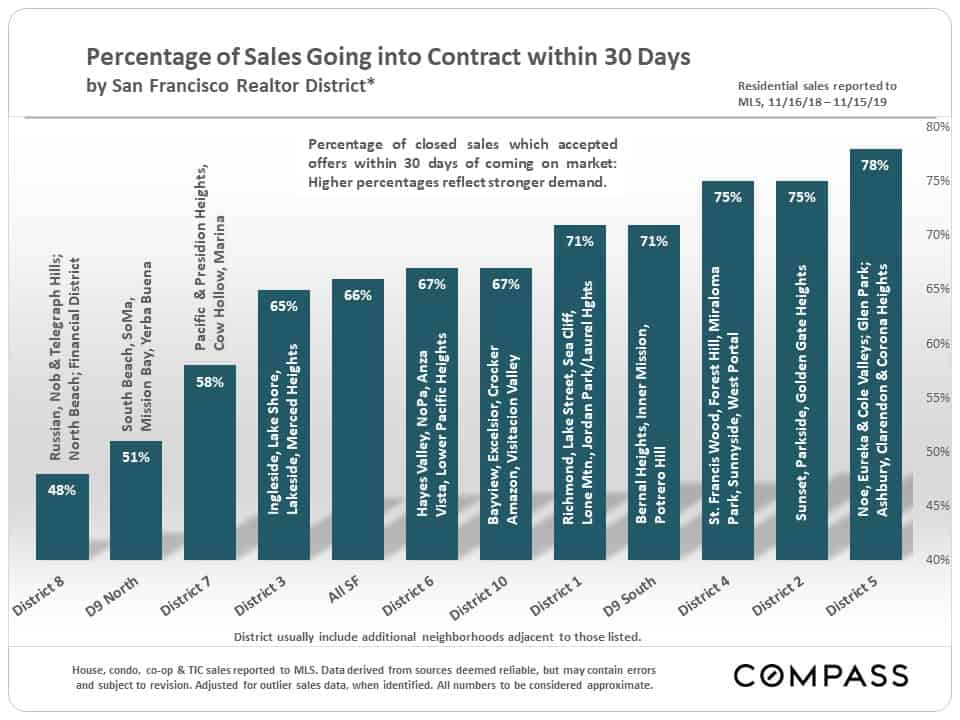
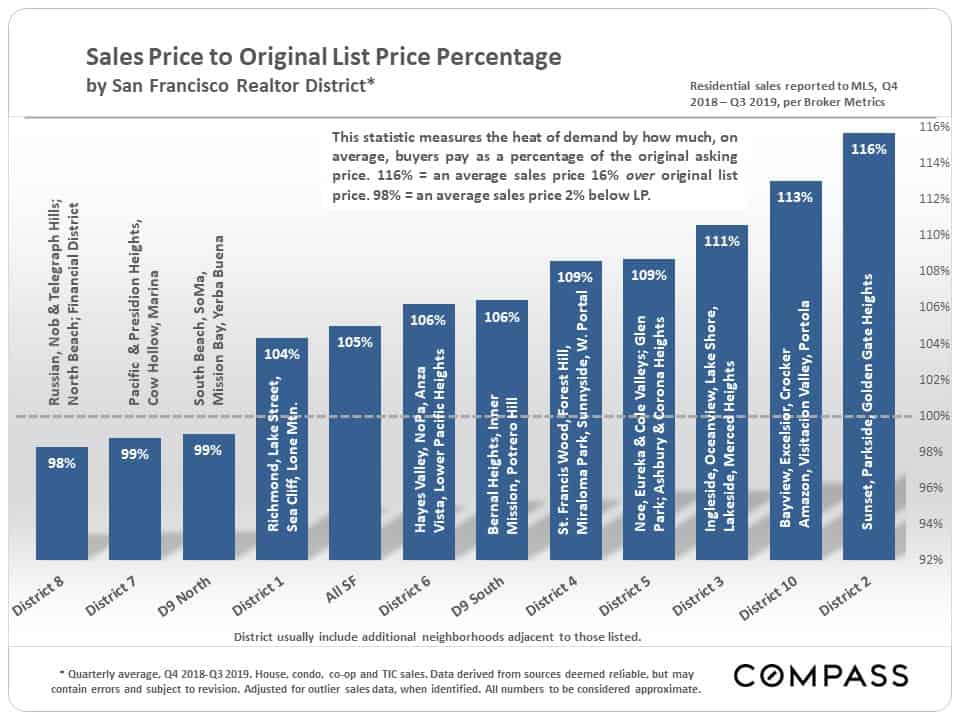
Market Statistics by Realtor District
As mentioned in previous reports, market dynamics in San Francisco are often – but not always – separated by price segment as much as by neighborhood/district location. More expensive segments not unusually have somewhat softer supply and demand dynamics. However, District 5, one of the city’s more expensive districts, has been bucking that trend in 2019.
Districts dominated by condo sales also typically have softer dynamics than those dominated by house sales.