Oakland, Berkeley, Piedmont and Alameda December Real Estate Market Report

Greater Oakland-Berkeley, Inner East Bay Real Estate
December 2019 Market Snapshots
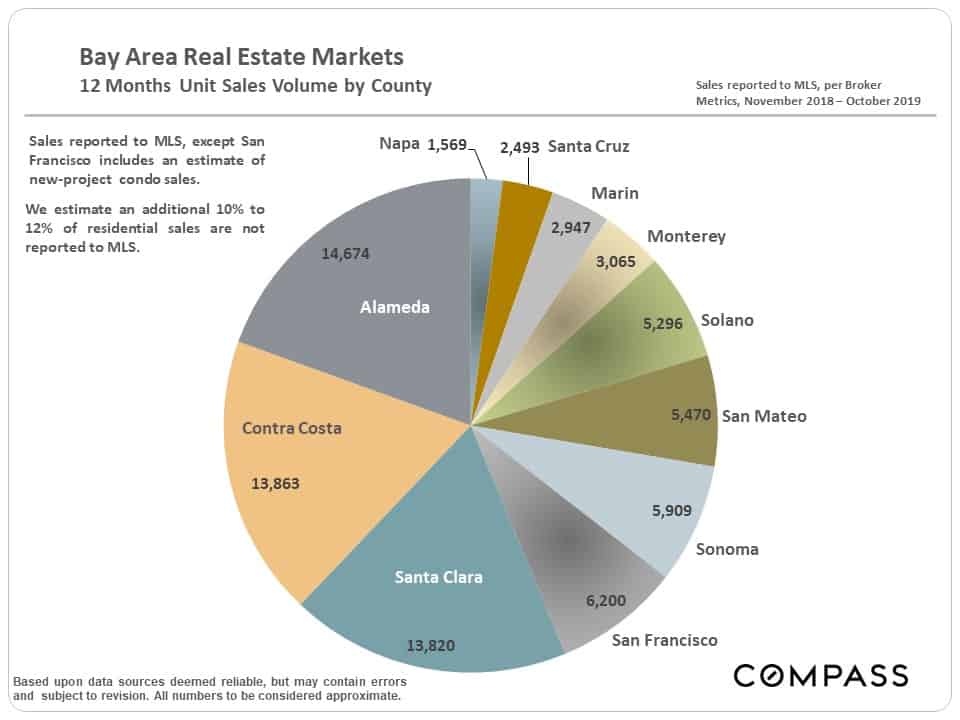
Bay Area Home Prices by County
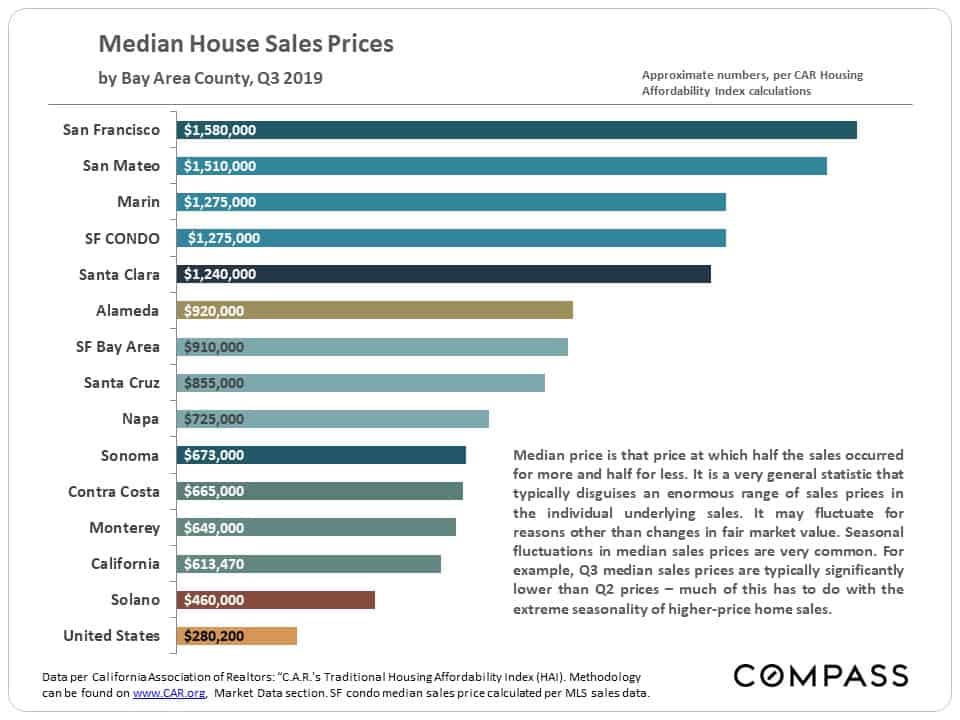
By number of sales, Alameda County is the largest market in the Bay Area. The greater Oakland-Berkeley region constitutes the largest market within the county.
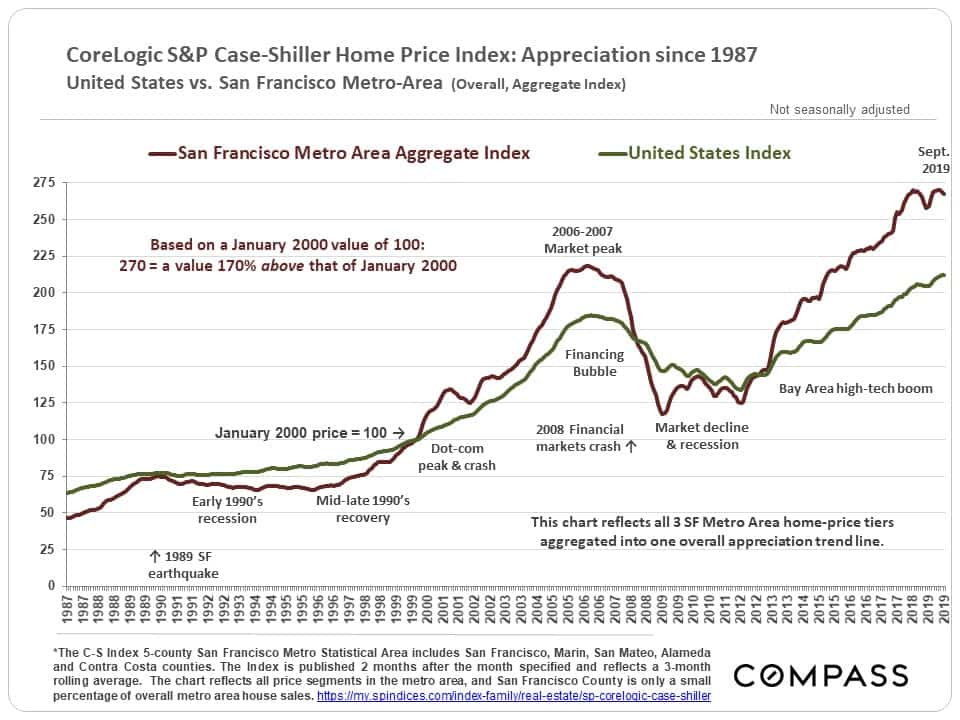
Bay Area vs. U.S. Appreciation Trends
This next chart estimates percentage home price appreciation trends for the San Francisco metro area (red line) and for the country as a whole (green line). In the latest market up-cycle, which began in 2012, the divergence in trend lines is very dramatic. The chart does not delineate prices, only percentage changes based upon a January 2000 value of 100. Thus 260 = 160% appreciation since January 2000.
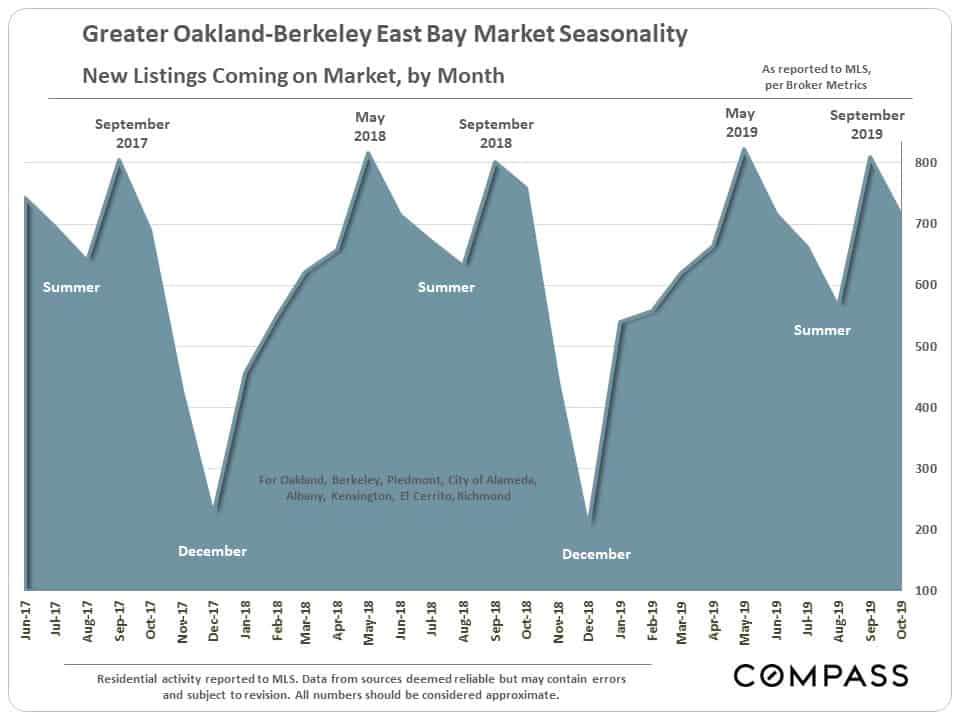
Market Seasonality – New Listings
Coming on Market
The market is currently in the midst of its annual plunge in new listing activity, which hits bottom in December. (This chart is updated with data through October.)
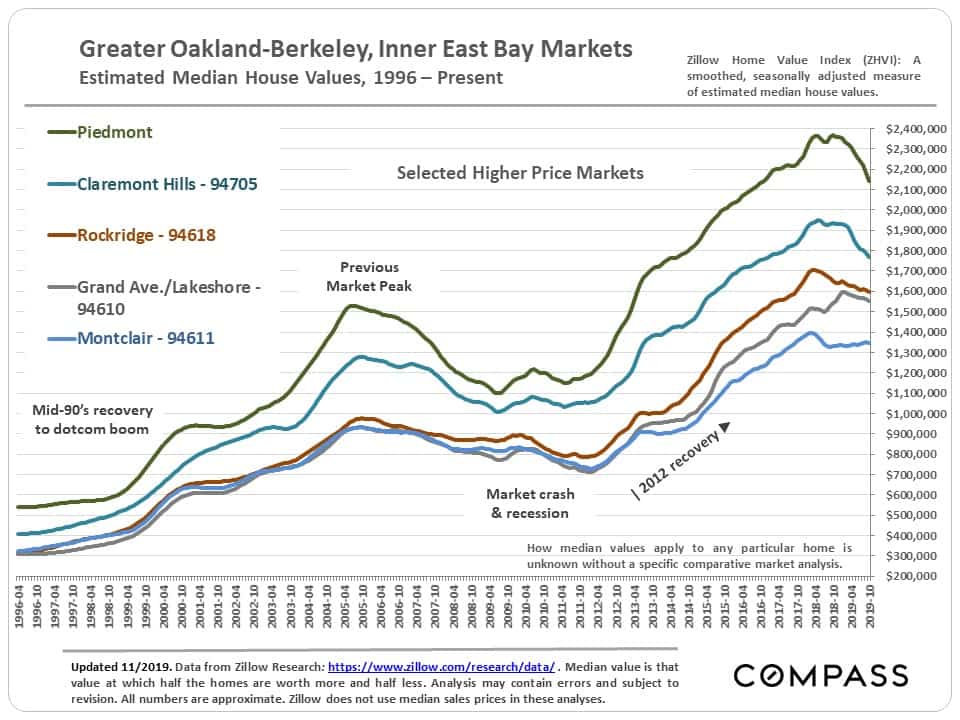
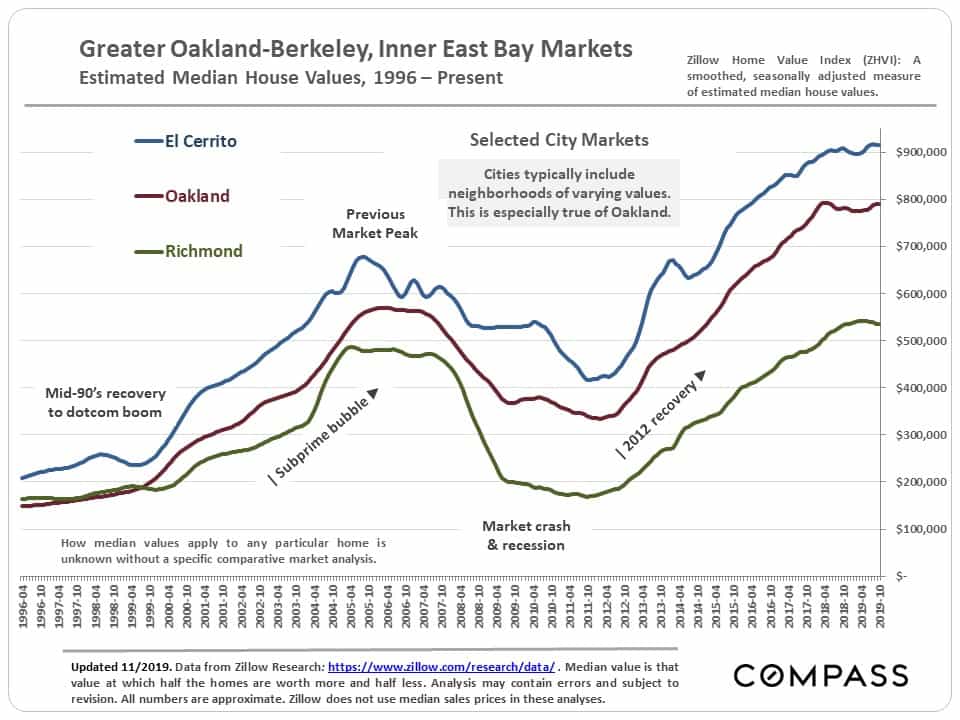
Estimated Home Price Trends since 1996
The next 3 charts are based upon the calculations of an algorithm which estimates – in a smoothed out, seasonally-adjusted trend line – changes in median home values. According to its calculations, prices in some of our more expensive markets have dropped from recent peaks.
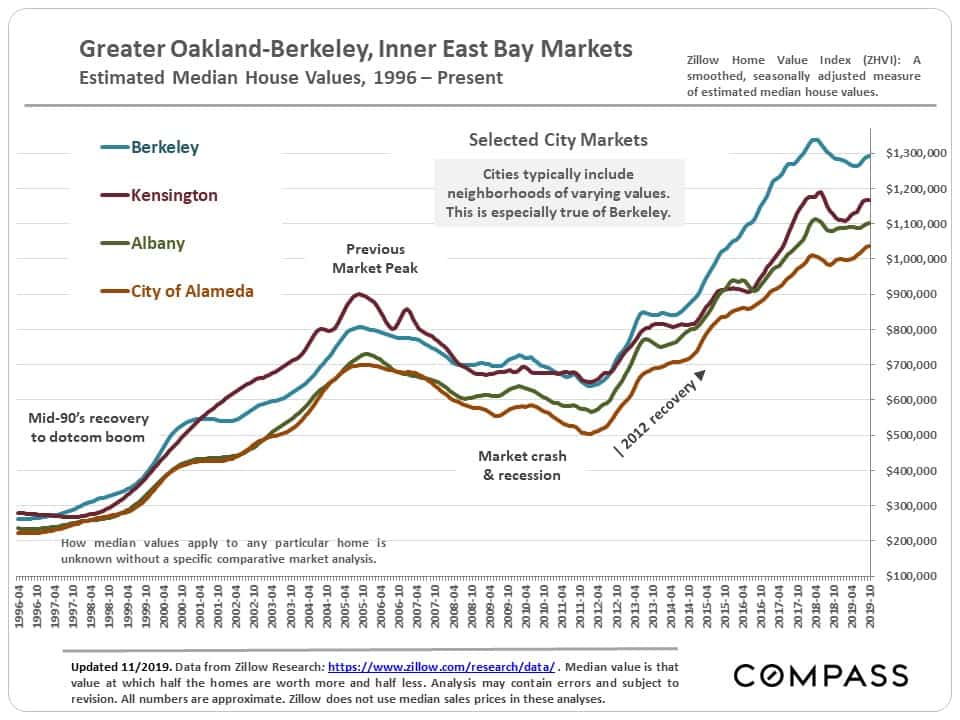
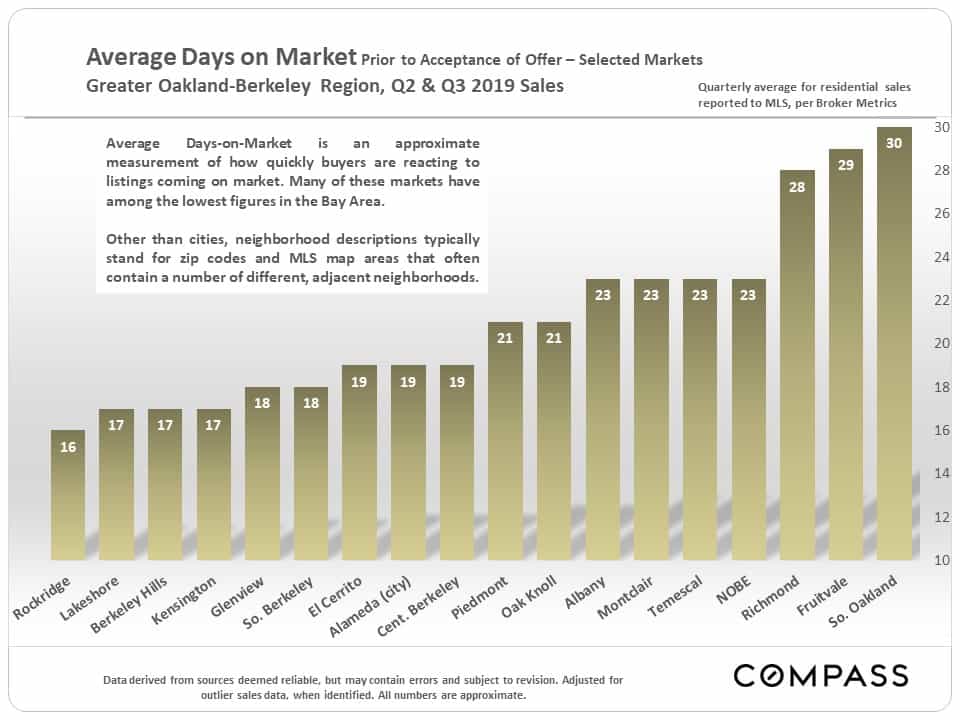
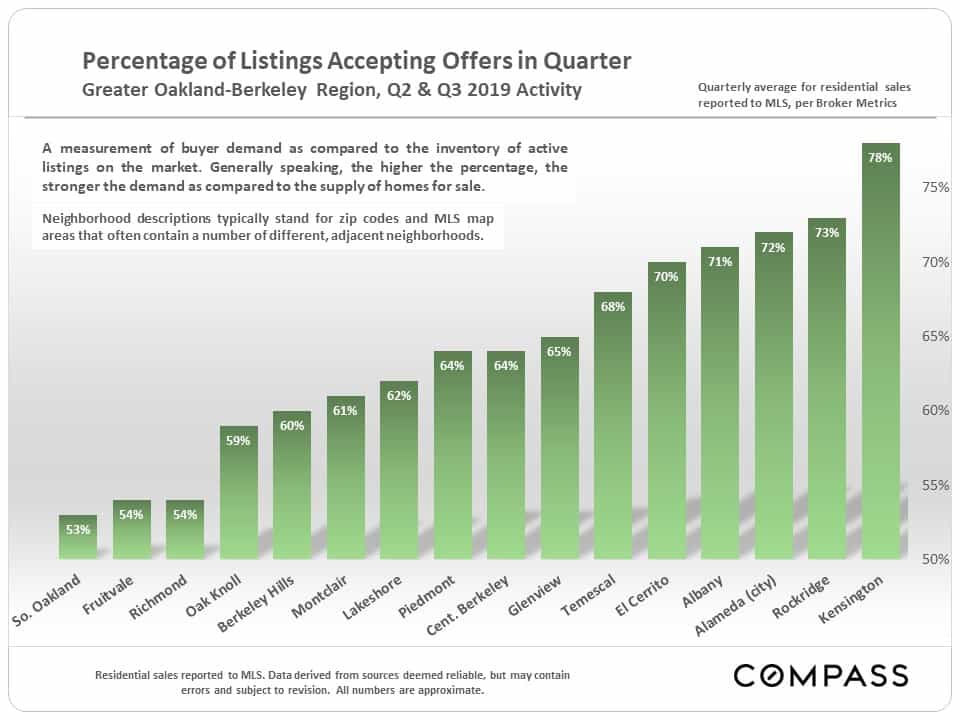
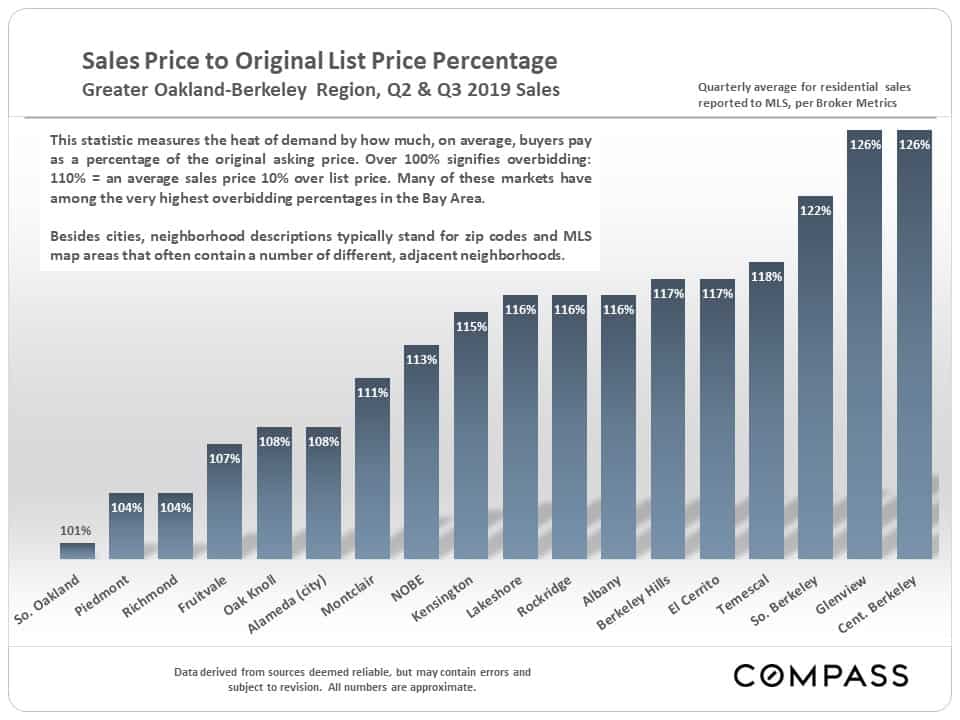
Market Dynamics by City or District
As often mentioned in previous reports, many of our cities and districts display statistics indicating some of the highest-demand markets in the country.
Regional Market Statistics