Marin February Real Estate Market Report

Heading into the 2019 Market
February 2019 Report
As of early February, the government shutdown is over – at least for a couple more weeks – the stock market has recovered dramatically from its late 2018 plunge, and interest rates are well down from November highs. A good number of large, local, high-tech “unicorns” continue to plan IPOs in 2019. All these are positive economic indicators for the Bay Area real estate market. However, indicators have proven to be volatile over the past 5 months, and their future direction should not be taken for granted.
As detailed in recent reports, there was some cooling in the market in the second half of 2018, after a very hot spring. The month of January typically has the fewest sales of the year, sales which mostly reflect activity during the December market doldrums: We don’t consider its data to be a reliable indicator of conditions or trends. But activity is picking up, and the beginning of the spring sales season – typically the strongest market of the year – will soon provide more direction as to where the market is heading.
Market Overviews
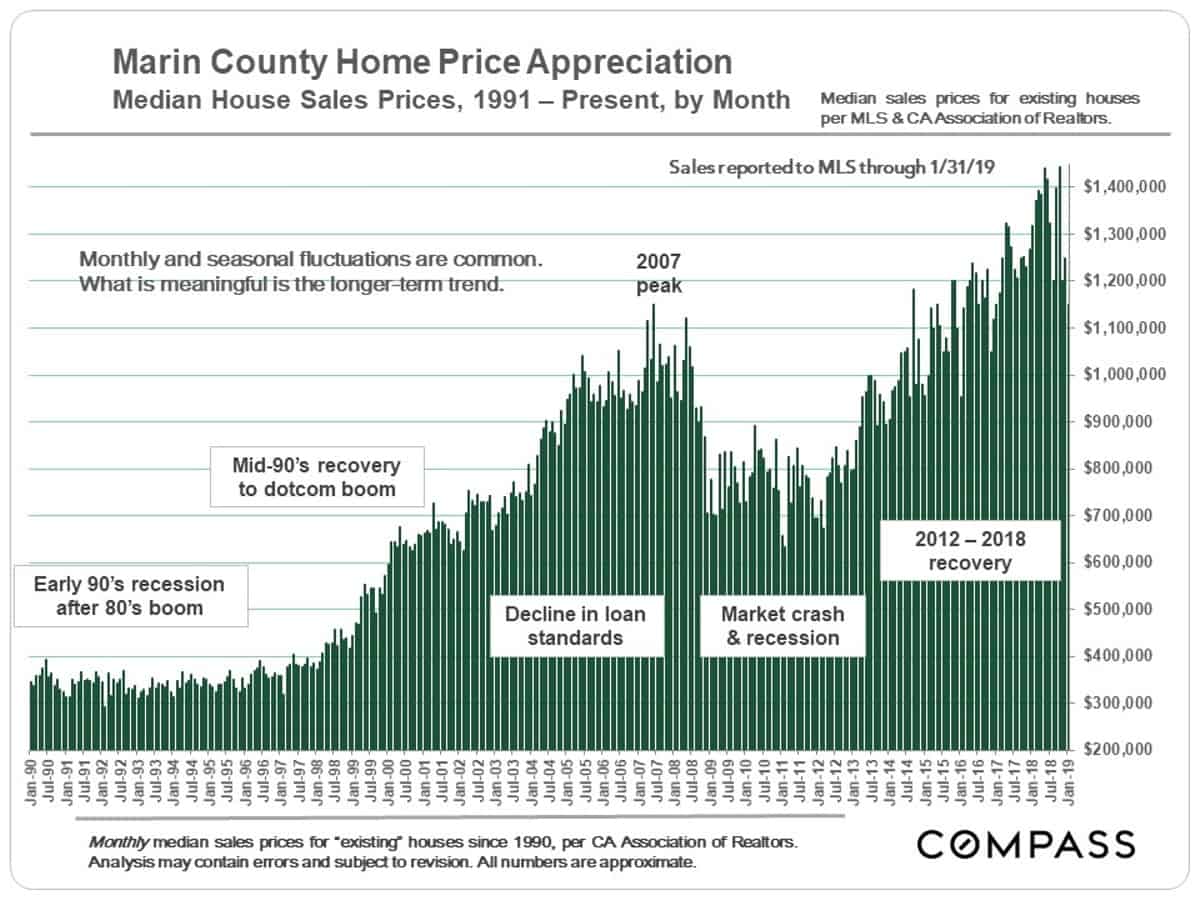
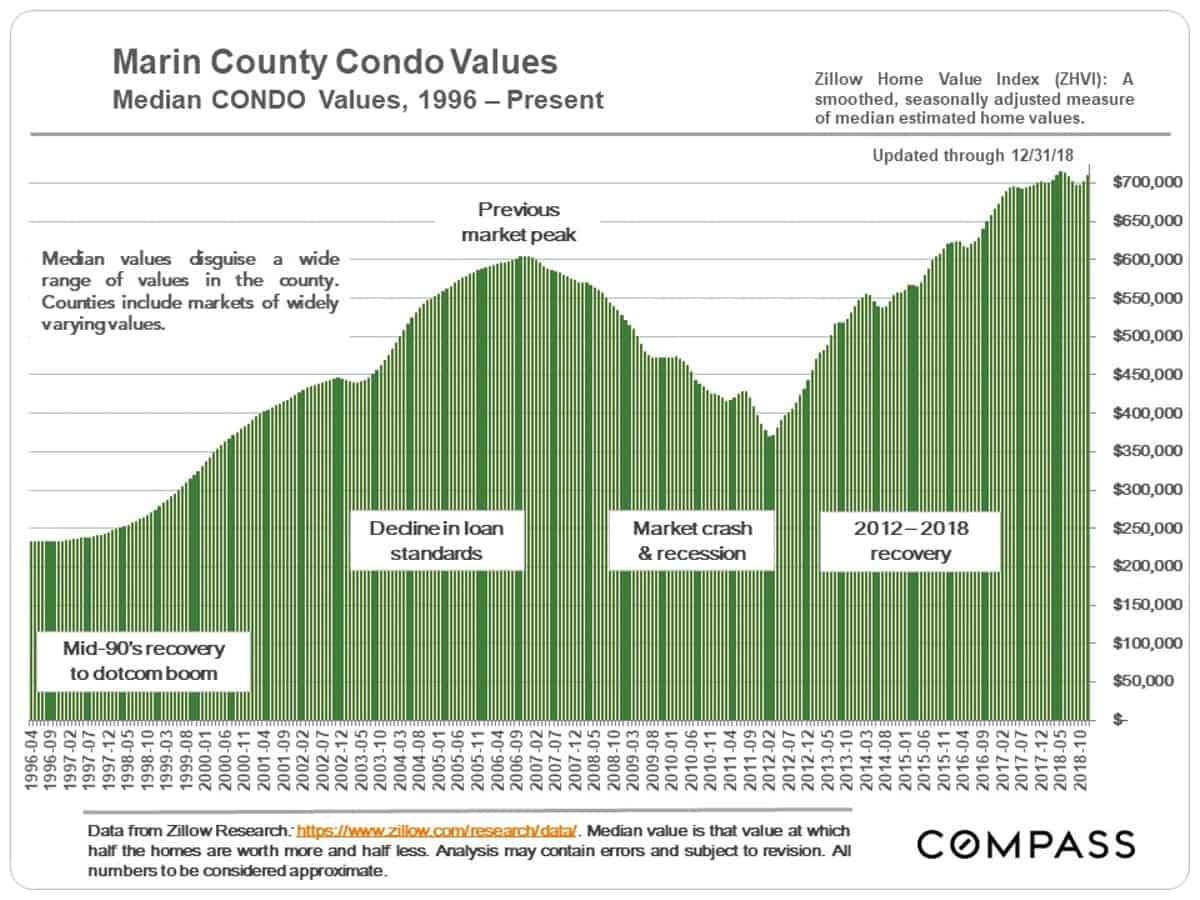
Median sales prices often fluctuate by month or season, and such short-term changes often have little to do with changes in fair market value: There can be other supply and demand factors at play. But these charts illustrate the longer-term trends in appreciation in the Marin market.
This median condo value chart has the monthly fluctuations smoothed out.
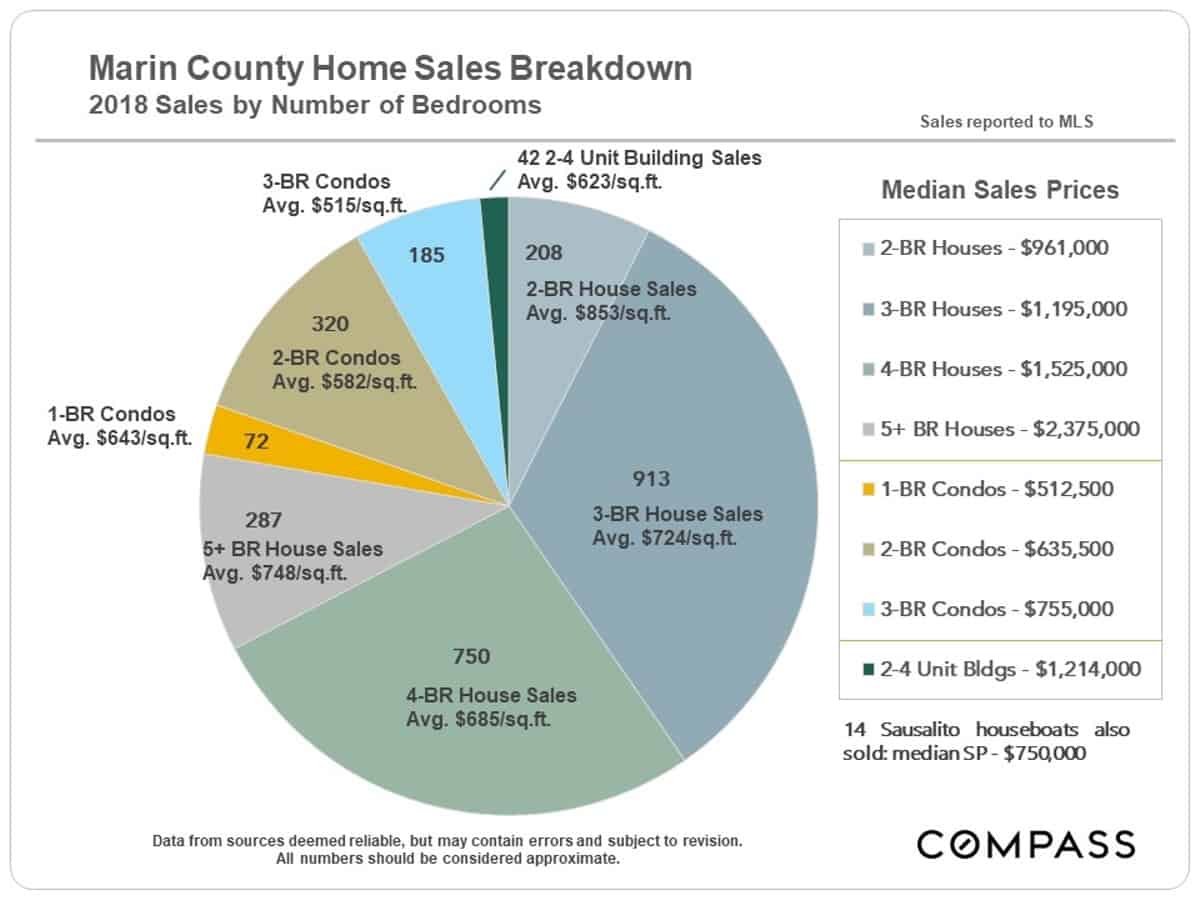
Since San Rafael and Novato are by far the largest markets in Marin by sales volume, they have an outsized impact on county median sales prices. Further down in this report, median prices are broken out by city and town. The dominant home sale in the county is the 3-bedroom house, with 4-bedroom houses not far behind.
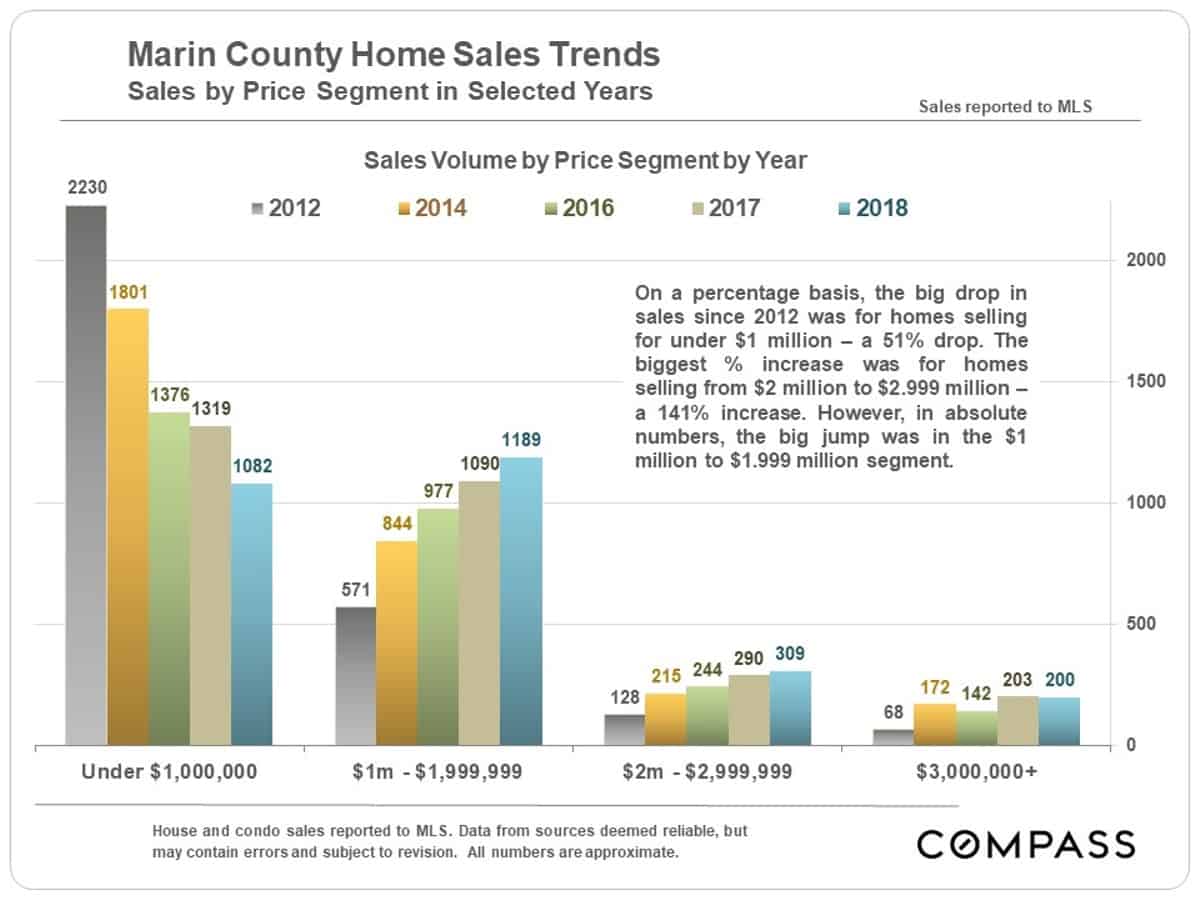
Annual Sales by Price Segment since 2012
Since 2012, home sales under $1 million have dropped by half as prices have steadily appreciated. This chart shows the migration of sales to higher price segments.
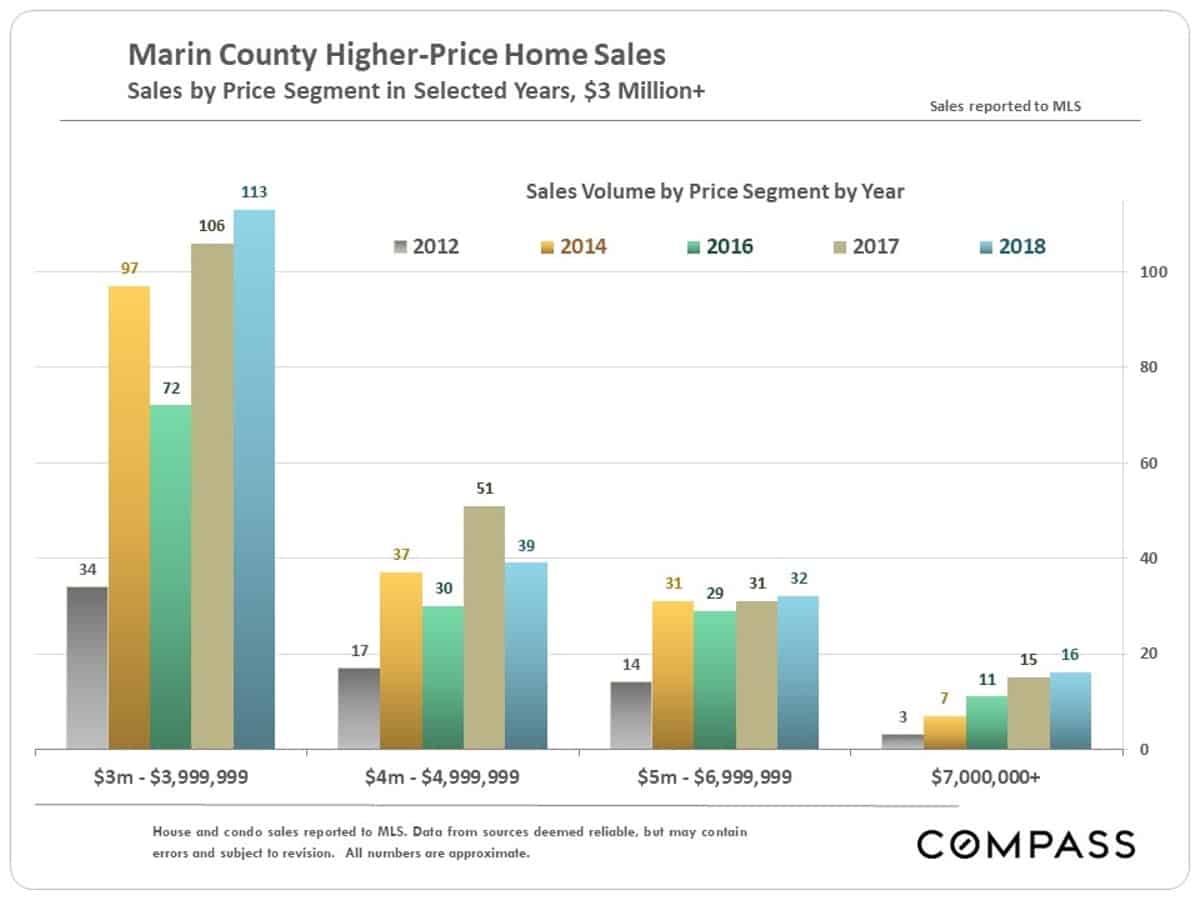
Annual Luxury Home Sales since 2012
Home sales at prices of $3 million and above in 2018 were about the same as the number sold in 2017. The big jump was in the first couple years of the recovery, 2012 to 2014.
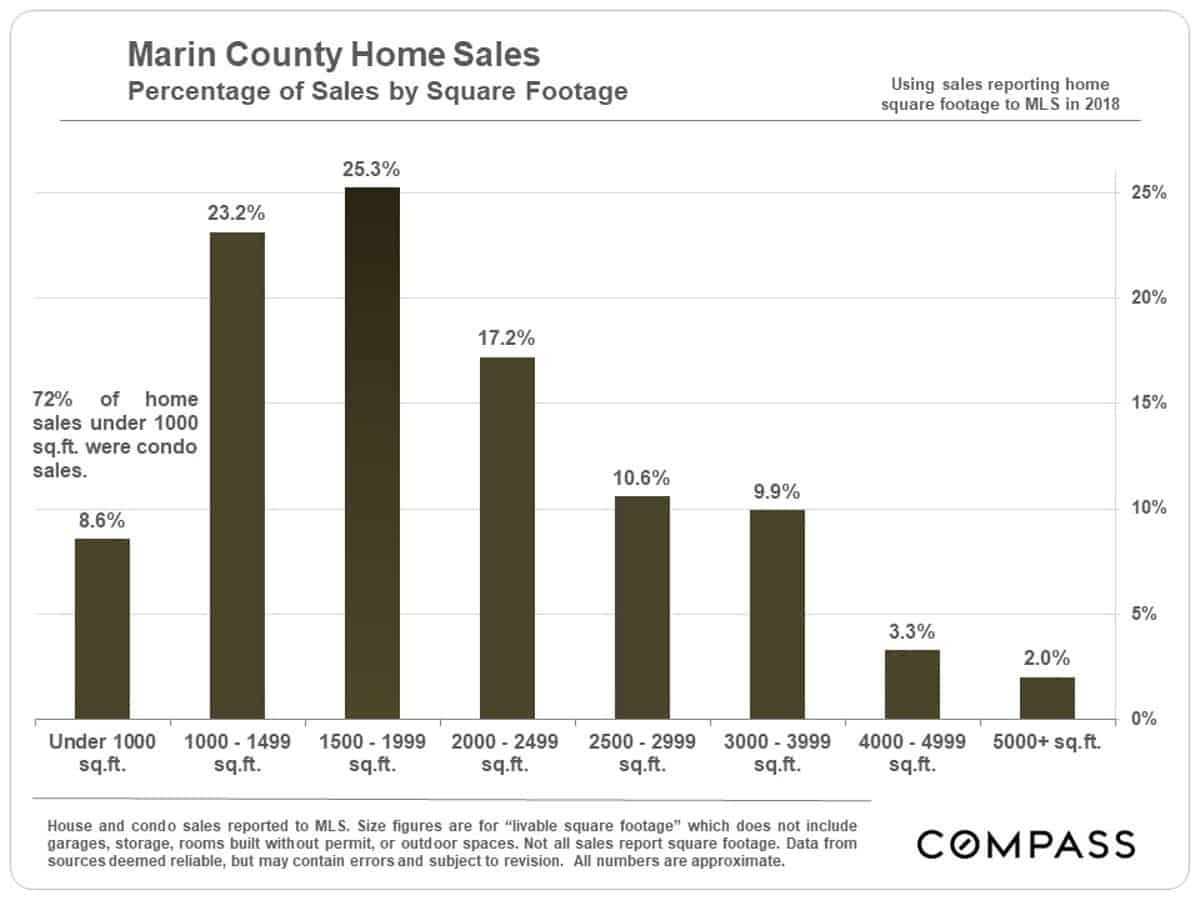
Marin Home Sales by Size
One of the many differences between Marin and San Francisco is that Marin has much higher percentages of larger homes: 60% of SF sales in 2018 were of homes smaller than 1500 sq.ft., while in Marin the percentage was only 32%. Factors behind this are age of construction, the quantity of condo construction in recent decades, household affluence and median household size. (Generally speaking, Marin has newer houses, fewer condos, more affluence and larger households.)
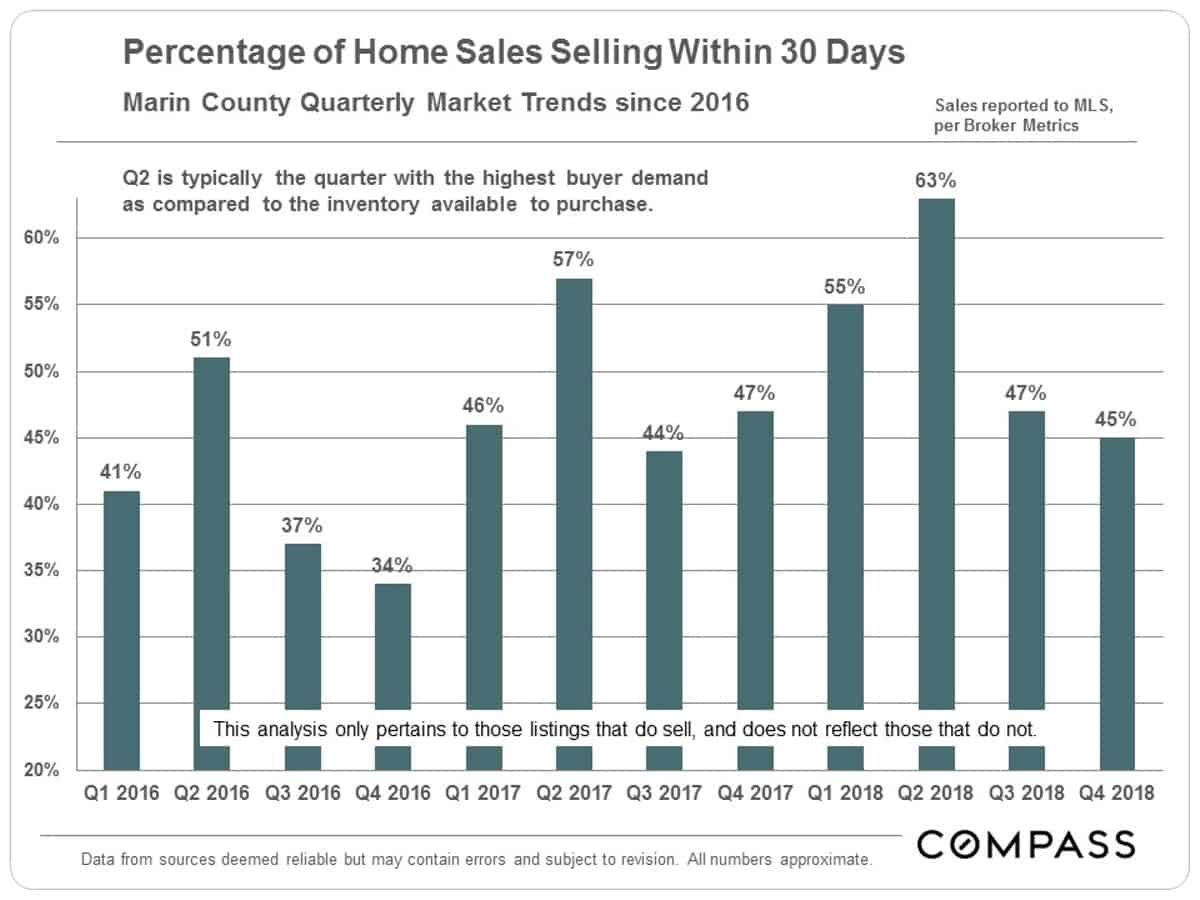
This next chart illustrates how the extremely hot spring 2018 market in Q2 cooled off in the second half of the year. This cooling is a relatively common dynamic each year, and Q3 and Q4 2018 readings are very similar to those in Q3 and Q4 2017. Some other Bay Area counties have seen more market softening than Marin since last summer.
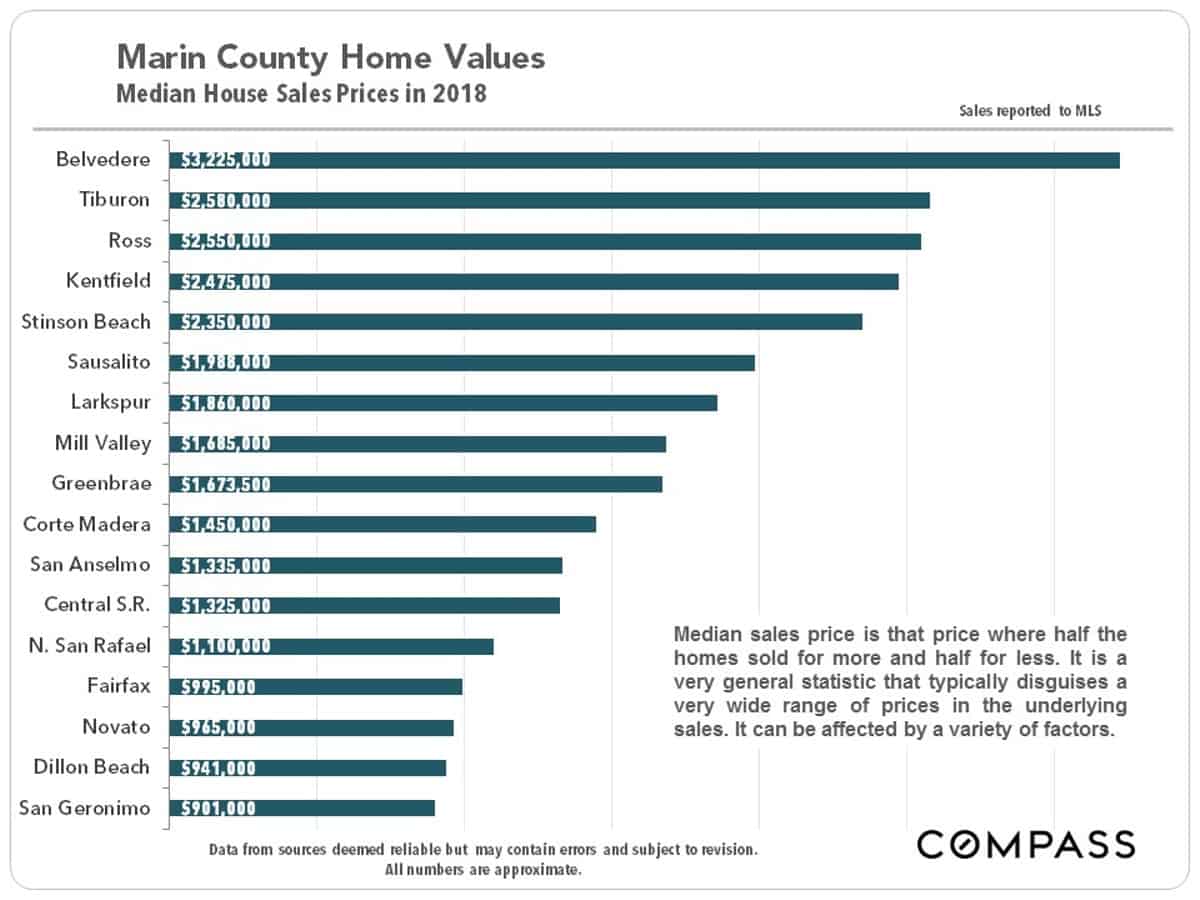
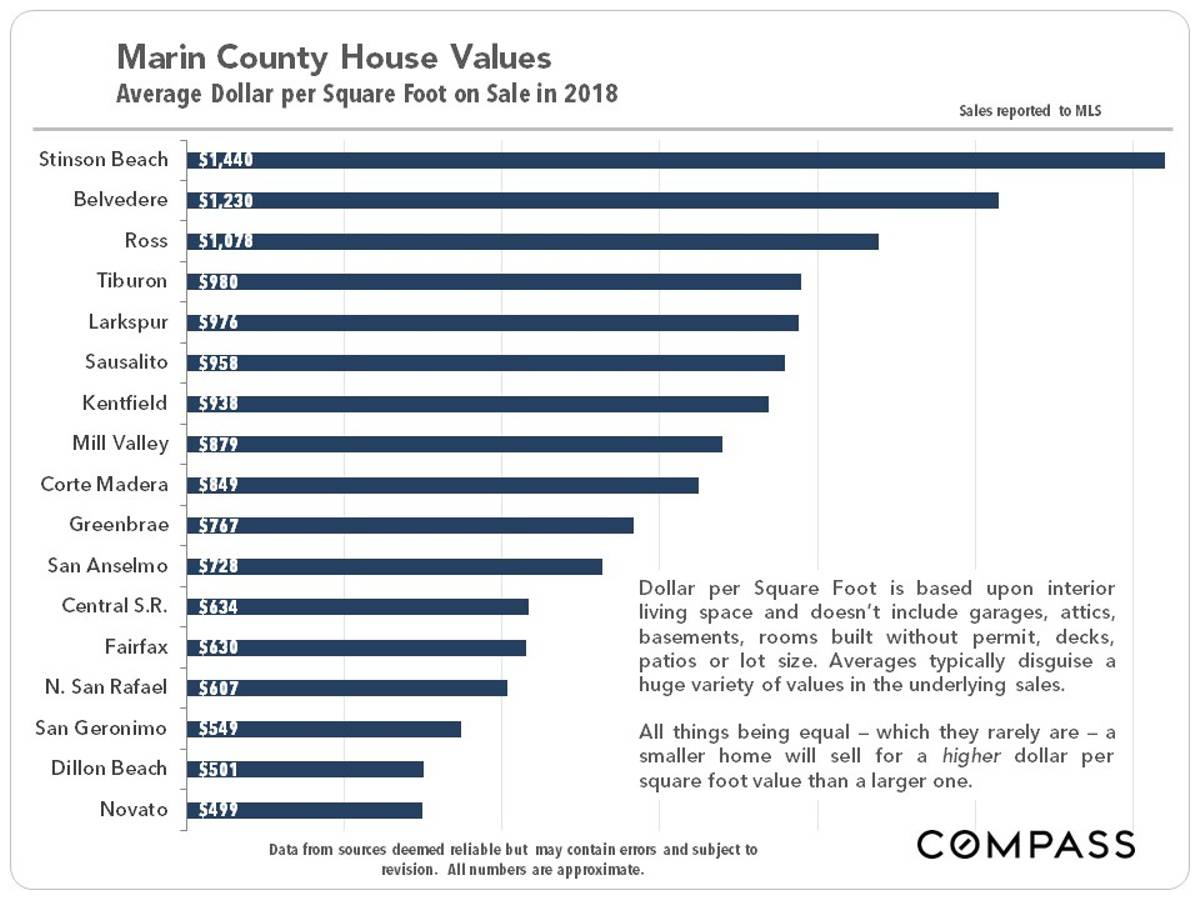
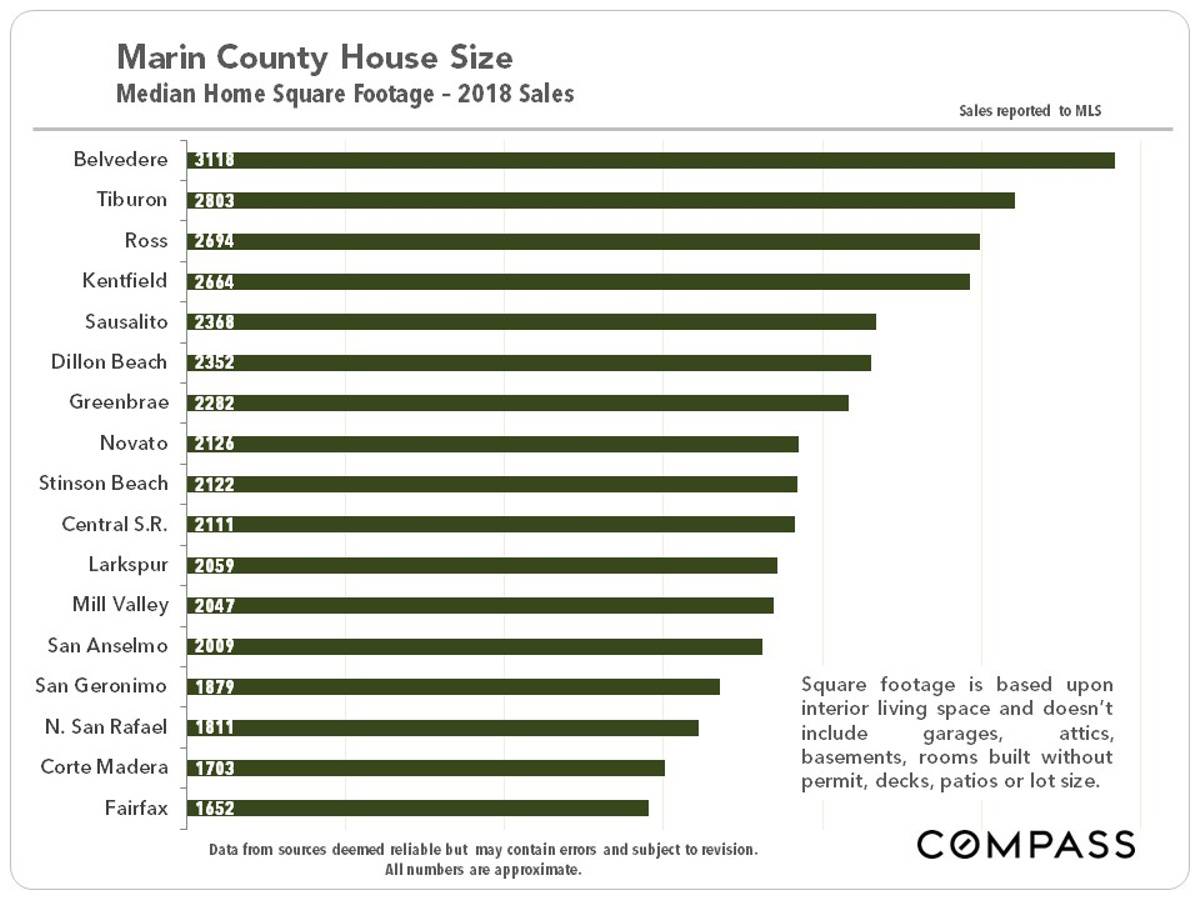
Median Price, Average Dollar per Square Foot & Median Home Size by City
City values are influenced by many factors, including location, of course, but median home size is another basic consideration. All things being equal – especially pertaining to the quality of location – a smaller home will sell for a lower price, naturally, but a higher dollar per square foot value. The fact that Belvedere has the largest median home size and close to the highest average $/sq.ft. value (plus the highest median home sales price) establishes it clearly as the most expensive market in Marin (and one of the most expensive in the Bay Area). But there are several very affluent communities – Ross, Tiburon, Kentfield and so on – close behind it. And of course, communities with lower median or average values often contain extremely expensive homes as well.
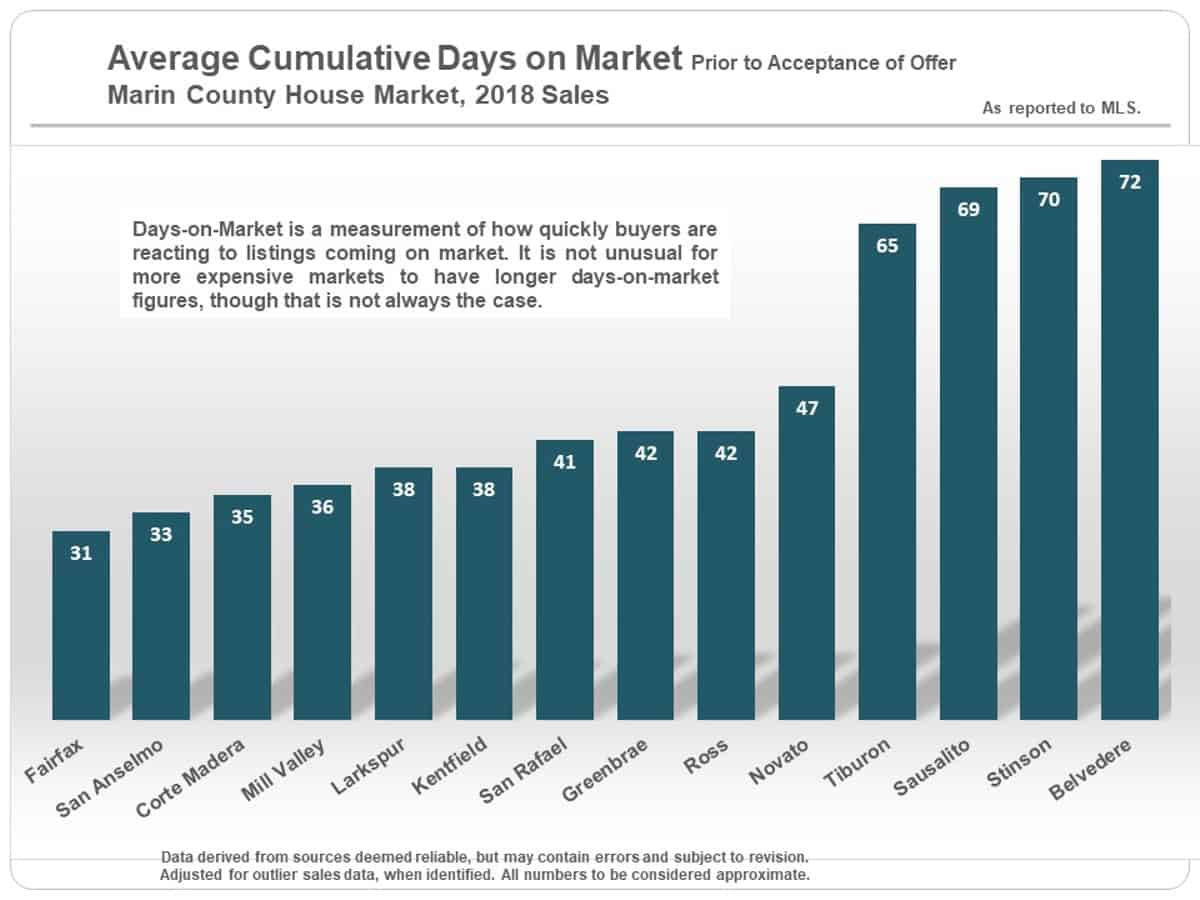
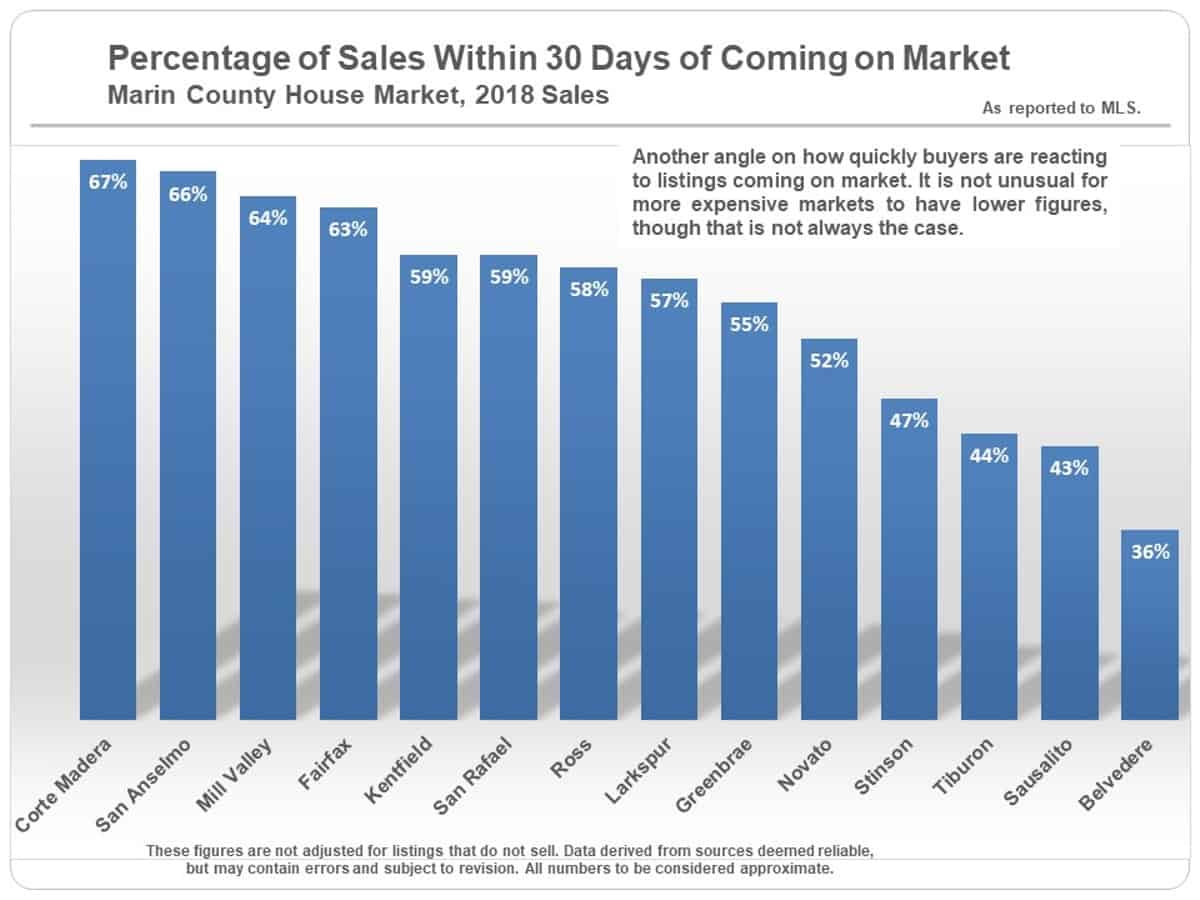
How Quickly Homes Sold, by City
With average days on market, the lower the number, the faster buyers are snapping up new listings coming on the market. It is not uncommon for more expensive homes to have higher average days-on-market readings: The pool of buyers is much smaller, and the sellers of large, gorgeous homes are somewhat more prone to overpricing.
With the percentage of sales occurring within 30 days of being listed, the higher the percentage, the stronger the demand as compared to the supply of listings. Again, more expensive homes will often see lower percentages.
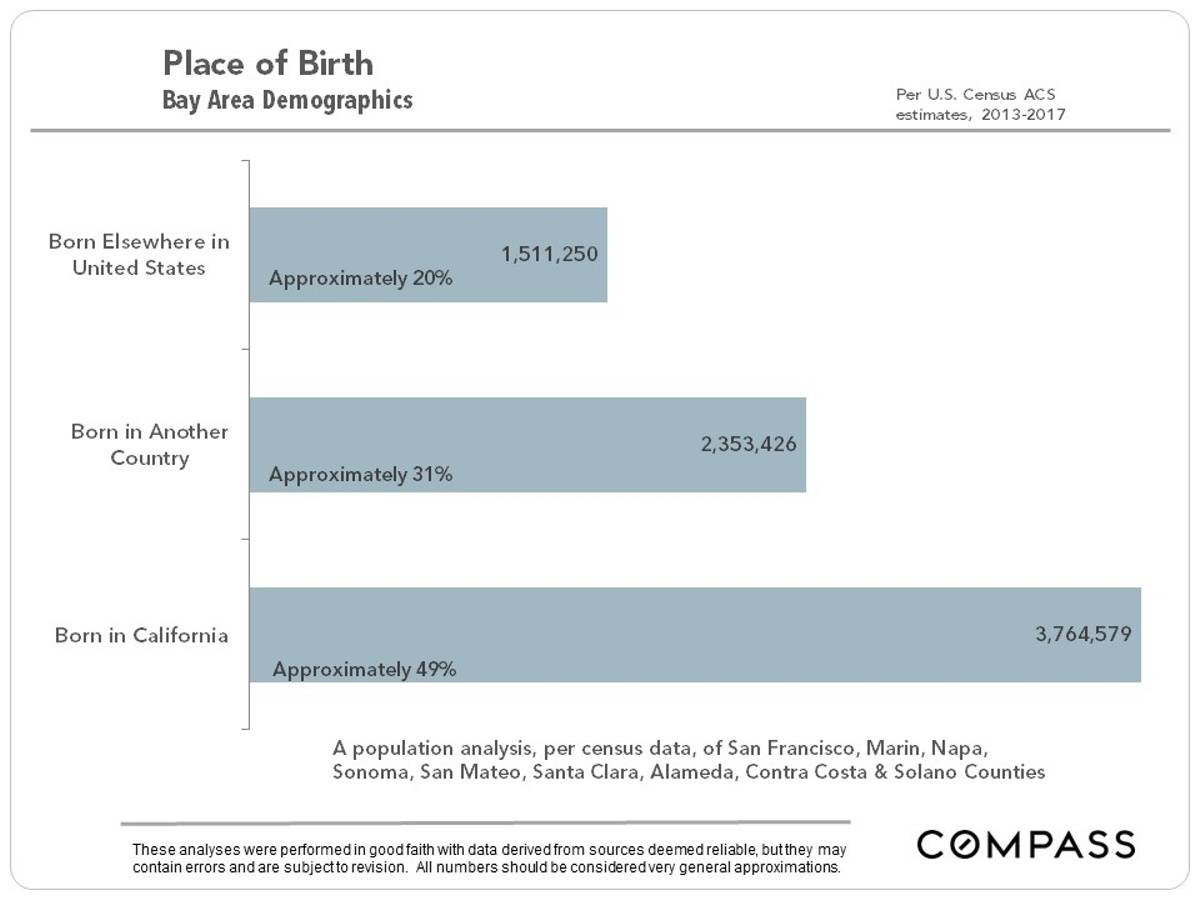
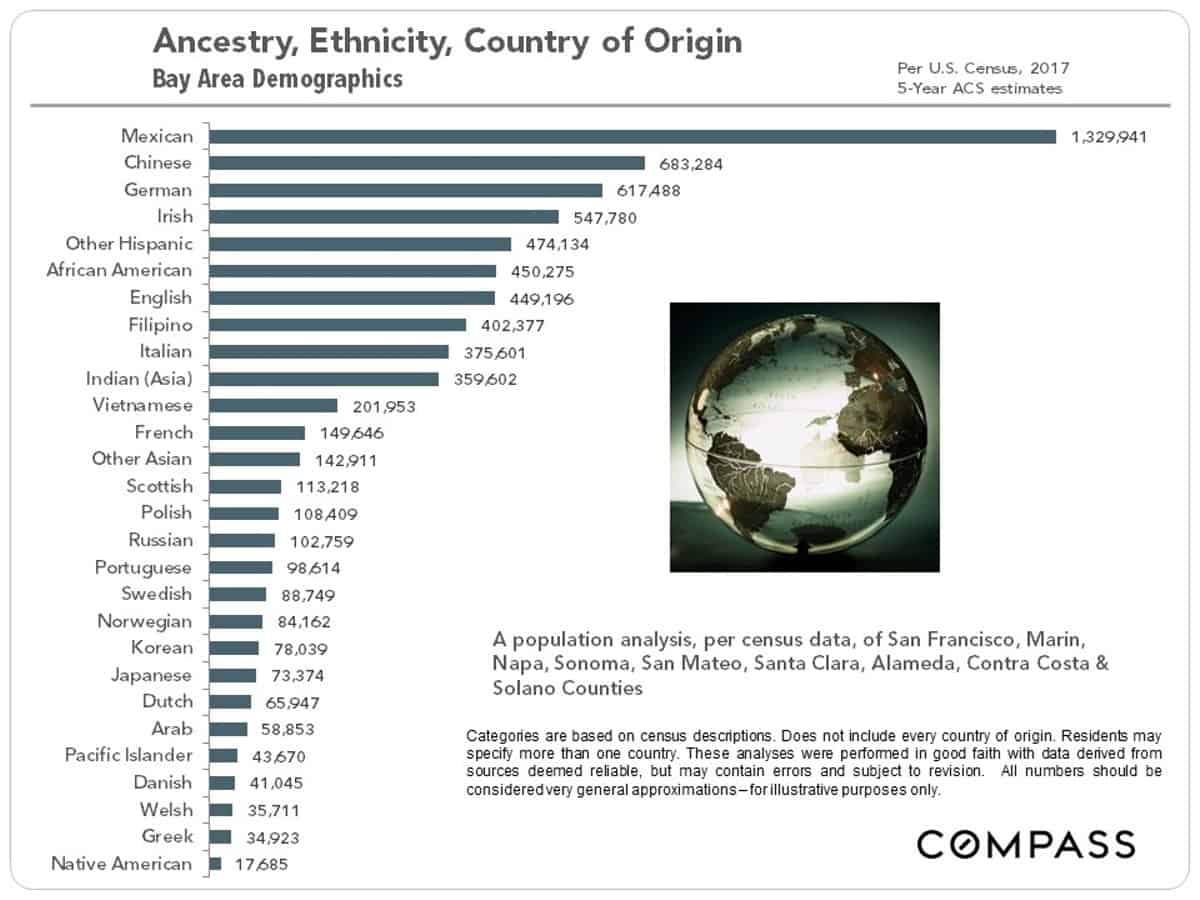
A Very Multi-Cultural Place – Bay Area Demographics
Before looking at the next charts, here is the demographics quiz question for today: What 4 nationalities account for the origin of the highest numbers of Bay Area residents?
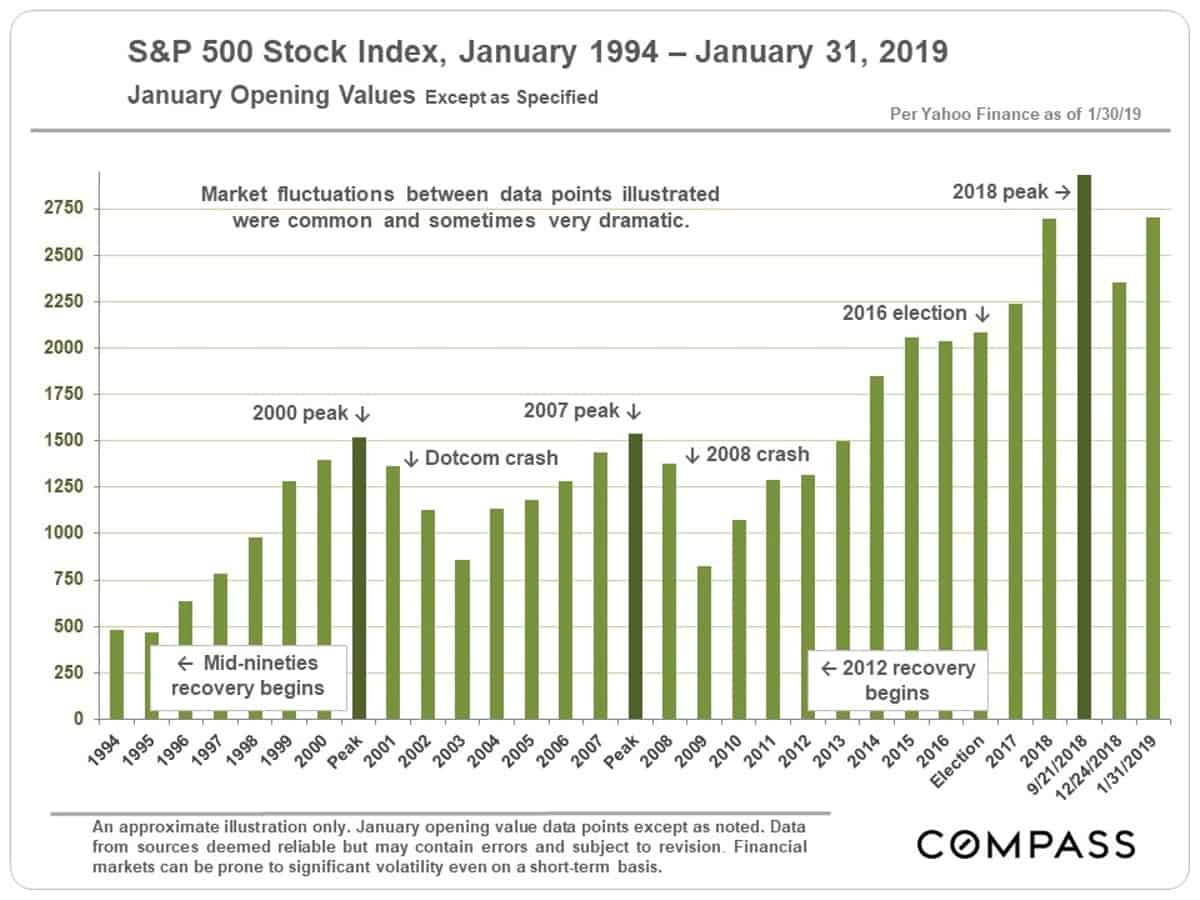
 Stock Prices & Interest Rates
Financial markets and interest rates often influence real estate markets. Changes in the S&P 500 since the 2016 election have been very dramatic. The queasy volatility seen in stock prices – and its effect on household wealth – since they peaked in early autumn has been a wild ride for investors, and for many home buyers.
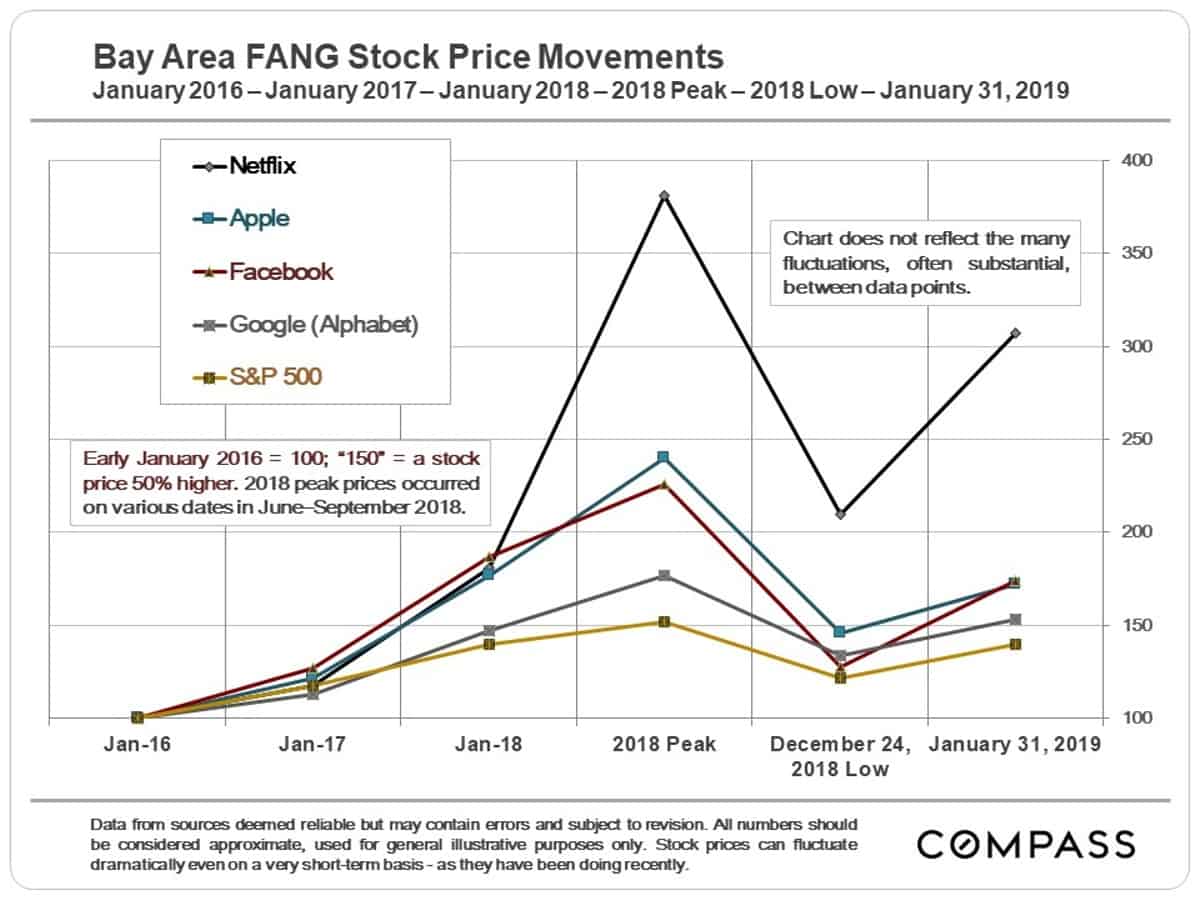
The changes in the stock prices of some of our Bay Area high-tech giants over the past 3 years make the fluctuations in the S&P 500 look modest. If the big, local unicorn IPOs go forward in 2019 as currently expected, and are received enthusiastically, they could have a substantial effect on housing markets.
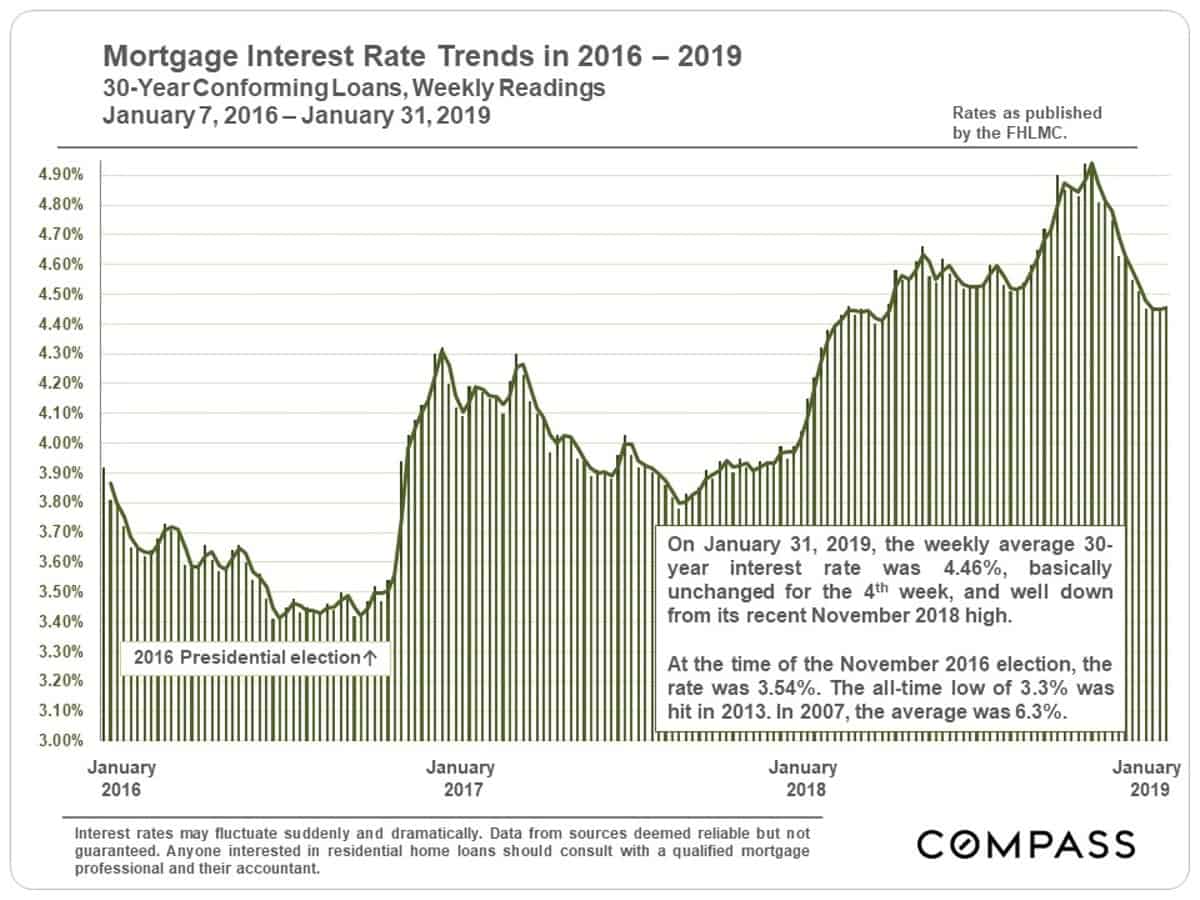
Interest rates are a major factor in housing costs and the ability to qualify for home loans. After hitting its most recent high in November, rates have dropped off considerably. Such declines sometimes spark renewed buyer motivation to move forward quickly.