Marin February 2021 Real Estate Market Report

Marin County Real Estate
Strong Finish to 2020 & Heated Start to 2021
February 2021 Report
Our January report focused mostly on 2020’s annual statistics. This report will put most of its attention on quarterly and monthly indicators, which better illustrate changes occurring as 2020 progressed and 2021 began.
In January, new listing activity started to pick up after the typical annual low hit in December, and the number of new listings was significantly higher than in January 2020. The number of listings accepting offers in January was also higher – up 36% year-over-year: A dynamic beginning to the 2021 market.
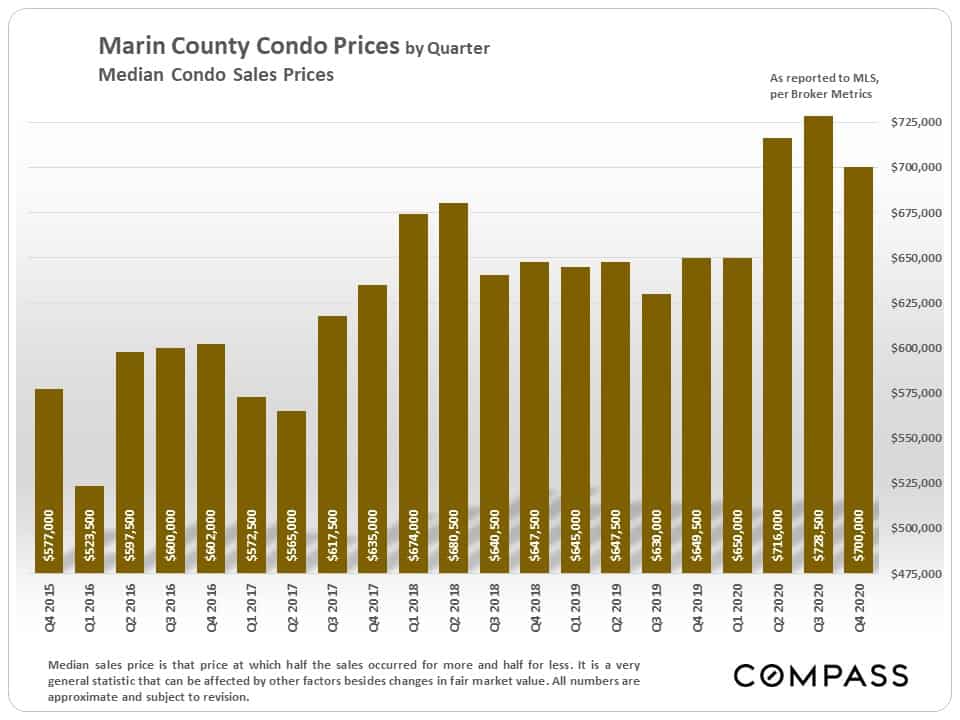
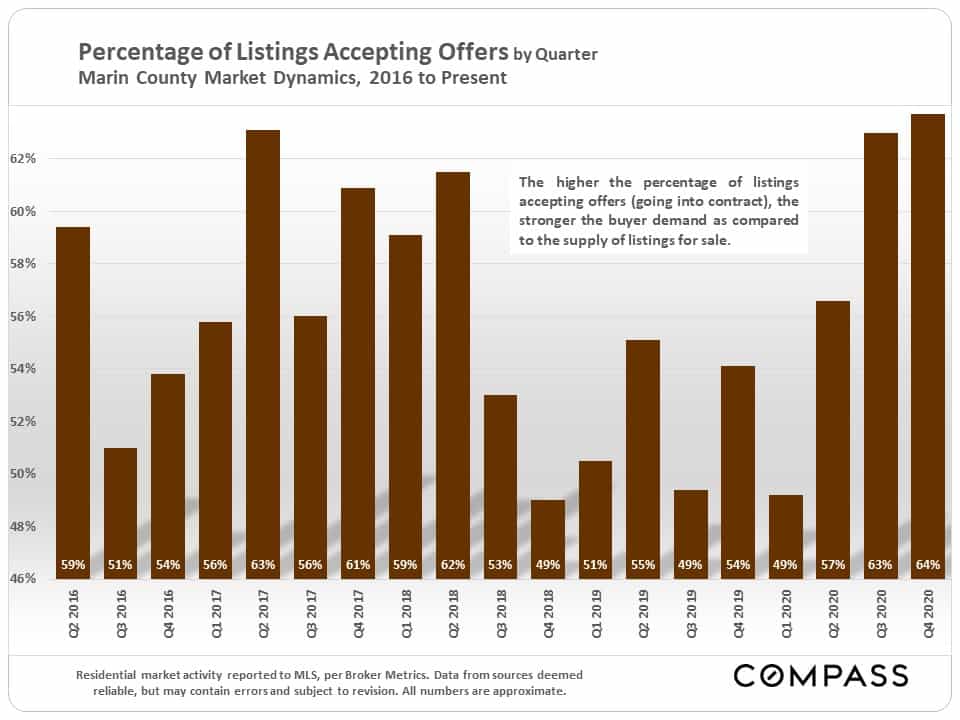
Regarding the first chart: The second half of 2020 was consistently a very heated, high-demand period, but Q3, coming not long after shelter-in-place hit home in San Francisco, saw particularly feverish activity – especially for luxury homes. Luxury home sales in Q3 were up a staggering 150% year-over-year. This caused the abnormally large Q3 jump in median sales price.
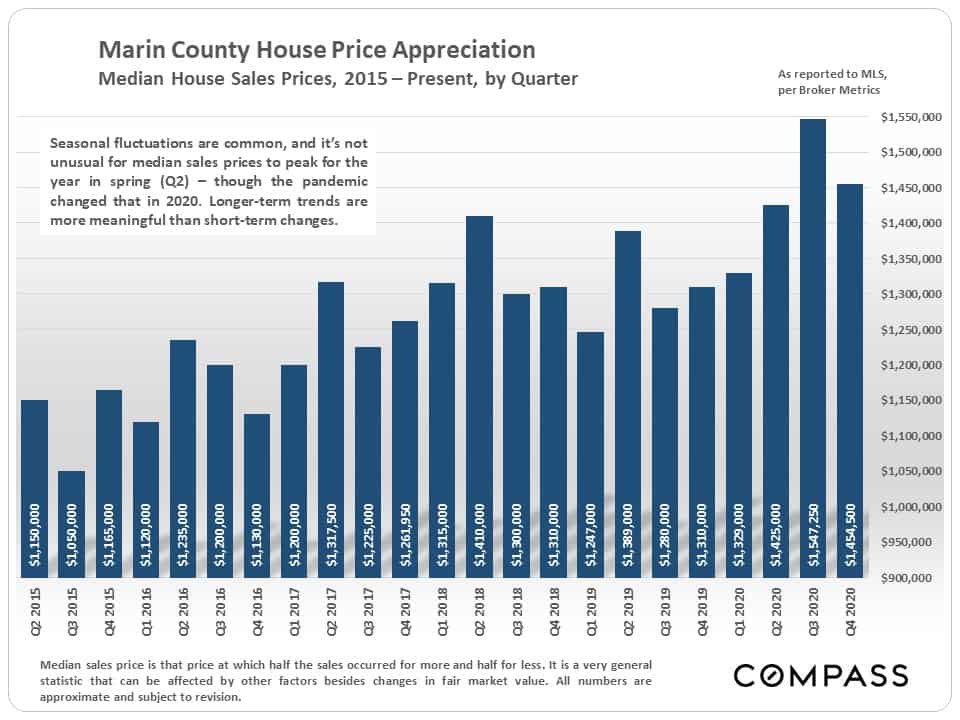
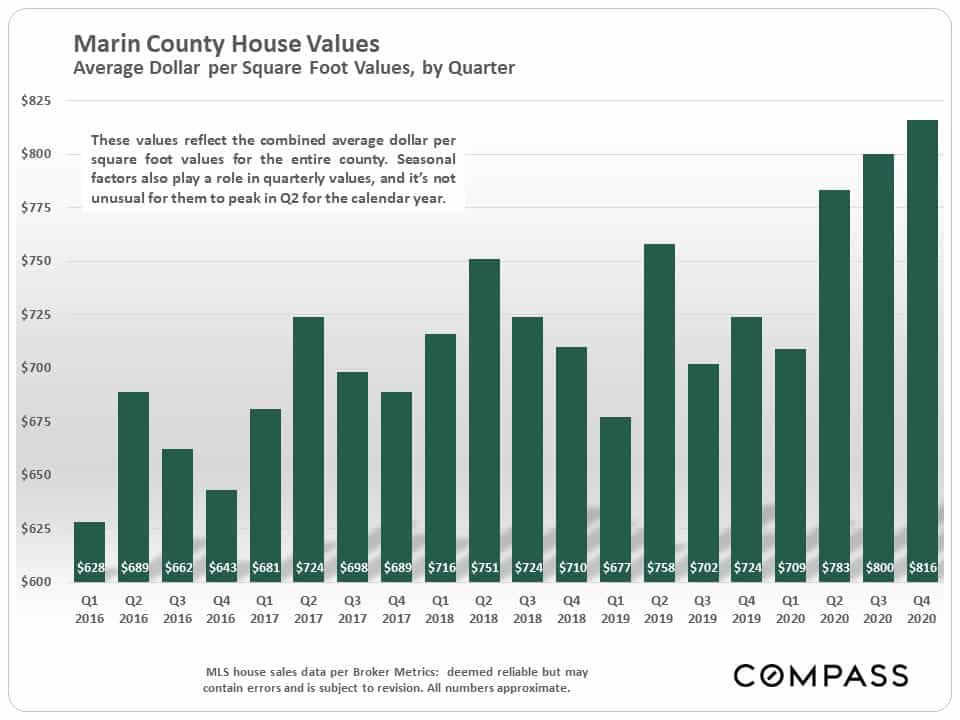
Median sales prices and average dollar per square foot values don’t always march hand in hand – there are a number of factors at play – however, their longer term trends are almost always similar.
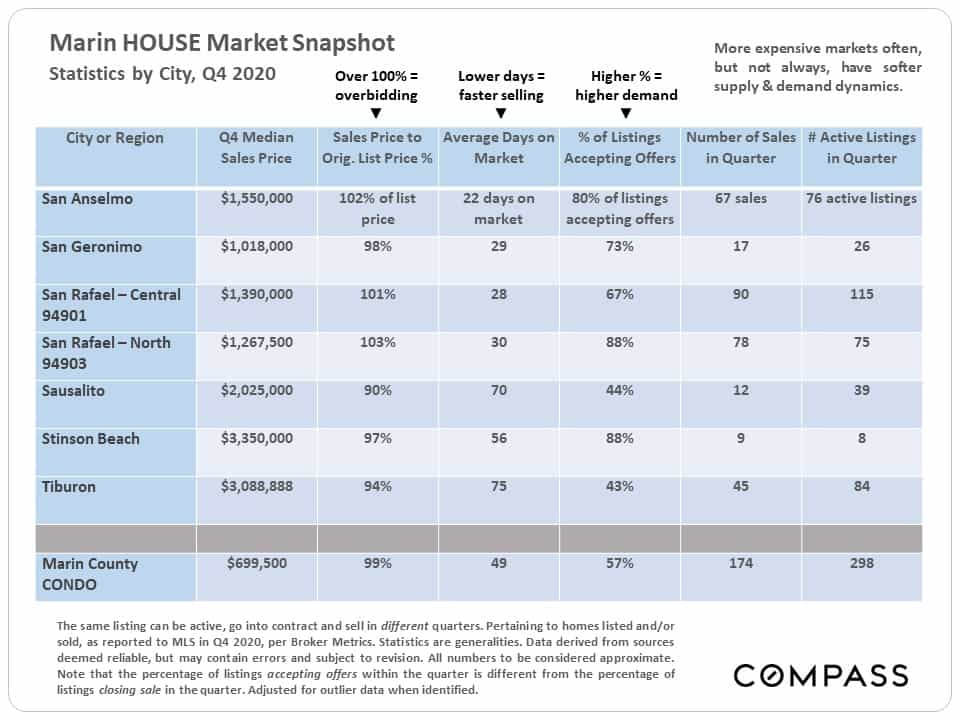
The 2 tables below reflect market statistics and values for Q4 2020 only, which will often be different than those for the full year 2020. Median sales values can fluctuate for a number of reasons, and are especially prone to do so in markets with low sales volumes and high prices.
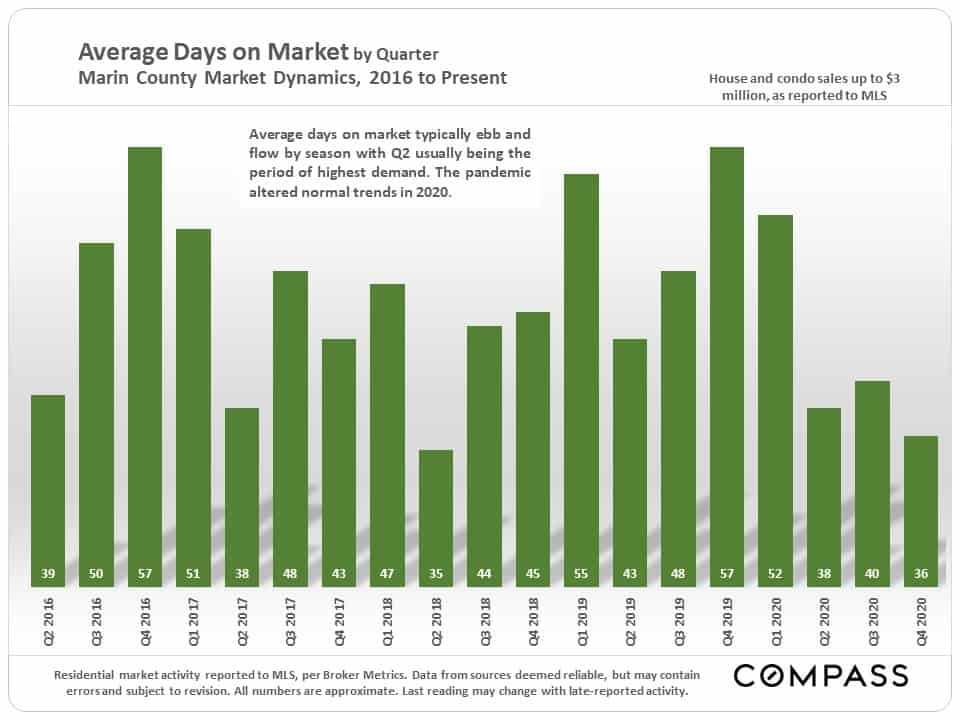
Note that it is not unusual for more expensive markets to have softer supply and demand statistics – such as higher average days on market figures, and lower percentages of listings accepting
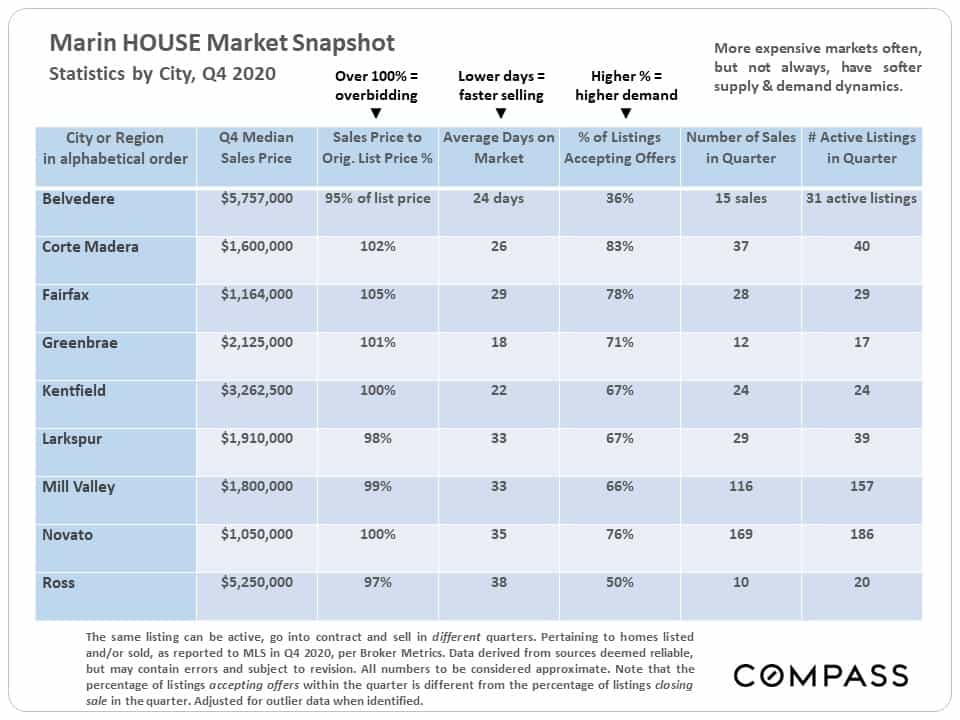 offers within the period – though this is not always the case.
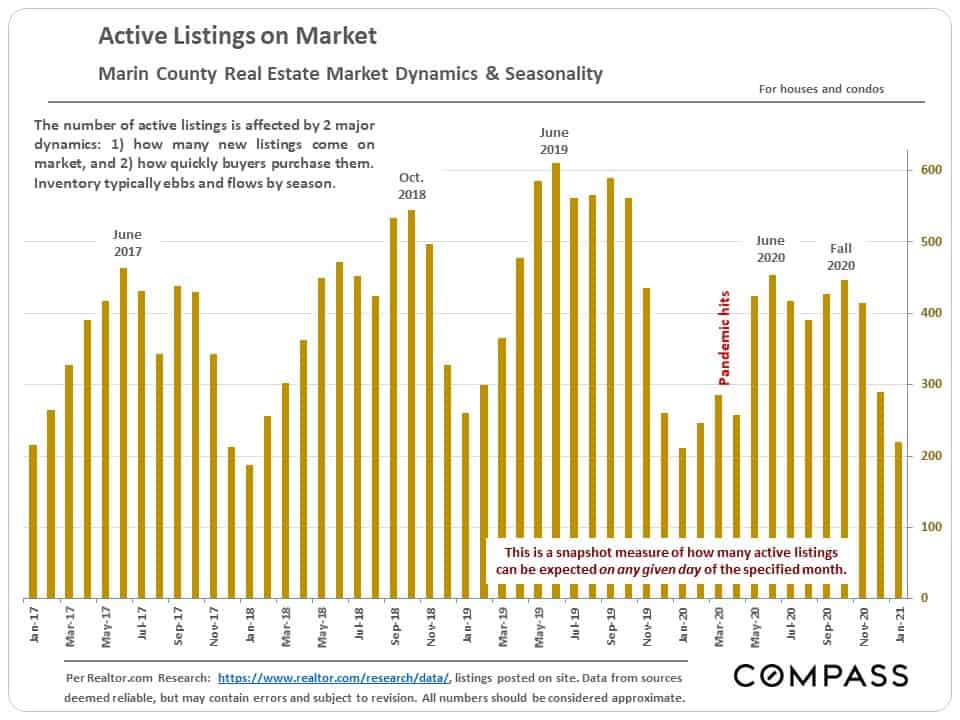
Generally low inventory levels of listings on the market over the past year played a large role in the heat of the market. Listing activity has simply not kept pace with buyer demand.
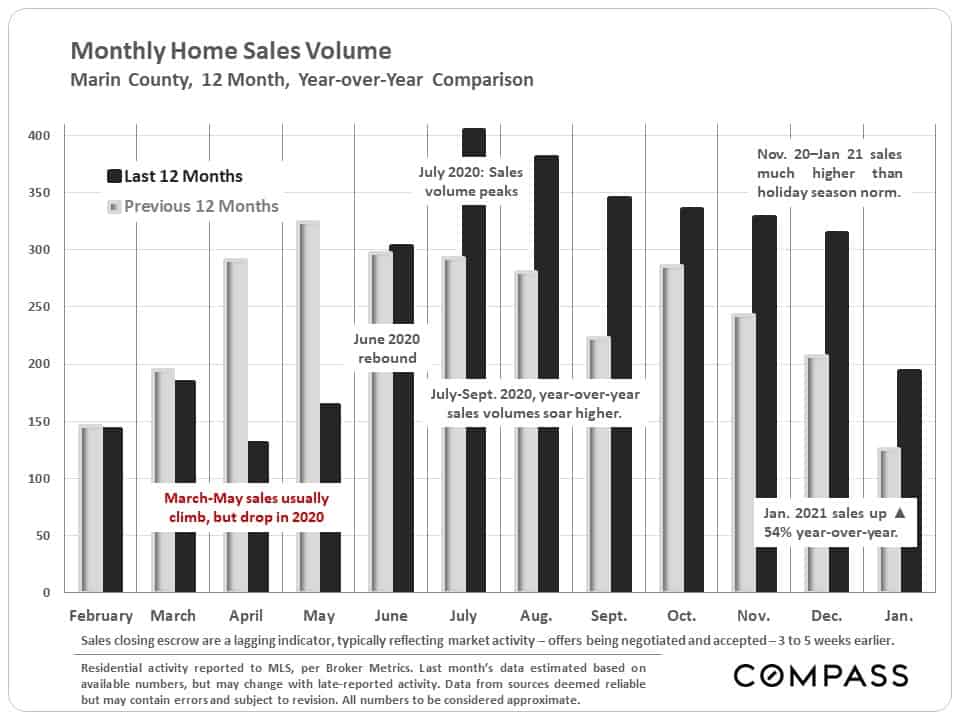
Month by month, year-over-year comparison of home sales volumes – illustrating the initial pandemic crash in activity followed by the market rebound that saw monthly sales volumes climb far above the levels of the previous year.
Sales volume in January was more than 50% higher than in January 2020, a tremendous increase.
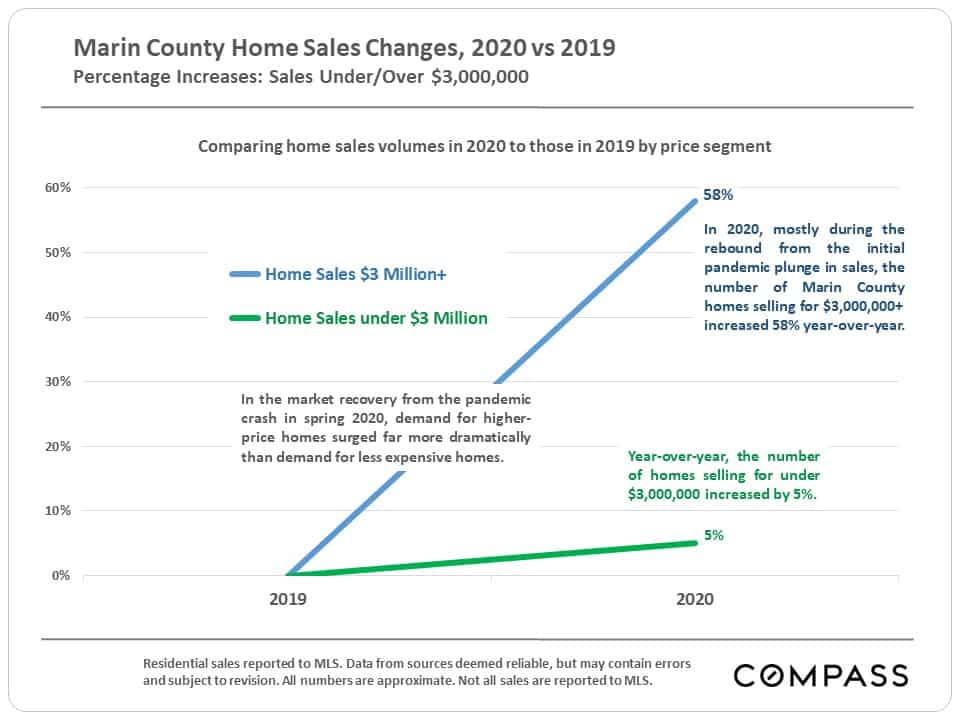
The next chart compares the year-over-year changes in sales of homes selling for over and under $3 million. Sales in the higher price segment saw a very substantial jump, while sales under $3 million saw a much smaller increase. However, neither statistic really does justice to the rapid acceleration in market activity occurring in the second half of the year.
The big surge in high-price home sales was a common dynamic around most of the Bay Area, though few saw increases as large as Marin’s.
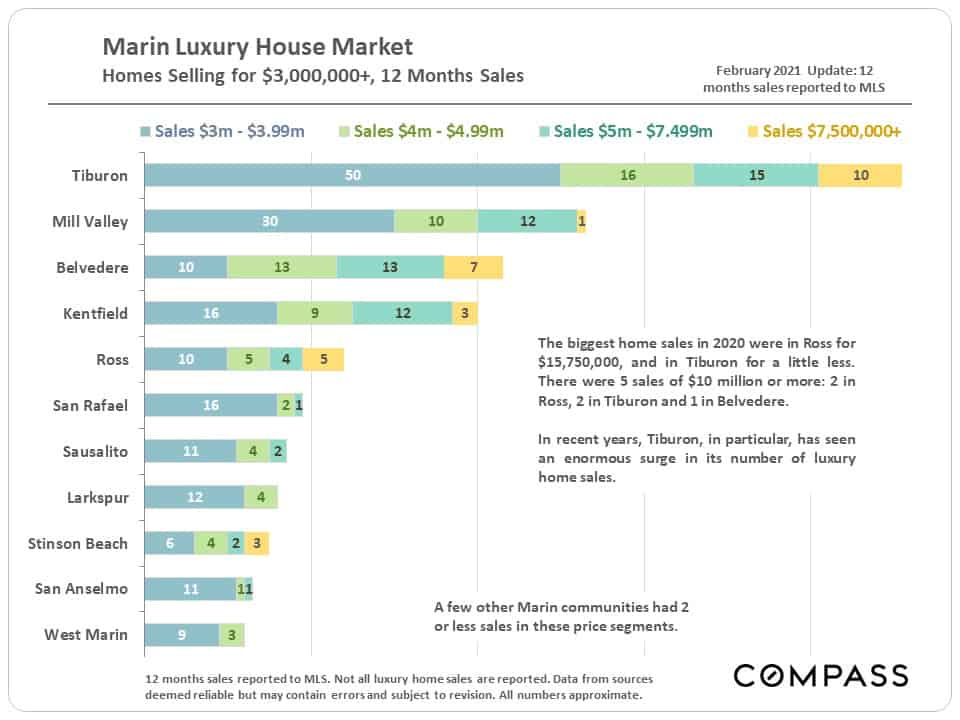
Luxury home sales by city and price segment:
Two classic indicators of supply and demand:
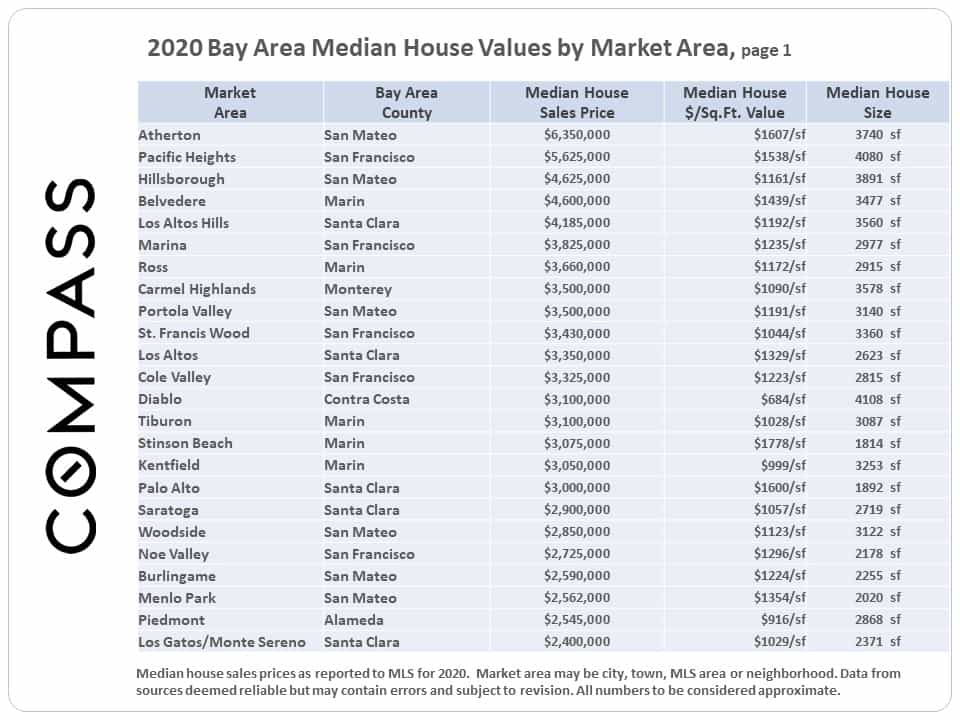
Below is the first table of a full-year 2020 home value analysis of markets around the Bay Area, ranked by median sales price, highest to lowest. Marin is well represented at the top of the list. The full ranking list and home price map are here: Bay Area 2020 Home Prices.
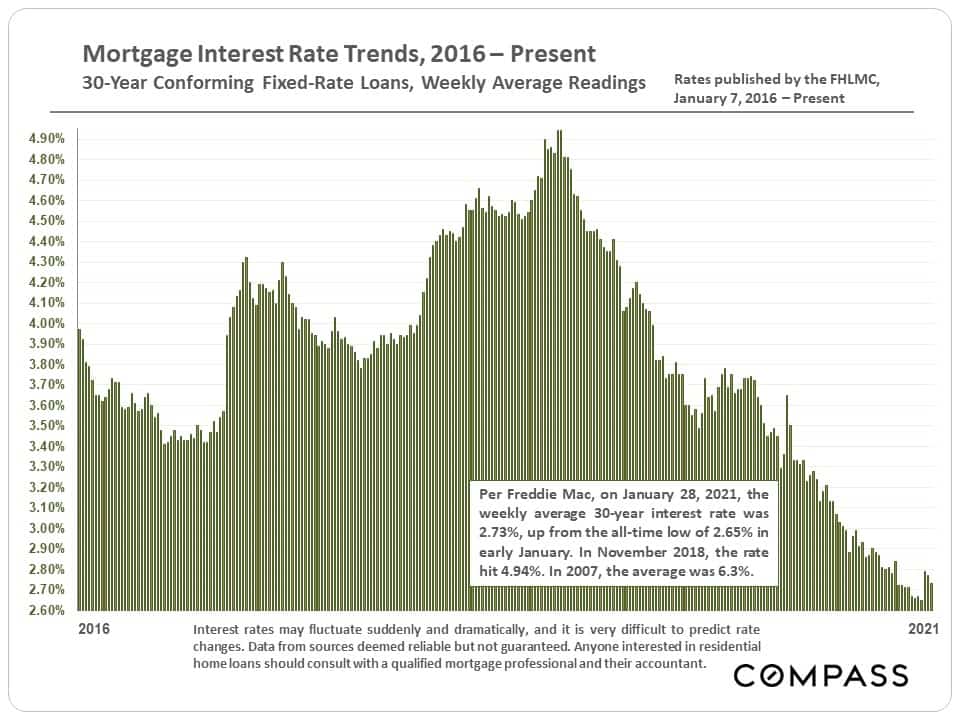
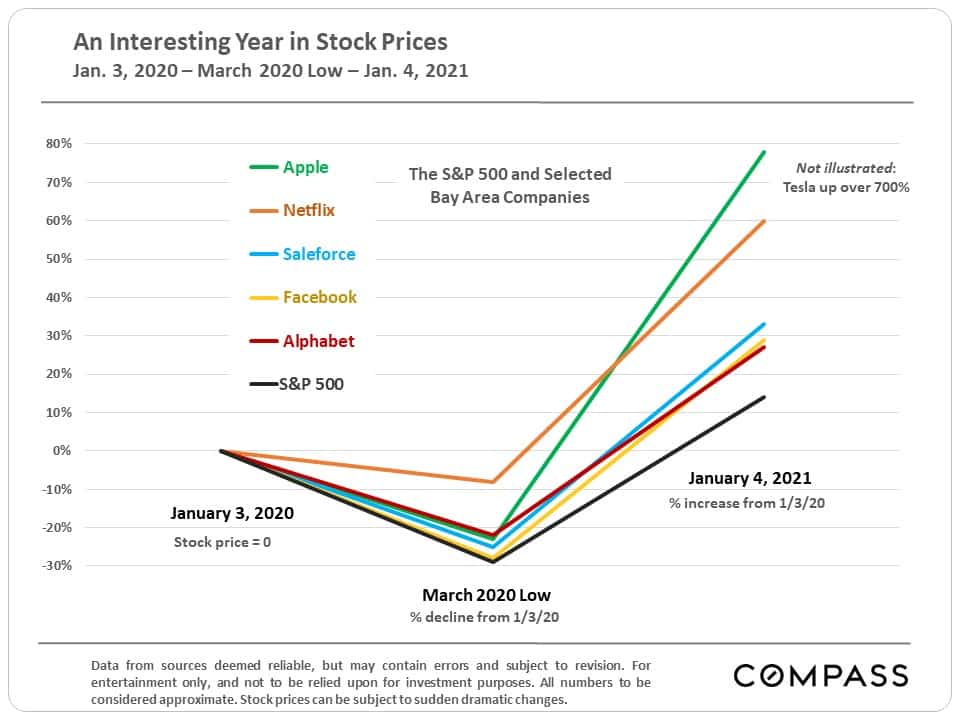
Two of the factors behind the housing market recovery were the dramatic drop in interest rates, and the significant rebound in the stock market – especially of some of our local high-tech giants.